Forensic sciences: Effects of stress and perturbations on soil communities/Printable version
| This is the print version of Forensic sciences: Effects of stress and perturbations on soil communities You won't see this message or any elements not part of the book's content when you print or preview this page. |
The current, editable version of this book is available in Wikibooks, the open-content textbooks collection, at
https://en.wikibooks.org/wiki/Forensic_sciences:_Effects_of_stress_and_perturbations_on_soil_communities
Introduction
Testate amoebae
[edit | edit source]Testate amoebae, thecamoebians, or testaceans are a polyphyletic group of unicellular ameboid protists. Under the current taxonomy, testate amoebas are classified in the group of amoeboid protozoans in the classes Lobosea and Filosea in the Superclass Rhizopoda.[1]
Biology and ecology
[edit | edit source]They are found in many habitats such as mosses, soils, peatlands, lakes, rivers and estuarine environments around the world.[2] In soils, the main factors explaining their abundance and community structure are the moisture content and water chemistry. Amoebae require the presence of humidity because, as aquatic organisms, a they have to live constantly in water. If conditions become less favorable, especially if the soil dries out, they have the ability to form cysts to avoid desiccation.[1] Encystment in these species allows also dissemination.[3] These protozoa can tolerate a wide temperature range depending on the species, thus they can be found in the tropics and in the polar regions. It has been also shown that the distribution of testate amoebae on earth is also limited by pH. Some species can live in acid moors and other in alkaline soils, while a smaller number of species can even tolerate both kinds of habitats.[4]
As their name suggests, the feature of this group of amoebae is the presence of a test that is lacking in naked amoebae. This test is constituted by various elements.[3]
Each species of testate amoeba has a specific test morphology and composition that allows to recognize and classify them. Even after the death of the amoebae, the tests remain in soils, sometimes for hundreds of years. As they are very sensitive to disturbances of environments they can be a good bioindicator in various research fields (ecology, paleoecology, paleolimnology, paleoclimatology, peatland regeneration, soil and air pollution monitoring and ecotoxicology).[5] Their size varies between 10 and 500 micrometers. Most have a size between 20 and 200 micrometers but larger individuals have been observed with a size of up to 2000 micrometers.
Testate amoebae move and feed through its pseudopods. Smaller species are essentially bacterivorous. However larger species can also use other sources of food such as protists, including other testate amoebae or naked amoebae, fungi, small metazoans, algae and detrital organic particles.[4]
The reproduction mode, still little known, is by replication of the parent by asexual binary fission. The doubling time of the population, under natural conditions, is estimated between six and eleven days.[4]
Classification
[edit | edit source]The two main criteria for classifying testate amoebas are the test structure and the pseudopod morphology. The type of test can be divided into three main groups according to its composition:
- A protein test that is organic and made of composite structural proteins either blocks or homogenous layers.
- An agglutinated test which comes from exogenous collected materials such as mineral particles of Diatoms or silica platelets of Euglyphida.
- A siliceous or calcareous tests made of rods, nails or plates that are produced by the organisms themselves.
Testate amoebae can be separated into two groups according to the shape of their pseudopodia. Lobose testate amoebae are grouped within the phylum Amoebozoa and are characterized by lobed or finger-shape pseudopodia. Filose testate amoebae are grouped within the phylum Cercozoa and are characterized by thin pseudopodia. The development of new molecular methods molecular classifications now allows to reassessing the classification based on pseudopodia morphology.[2]
Diversity
[edit | edit source]The two main testate amoebae orders are Arcellinida and Euglyphida. The order of Arcellinida belongs to the lobed testate amoebae and are the most numerous. They represent approximately three quarters of all known species of testate amoebae. The order of Euglyphida belongs to the filose testate amoebae.
Forensic sciences
[edit | edit source]| Wikipedia has more on |
Forensic sciences is the use of scientific knowledge and methodology in order to resolve criminal investigations. The estimation of the post-mortem interval (PMI) is one of the major purpose in forensic sciences because it is fundamental in solving criminal cases. Indeed, it allows, among other things, to restore order in which events occurred. Nowadays, there are two main possibilities to determine it:
- Medical techniques: These techniques allow the post mortem dating. It uses, for example, the temperature of the body or the rigor mortis. It allows to estimate the PMI from a couple of hours to approximately three days. After that amount of time, medical methods are no longer possible.
- Forensic entomology: By the observation of larval stages of flies and beetles, forensic entomologists are able to estimate the PMI after several weeks.[6]
For a longer PMI, these techniques are no longer precise enough. Therefore, in the last decades, seeing that a cadaver alter visibly the surrounding environment, scientists have been interested in the influence of a cadaver on the soil components in order to discover new techniques allowing the PMI determination. Studies have been made on the effect of a cadaver on soil nutrients, pH and fungi and microbial communities. It has been shown that phosphorus, carbon and nitrogen concentrations (amoung others) as well as the pH level increases strongly in a soil below a cadaver.[2][7][8] These enhancements persist two years after a corpse has been laid on the ground.[6] Populations of bacteria and fungi also increase strongly in the presence of a cadaver.[2][8]
Therefore scientists have assumed that these major environmental changes beneath a cadaver could strongly influence the composition of testate amoebae communities, which are very sensitive, among others, to moisture rate, pH, nutrients and prey community changes.[2]
Testate amoebae in forensic sciences
[edit | edit source]Testate amoebae is a group of protist which is frequently used as bioindicators. A bioindicator is an organism that can be used for the detection and quantitative characterization of a certain environmental factor or a complex of environmental factors. For example, testate amoebae seems to be the best agricultural bioindicator, as they are highly sensitive to pesticide treatments.[2] Testate amoebae can be used as bioindicators, because they own characteristics that make them ideally suited to this type of study:[2]
- Their test is conserved even after the death of the organism and can even fossilize in peatlands (in other environments, the test is not conserved for a long time after death).
- They are present in a wide range of habitats and are very abundant.
- They are easy to find and identify (even if it is time-consuming and if the taxonomy isn't complete yet).
- They are strongly sensitive to abiotic and biotic environmental changes and their response can be observed very quickly, discernible by morphological adaptations and community structure changes.[2][9]
- They can encyst and excyst under stressful circumstances.
A study interested in the influence of a cadaver on testate amoebae communities has shown that a cadaver strongly decrease the diversity and the abundance of testate amoebae beneath the body. Observations showed that after 22 to 33 days no living amoebae was still present under the corpse.[5] A recovery of the amoebae community occured after the end of the active decay phase, which is from one month up to two months,[6] but still after 10 months, recovery was not entirely completed.[5]
The decrease may be caused by several motifs. An additional study showed that it was correlated with an important nitrogen and organic carbon input in the soil beneath the cadaver. The decrease might occured because of the anoxic conditions or because of the direct high nitrogen concentration.[6][10] Furthermore, the large nutrients input and pH variations (caused by the intake of ammonium ions [7]) produces big changes in the bacterial abundance and community structure.[6] Bacteria are the main diet of testate amoebae and it is likely that some species are very specialized in a type of prey. It is therefore possible that any change in the prey community results in a change in the amoebae community.[6][11][12] Indeed, it has been proven in several studies that testate amoebae are strongly linked to moisture rate, pH, temperature, prey availability, and nutrients changes, by direct or indirect effects.[2] The changes that occur in community structure, following a chronological pattern, could be used as a tool to determine the PMI.
In conclusion, using testate amoebae for forensic purposes, with a focus on testate amoebae community structure, recovery time and succession pattern, is totally appopriate.[5]
Even if the taxonomy is still incomplete and the species identification time-consuming,[2] improvements in molecular approaches are likely to make the use of testate amoebaes in forensic sciences more accessible.
The cadaver impact on soil
[edit | edit source]A cadaver in the ecosystem
[edit | edit source]The decomposition process is a central point in the energy and matter cycles. Indeed, Philip S. Barton wrote:
« Up to 90 % of organic matter generated by plants is not consumed when living and enters the detritus pool. Animals consume the remaining 10 %, incorporate this into new tissue for growth and development, and eventually return these nutrients to the detritus pool as excreta and carrion”.[8]
The arrival of a cadaver in an ecosystem leads to important changes. Indeed, its fast decomposition process, its nutrient richness and its patchy influence make him a fundamental hotspot of biological and chemical activity (compared to plants).[8]
Furthermore, it brings a large increase in the biodiversity, caused by the attraction of insects, microorganisms, scavengers and predators for this unusual source of food. A carrion decomposition, controlled by temperature and moisture rate, affects and accelerates the temporal and the spatial dynamic of the ecosystem and its communities. The spatial dynamic is influenced by the energy and nutrients flows and the temporal dynamic is influenced by the species succession.[8]
The microbes are fundamental in the recycling process because they mineralize the fundamental nutrients and make them available for plants, which are the initial link of the food chain. Arthropods and scavengers disperse the nutrients in an horizontal direction. At the end, all animal, predator or prey, will re-enter the decomposition cycle upon its death.[8]
Ecological succession theory
[edit | edit source]Ecological succession is the observed process of change in the species structure of an ecological community over time. The time scale can be decades (for example, after a wildfire), or even millions of years after a mass extinction.[13] For a cadaver, it can be counted in days.
The community begins with relatively few pioneering plants and animals and develops through increasing complexity until it becomes stable or self-perpetuating as a climax community. The ʺengineʺ of succession, the cause of ecosystem change, is the impact of established species upon their own environments. A consequence of living is the sometimes subtle and sometimes overt alteration of one's own environment.[14]
The difference between a succession in plant ecology and in carrion ecology is that once the resource is exhausted, the carrion ecosystem does not reach a climax.[8] Nevertheless, lots of studies have demonstrated that different communities of organisms (especially arthropods) follow each other through time, in parallel with the progress of the various decomposition stages (The composition of the cadaver changes quickly during the decomposition process, providing various sort of food.). It allows, for example, the use of insects to evaluate the PMI. It is possible that this theory could entirely be applicated to testate amoebae.[2]
Cadaver impact on soil nutrients, moisture, pH and bacteria and fungal communities
[edit | edit source]A cadaver has a fast, huge and localised impact on soil also called « Cadaver Decomposition Island (CDI) ».[7] It releases a large amount of nutrients like nitrogen, carbon or phosphorous. The release of ammonium ions leads to an increasement of the pH.[7] This changes follow a predictable temporal pattern correlated with the mass loss of the cadaver.[8] The release of body fluids and its nutrients in the soil strongly increases the microbial biomass and activity. Indeed, fungal and bacterial abundance and diversity are directly linked with the nutrient content of the soil.[7] Furthermore, in the edges of the CDI, the soil is more fertile and has a broader biodiversity and biomass production.
Decomposition stages
[edit | edit source]Five general stages are used to describe the process of decomposition in vertebrate animals: fresh, bloat, active and advanced decay, and dry/remains.[15] The general stages of decomposition are coupled with two stages of chemical decomposition: autolysis and putrefaction.[16] These two stages contribute to the chemical process of decomposition, which breaks down the main components of the body.
- The “fresh” stage starts at the cessation of the heart and depletion of internal oxygen. Without oxygen, the aerobic metabolism stops and the enzymatic digestion of cells (autolysis) starts. The flies lay eggs and the maggot starts to eat the tissues. Bacterial populations grow up within 24h.
- The “bloated” stage is caused, after 48 hours, by the lack of oxygen which promotes the anaerobic bacteria, which transform sugar and lipids into organic acids like propionic or lactic acid. This is the putrefaction stage. The gas pressure push the fluids out of the body by the orifices (mouth, nose, anus).
- The “active decay” stage starts when seepage and maggots cause rips in the body skin, which make oxygen come back and maggot and aerobic activity increases again. At this stage, the mass loss is huge.
- The “advanced decay” stage occurs with the transformation of maggots into pupae. At this stage, the increase of carbon, nutrient and pH of the soil is not linked with a positive effect on soil biology. Indeed, the vegetation and most organisms like collembolan and acari die for many reasons like nitrogen toxicity and suffocation.
- The “dry” and “remains” stages are the last stages of the decomposition process. The “dry” stage is characterized by an increase of vegetation around the CDI. The “remains” stage is characterized by an increase of vegetation inside the CDI. The nutrients and moisture are depleted quickly, because easily accessible, but the concentrations of nutrients in soil doesn’t decrease. Collembolan and acari populations decrease and fungi form fruiting structures due to the high nitrogen level.
-
 A pig carcass in the fresh stage of decomposition
 -
 A pig carcass in the bloat stage of decomposition
 -
 A pig carcass in the active decay stage of decomposition
 -
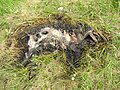 A pig carcass in the advanced decay stage of decomposition
 -
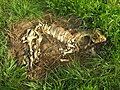 A pig carcass in the dry/remains stage of decomposition


Purposes, hypothesis and realization of the experiment
[edit | edit source]Purposes
[edit | edit source]Further to ancient studies on the impact of a cadaver on testate amoebae soil communities,[5] our study has to verify if the observed variations are really due to the cadaver in its entirety or to its body fluids only. Thus the study will compare the effect of pig cadaver, pig blood and cow manure. Blood and manure can be important in the determination of the PMI because if the body is missing, they are the only elements that remain at the crime scene. Furthermore, their impact on testate amoebae communities is still unknown. The final aims of this study are to confirm that using testate amoebae in forensic sciences is founded and to broaden the scarce knowledge in this new scientific field.
Realization of the experiment
[edit | edit source]To achieve our purposes, three treatments will be set up and applicated to soil and litter: pigs heads, pig blood, and cow manure. A control composed only of soil and litter will be set up too. The follow-up of treatments lasts four weeks, and sampling days take place once per week (so in total four times).
The pigs heads treatment has been imagined in order to imitate the cadaver impacts son soil, although the blood and manure allow to test body fluids impacts.
To analyze the treatments impacts on soil communities, three parameters will be measured: respirometry, pH and the species diversity and relative abundance of living and dead testate amoebae (living/dead ratio).
- The species diversity and the relative abundance of living and dead testate amoebae are naturally analyzed because these organisms respond very well to disturbances, implying that a change in the community can be used as a tool for the PMI determination.
- The respirometry allows to measure the metabolic activity of the soil organisms. An increase in the CO2 flow measured by the respirometer means an increase in the soil metabolic activity, but not necessary an increase in testate amoebae community. These data could help to determine a potential correlation between an increase of the soil metabolic activity (bacteria, fungi...) and an increase in amoebae abundance. Indeed, testate amoebae eat bacteria and fungi and an increase in the prey abundance should usually increases the predator abundance, but testate amoebae being very sensitive to a change of prey or abiotic environment, this will not necessarily be observed.
- The pH is measured because testate amoebae are very sensitive to this so a change in the pH should be correlated to a change in the amoebae community. This would confirm previous studies.
Hypothesis
[edit | edit source]Testate amoebae being very versatils creatures, their short reproductive cycle should allow to observe evolutions of populations through the four treatments and time. They are sensitive to dryness and pH. Thus, different panels of amoebae species and different living/dead ratio are expected to be found in each treatment pot through time.
The three treatments should influence differently moisture and pH, which are both determining factors of testate amoebae communities structure.[2] Indeed, an increase in the moisture rate should increase the amoebae species diversity, because they live in the soil water and depend on it. Contrariwise, a variation of the pH should decrease the amoebae species diversity because they are strongly "pH-dependant". The pH and the moisture rate should have direct and an indirect influences. The direct influences may be caused by a change in the abiotic conditions and the indirect influences may be caused by changes in species diversity of prey community.[2] The presence of the pig head and the cow manure on the litter should cause a higher soil humidity rate than in control and blood treatments, which should lead to an increase in living testate amoebae species diversity. The presence of the pig head and blood should increase the pH to more basic conditions, which should lead to a decrease in living testate amoebae species diversity. The manure should decrease the pH to more acidic conditions, which should also lead to a decrease in living testate amoebae species diversity.
The nutrient content of the soil also has a huge impact on soil communities. An increase in nutrients such as carbon, nitrogen, or phosphorous could drastically change the soil communities composition, by, for example totally modify the bacterial flora composition. Indeed, the nutrients can have an impact because of their role of nutritive element but also because they can change the pH (ammonium ions for example) or be toxic (too much nitrate for example).
According to these predictions, the control treatment samples should be the driest and have the smallest pH variations. Thus the testate ameobae community shouldn't change through time, except because of dry or wet weather conditions.
The cow manure treatment samples should be a little more wet because the dung forms a waterproof layer and keeps the humidity in the litter. Through this we expect to see an acidification of the soil and the acidophilic amoebae species, such as Arcella sp., Assulina muscorum, Corythion dubium, Difflugia lucida, Euglypha sp., Nebela collaris and Nebela tincta, should become more abundant.[2][4] The manure decomposition process is quiet long so its influence on the nutrient content of the soil should not be seen the first two weeks.[4] Then the nutrient introduction in the soil by the decomposers should change the prey communities and decrease the species diversity of living testate amoebae.
The blood treatment samples should be as dry as the control ones but the blood should affect the pH and the nutrient content of the soil, so some communities evolution should be visible. The changes in prey communities should negatively affect the species diversity of the living testate amoebae community, which are quite specific predators.
The pig head treatment samples should be affected by pH variations. The first two weeks, the pH should increase and reach a slightly basic level. Then it should go back to a neutral level. This should affect the amoebae communities and allow basidophilic species to spread, such as Centropyxis aerophila, Nebela bohemica and Nebela lageniformis.[18] The moisture level should be higher than in the other samples because of the influence of cadaveric fluids and the head shadow. It should be positive for the reproduction rate.[4] The nutrient content of the soil should increase and have a negativ impact on the living testate amoebae community, like for the blood treatment.
References
[edit | edit source]- ↑ a b G. T. Swindles (2008). "A preliminary investigation into the use of testate amoebae for the discrimination of forensic soil samples". Science and Justice.
- ↑ a b c d e f g h i j k l m n I. Szelecz (2010). "Soil organisms beneath a cadaver - a tool for estimating the time of death". MSc Thesis.
- ↑ a b D. Chardez (1967). "Histoire naturelle des Protozoaires Thecamoebiens". Les Naturalistes Belges.
- ↑ a b c d e f C. G. Ogden & R. H. Hedley (1980). An atlas of freshwater testate amoebae. British Museum (Natural History). ISBN 0 19 858502 0.
- ↑ a b c d e I. Szelecz; et al. (2014). "Can soil testate amoebae be used for estiamting the time since death? A field experiment in a deciduous forest". Forensic Science International.
{{cite journal}}: Explicit use of et al. in:|last=(help) - ↑ a b c d e f C. V. W. Seppey; et al. (2015). "Response of forest soil euglyphid testate amoebae (Rhizaria: Cercozoa) to pig cadavers assessed by high-throughput sequencing". IntJ Legal Med.
{{cite journal}}: Explicit use of et al. in:|last=(help) - ↑ a b c d e L. A. Benninger; et al. (2008). "The biochemical alteration of soil beneath a decomposing carcass". Forensic Science International.
{{cite journal}}: Explicit use of et al. in:|last=(help) - ↑ a b c d e f g h P. S. Barton; et al. (2012). "The role of carrion in maintaining biodiversity and ecological processes in terrestrial ecosystems". Oecologia.
{{cite journal}}: Explicit use of et al. in:|last=(help) - ↑ E. A. D. Mitchell; et al. (2008). "Testate amoebae analysis in ecological and paleoecological studies of wetlands: past, present and future". Biodiversity and Conservation.
{{cite journal}}: Explicit use of et al. in:|last=(help) - ↑ E. A. D. Mitchell (2003). "Structure of microbial communities in Sphagnum peatlands and effect of atmospheric carbon dioxide enrichment". Microbial ecology.
- ↑ E. A. D. Mitchell; et al. (2004). "Response of testate amoebae (protozoa) to N and P fertilization in an arctic wet sedge tundra". Arctic, Antarctic, and Alpine Research.
{{cite journal}}: Explicit use of et al. in:|last=(help) - ↑ D. Gilbert; et al. (2000). "Le régime alimentaire des Thécamoebiens (Protista, Sarcodina)". L'Année biologique.
{{cite journal}}: Explicit use of et al. in:|last=(help) - ↑ Sahney, S. and Benton, M.J. (2008). "Recovery from the most profound mass extinction of all time" (PDF). Proceedings of the Royal Society: Biological. 275 (1636): 759–65. doi:10.1098/rspb.2007.1370. PMC 2596898. PMID 18198148.
{{cite journal}}: CS1 maint: multiple names: authors list (link) - ↑ "The Virtual Nature Trail at Penn State New Kensington". The Pennsylvania State University. Retrieved Oct 10, 2013.
- ↑ Payne, J.A. (1965). "A summer carrion study of the baby pig sus scrofa Linnaeus". Ecology. 46 (5): 592–602. doi:10.2307/1934999.
- ↑ Forbes, S.L. (2008). "Decomposition Chemistry in a Burial Environment". In M. Tibbett, D.O. Carter (ed.). Soil Analysis in Forensic Taphonomy. CRC Press. pp. 203–223. ISBN 1-4200-6991-8.
- ↑ D. O. Carter; et al. (2006). "Cadaver decomposition in terrestrial ecosystem". Naturwissenschaften.
{{cite journal}}: Explicit use of et al. in:|last=(help) - ↑ Lamentowicz et al. (2005), "The ecology of testate amoebae (protists) in Sphagnum in north-western Poland in relation to peatland ecology", Microbial Ecology.
materials and methods
Experimental design
[edit | edit source]The experimental design was composed of one control (soil only) and three different treatments:
- Pig head
- Cow manure
- Pig blood
The treatments and control were realised in three replicates. The treatments were carried out on the surface of flowerpots filled with soil and litter coming from a mixed oak grove situated in the city of Neuchâtel (Switzerland 47°00'00.63 N; 06°56'00.44E, elevation 586m).
Pig Head treatment
[edit | edit source]The first treatment was a dead pig head (Sus scrofa domesticus) laid at the surface of the soil of each pot. The pig has been chosen because of its anatomical, genetical and physiological similarities with human body.[1][2] Indeed, a study showed that even if the pork is not a perfect model, its decomposition is relatively comparable to a human in many ways.[3] The head part has been chosen because of its fast decomposition process, due to its small size and facial orifices that are easily reachable for insects.[3]
The heads were stored in a metal mesh cage in order to help sampling underneath the carrion by an easy displacement of the head without disturbing the soil and litter. The mesh of the grid was large enough to allow the invertebrate activity working on the decomposition process.

Manure and blood treatments
[edit | edit source]The second and third treatments were cow manure laid at the surface of the soil of each pot and pig blood spilled on the pots. The aim of these treatments was to evaluate the influence of blood and manure on amoebae communities (which is still unknown) and compare it with the results of pig heads. Indeed, this study attempts to determine if effects of a cadaver on testate amoebae communities are due to the corpse in its entirety or to its body fluids only, and if the body fluids have a more or less pronounced effects than the cadaver.

Study site
[edit | edit source]All the flowerpots were stored in a greenhouse of the botanical garden of Neuchâtel, undergoing the local weather conditions except rain. The city of Neuchâtel is exposed to a degraded oceanic climate. It’s a climate with seasons, cold winters and hot summers. The experiment lasted one month and took place in May 2015. This month was alternately rainy and sunny and the daily temperatures were situated between 10 and 28 °C. After specially hot sampling days, the flowerpots were watered in order to keep some moisture content. This was done twice.
Sampling analysis
[edit | edit source]Samples of soil and litter were sampled once a week during one month (T0 = day 0, T1 = day 11, T2 = day 18, T3 = day 25) and then analysed in order to identify and count the living and dead testate amoebae species that they contained. The respiration rate of the soil organisms and the pH of the soil were also measured once a week. The samples were collected right beneath the pig head and manure and at the surface of the pot, from a depth of 0–5 cm. A small amount of soil was collected in each pot in order to limit the disturbance of the pot.

The samples were then placed into plastic bags.

Respirometry
[edit | edit source]The CO2 flow (µmol m−2 s−1) released by the soil organisms was measured by the Respirometer Li-cor® Biosciences LI-8100A. Before each measurement, the pigs heads and the manure were displaced.

pH measurement
[edit | edit source]The pH of each samples was measured with the pH meter Extech® instrument Waterproof ExStik®II pH/Conductivity Meter. The measurement was made as follow:
- After a calibration of the pH meter at 4, 7 and 10 pH, samples and deionized water were mixed in a 1:1 ratio in a sampling cup.

The sample is mixed with tap water. - The suspension settled for 3 minutes prior to measurement.
- The pH meter was put at the surface of the mixture and let there until a stabilization of the pH displayed on the screen.


Testate amoebae extraction and identification
[edit | edit source]Each sample was treated following the same protocol:
- 2g of soil were put in a plastic flask with tap water and shaken for approximately 3 minutes.

2g of soil are put in a plastic flask. - The mixture was sieved trough a 200 μm mesh size in order to remove bigger particles.

A sieve - The filtrate was sieved again trough a 20 μm mesh. The new filtrate was discarded and the 20–200 μm fraction sitting in the filter was rinsed in a falcon tube.

The sieving. - Tap water was added up to 50ml.
- The falcon tube was centrifugated at 15 °C and 2500rpm (rounds per minute) for 10 minutes.

The centrifugation. - The supernatant was discarded and approximately 5ml were left in the tube.
- 50 μl of Rose Bengale was added and the mixture was let sit for 30 minutes.

The Rose Bengal is added to the samples. - Water was added up to 45ml and the tube was centrifugated a second time at 15 °C and 2500rpm for 10 minutes.
- The supernatant was discarded and approximately 5ml were left in the tube.

The extraction of the testate amoebae is done. - To finish 1-2 drops of the extraction were put on a slide with 1 drop of glycerol.


The 20 first amoebae found in each replicate were observed, counted and identified with optical microscopes at 200× or 400× magnification. Identification of testate amoebae was achieved using test morphology, composition, size and colour.[4]
The samples were stored in a cold room between the microscopic identifications.
Statistical analysis
[edit | edit source]Statistical analysis and graphics were made with R.
ANOVAs and Tukey tests were used to test if the influence of treatments and time (and their interaction) on pH, released CO2 flow, living dead/ratio of testate amoebae and Shannon index (species diversity index) of each sample are significant. The Shannon index allows to appreciate the diversity as a number. The Shannon index of each sample was calculated with the R package Vegan.
Pearson correlation tests were used to check if there is a significant correlation between pH and the living/dead ratio of testate amoebae, and between pH and the Shannon index of the samples.
The normality and the homogeneity of variances were tested with Shapiro's and Bartlett's tests because the ANOVA, the Tukey test and the Pearson's correlation test require this two conditions to be fulfilled, but they were not fulfilled in most cases. Nevertheless, ANOVAs, Tukey tests and a Pearson's correlation tests were done because non-parametric tests were too complicated for our competence level in statistical analysis.
References
[edit | edit source]- ↑ M. A. M Groenen; et al. (2012). "Analyses of pig genomes provide insight into porcine demography and evolution". Nature.
{{cite journal}}: Explicit use of et al. in:|last=(help) - ↑ E. R. Miller; et al. (1987). "The Pig as a Model for Human Nutrition, annual review of nutrition". Annual reviews.
{{cite journal}}: Explicit use of et al. in:|last=(help) - ↑ a b K. L. Stokes; et al. (2013). "Human Versus Animal: Contrasting Decomposition Dynamics of Mammalian Analogues in Experimental Taphonomy". Forensic sciences.
{{cite journal}}: Explicit use of et al. in:|last=(help) Invalid<ref>tag; name ":0" defined multiple times with different content - ↑ G. T. Swindles (2008). "A preliminary investigation into the use of testate amoebae for the discrimination of forensic soil samples". Science and Justice.
Results and discussion
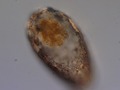
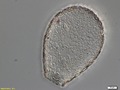
Testate amoebea observed
[edit | edit source]-
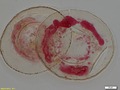 Arcella
 -
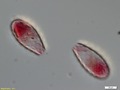
 Assulina
 -
 Centropyxis
 -
 Euglypha


-
 Heleopera
 -
 Nebela
 -
 Plagiopyxis
 -
 Trinema


Respiration: Released CO2 flow
[edit | edit source]
This graph shows the evolution of the CO2 flow released by soil organisms (usually through respiration process) for the three treatments (blood, manure, pig). The control is used as standard in order to minimise the external variables influences. Moreover, our interest was differences between treatments and control samples, thus absolute values are not interesting in those results.
Following our hypothesis, the control should be stable. The pig and the blood should have the highest released CO2 flow because they bring a lot of nutrients in soil, which is known to increase bacterial activity.[1] The manure curve should be situated under the blood and pig because its decomposition process is long, so less nutrients are brought to the soil at the beginning of the experiment,[2] which is less favorable for the bacterial activity.
Our results match with the hypothesis. Indeed, we can see very different results between treatments. On one side the manure is very similar to the control. It could be explained by the dryness of the samples, which were stored in a greenhouse by hot and dry weather conditions. The dryness of the manure didn't allow the nutrients flow to be established through the decomposition process because dryness is not good for decomposers activity. On the other side, the blood and pig treatment show highest respiration rates at each sample times (except T0, which is normal) and the pig sample has the highest one. It could be explained by the presence of a lot of necrophageous maggots remaining on the litter during the measurement. An additional explanation could be the release of cadaver fluids, which contain a lot of bacteria and nutrients, which increases the bacterial activity in soil.[1] The blood sample follows a similar curve as the pig one, but is characterized by lower values. This could be explained by the fact that blood only releases nutrient to the soil, which increases the soil bacterial activity but does not import new bacteria and maggots as the pig treatment does.
No measurement was made at T3, because the respirometer was broken.
An ANOVA and a Tukey test were made in order to test if the treatments and time impacts, and the interaction between this two variables, on the released CO2 flow were significant. The results shows that :
- Time has a significant influence on the released CO2 flow : p-value = 1.692*10-5.
- Treatments have a significant influence on the released CO2 flow: p-value = 1.863*10-6.
- There is a significant interaction between treatment and time on the released CO2 flow : p-value= 0.0001.
(Cf. datas and statistical analysis in Appendices)
pH
[edit | edit source]
This graph shows the standardized values of pH according to the control for each treatment. The standardization is done for two reasons. In first place, we have a drop in values for each treatment at T3, that may be due to improper calibration of pH meter or dryness. The standardization removes the uncontrolled variables impact. Secondly, the important values are the relative values between control and treatments, and not the absolute ones.
At T0, all treatments have a pH close to the control one, which is logic because the treatments were not applied yet. After application of the blood treatment, the pH rises sharply. Then, it stabilizes at 1.5, the highest standardized value of each sample. The increase of blood treatment pH may be explained, among other, by the release of ammonium ions.[1] Results for pig treatment are irregular. At T1, the difference with the control is relatively high. Then, after 18 days, it decreases and stabilizes at the same pH than the control. The presence of a cadaver basify the medium for the same reason as the blood does. However, changes are less significant and long lasting, because the pig cadaver is less concentrated in nutrients than the blood. As for blood treatment, adding manure durably increases the difference of pH with the control, but less strongly than the blood treatment. The highest difference with the control treatment pH is 0.5. This results are quite surprising. This treatment should have acidified the soil pH.[3] This results may be explained by the weather conditions because samples were stored in a greenhouse and there has not been an adequate intake of water to allow the decomposition of the manure and exchanges of nutrients with the soil.
An ANOVA and a Tukey test were made in order to test if the treatments and time impacts, and the interaction between this two variables, on the pH ratio were significant. In general, the p-values are significant (<0.05) for the influence of treatment, time and the interaction of this two variables.
- Time has a significant influence on the pH : p-value = 4.657e-14.
- Treatments have a significant influence on the pH : p-value = 1.743e-10.
- There is a significant interaction between treatment and time on the pH : p-value= 1.155e-05.
(Cf. datas and statistical analysis in Appendices)
Living/dead amoebae ratio
[edit | edit source]
Hypothetically, treatments and time should have an impact on the living/dead ratio of testate amoebae.[4] Indeed, treatments change the moisture rate, the nutrient content and the pH of soil and this should evolve through time.[1] Following our hypothesis, the living/dead ratio should be quiet similar for each treatment at T0 and should decrease afterwards for the pig, blood and manure treatments, but should stay stable for control. Decreases should be caused by changes in moisture rate, nutrient content, pH and specific preys availability.
On the graph, we can see that, at T0 and T1, there is no difference for the living/dead ratio of each treatment and there are almost no living amoebae (ratio closed to 0). This can be easily explained. Indeed, the Rose Bengal coloration (to stain living cells) didn’t work well for the T0 and T1 samples and it was our first encounter with testate amoebae. Thus, this is logical that no difference is seen between the two first treatments and that sudden variations happens at T2 and T3. Indeed, at T2 and T3 the coloration worked, therefore it is logical that more living amoebae have been observed. Seeing the graph, we could believe that between T2 and T3, there is a decrease of the living/dead ratio for the pig, manure and control treatments and an increase for the blood treatment. The decrease could be explain by a negative impact of treatments or weather conditions (The weather was very hot and dry between T2 and T3 and the amoebae depend a lot from the moisture rate), and the increase (blood) could be explained by a positive impact of the treatment. However, seeing the large error bars for each treatment at T2 and T3, we can not affirm that this results are reliable. Indeed, large variations between treatments and between replicates can be explained by the low number of amoebae identified (20 per replicate only), thus only one more living amoebae identified can greatly change the ratio.
An ANOVA and a Tukey test were made in order to test if the treatments and time impacts, and the interaction between this two variables, on the living/dead ratio were significant. Obviously, the time has a significant impact (p-value = 0.002) but this is only because the coloration didn’t work at T0 and T1, so the living/dead ratio suddenly increases at T2, when the living amoebae were finally able to be identified. Indeed, between T0/T1 and T2/T3, p-values are generally significant (>0.05), but no more between T0 and T1 and T2 and T3. P-values for the impact of treatment and the interaction between treatment and time are not significant.
(Cf. datas and statistical analysis in Appendices)
Evolution of communities through time for each treatment
[edit | edit source]
Previous studies showed that time and treatments influence the amoebae communities structure.[4] Indeed, these communities are very sensitive to environmental changes, which are consistently modified by treatments. The species should success each other, according to abiotic and biotic conditions of their environment (Ecological Succession theory). That hasn't been confirmed by our results.
On the graphs, we can see the abundance variation of the three more abundant testate amoebae genders through time, for each treatment.
These genders are:
Other genders are included in the category "other", because of their trivial presence. The results seem quite chaotic and can not be interpreted.
An ANOVA and a Tuckey test were made in order to test if the treatments and time impacts, and the interaction between this two variables on samples species diversity, were significant. The species diversity of each sample is represented by a Shannon index. In general, the impact of time and treatments on testate amoebae species diversity are not significant (for pig, blood, manure and control treatments: p-value > 0.05).
These unexpected results may be explained by many hypothesis :
- The experiment duration : A longer experiment could show a significant difference on communities.
- No reliable methods of identification : It was our first contact with testate amoebae, so our lack of experience makes results not reliable. We also tended to always identify the same well-known species.
- The weak number of individuals : We only identified twenty amoebae in each sample. It’s probably not enough to get reliable results. So for future studies, we advise to count more individuals to have significant results.
- Moisture rate : Our treatment pots were under a greenhouse, so they quickly dried up and we did not immediately water them. The testate amoebae don’t like the drought, so our results are probably biased.
(Cf. datas and statistical analysis in Appendices)
Correlation between living/dead amoebae ratio and pH and correlation between Shannon index and pH
[edit | edit source]The presence of the pig head and blood increased the pH to more basic conditions, which should lead to a decrease in living testate amoebae abundance and specific richness.
A Pearson's correlation test have been made in order to test if the living/dead ratio and the Shannon index are correlated with the pH variations but the correlation coefficients are respectively -0.206 and -0.064. Thus there is no significant correlation between the living dead/ratio or the Shannon index and the pH of the samples (p-value are respectively 0.159 and 0.662).
(Cf. datas and statistical analysis in Appendices)
References
[edit | edit source]- ↑ a b c d L. A. Benninger; et al. (2008). "The biochemical alteration of soil beneath a decomposing carcass". Forensic Science International.
{{cite journal}}: Explicit use of et al. in:|last=(help) - ↑ D. O. Carter; et al. (2006). "Cadaver decomposition in terrestrial ecosystem". Naturwissenschaften.
{{cite journal}}: Explicit use of et al. in:|last=(help) - ↑ A. Siegenthaler et al. (1999). "Auswirkung hoher Gaben von Klärschlamm und Schweinegülle". Umwelt
- ↑ a b I. Szelecz (2010). "Soil organisms beneath a cadaver - a tool for estimating the time of death". MSc Thesis.
Conclusion
Main results
[edit | edit source]In this study, effects of stress and perturbations on testate amoebae soil communities due to a cadaver and its body fluids were observed during four weeks. We were interested to discover if the effect of the cadaver is due to its body fluids only, whose effects are still unknown, or to its entirety. We used three different treatements, pig blood, cow manure and dead pigs heads. Control pots were set up as well.
The first purpose of the study was to establish a link between the ratio of survival testate amoebae and dead ones according to the different treatments throughout the time. The second purpose of the study was to look for a chronological pattern in the species succession through time, via changes in communities structure, in function of the treatments. For this purpose, the Shannon index of the samples was analysed in fonction of time and treatments. The pH and the released CO2 flow changes induced by the treatments were also measured. All this was done because previous studies have shown an influence of corpse on testate amoebae survival rate and species succession through time.[1] Therefore, these organisms could be used by forensic experts as a tool to establish long PMIs.
Our study did not work as well as expected. No concluant result has been obtained for the evolution of the living/dead ratio and the variation of the community structure through time. However, pH and respirometry have nonetheless given the expected results, with increases in the pH and the respiration rate for the blood and pig treatments.
However, our negativ results are useful to show some facts. We have seen that it is really difficult and time-consuming to work with and recognise testate amoeba with an optical microscope. Our results show us that, in a so small timespan, the communities changes are not enough relevant to see a variation. Furthermore, it was for us a good way to apply our knowledge and see the gap separating theory and practice.
Problems occurred
[edit | edit source]The bad results are due to many reasons. One of the main problem was the staining of living cells, which didn't work as expected at T0 and T1 for an unknown reason, and totally biased the living/dead ratio. The identification of testate amoebae gender was difficult to do with accuracy. This was due to our lack of experience in amoebae determination. This complicated a lot the communities analysis. Furthermore, it is fundamental to observe a larger number of amoebae per sample to obtain conclusive results. Moreover, it is possible that environmental changes induce encystment instead of death, which was not possible to observe. To finish, it is a bad idea to store the treatment pots in a greenhouse because the temperature is too high and it dries the soil and the treatments, especially pigs heads and manure. Thus, it alters the decomposition process and the amoebae development, which both need moisture.
Further studies
[edit | edit source]One way to improve this study could be the use of molecular tools to establish gender and species with higher precision.[2] It could be also interesting to test in which way the bacterial communities changes, induced by the presence of corpse, has an influence on predator communities as testate amoebae. Furthermore, long-time studies should be made to establish when the amoebae presence decreases and when it recolonises the soil. The longer timespan can also reduce the influence of the daily weather, but it could show a greater seasonal influence. To finish, it could be useful to start a study in order to check if the community structure and living/dead ratio changes observed in previous studies are due to variation of pH, moisture rate, nutrient content of soil or variation in preys availability.
References
[edit | edit source]
Appendices
Testate amoebae identification data
[edit | edit source]| X | Arcella_a | Argynnia_a | Assulina_a | Centropyxis_a | Cyclopyxis_a | Cyphoderia_a | Diflugia_a | Euglypha_a | Heleopera_a | Hyalosphenia_a | Microchlamys_a | Paraquadrula_a | Phryganella_a | Plagiopyxis_a | Nebela_a | Tracheleuglypha_a | Trinema_a | Schwabia_a | Lesqueresia_a | Arcella_d | Argynnia_d | Assulina_d | Centropyxis_d | Cyclopyxis_d | Cyphoderia_d | Diflugia_d | Euglypha_d | Heleopera_d | Hyalosphenia_d | Microchlamys_d | Paraquadrula_d | Phryganella_d | Plagiopyxis_d | Nebela_d | Tracheleuglypha_d | Trinema_d | Schwabia_d | Lesqueresia_d | |
| 1 | 1_P_0 | NA | NA | NA | NA | NA | NA | NA | NA | NA | NA | NA | NA | NA | NA | NA | NA | NA | NA | NA | 3 | NA | NA | 5 | 4 | NA | NA | NA | NA | NA | NA | NA | 6 | NA | 2 | NA | NA | NA | NA |
| 2 | 2_P_0 | NA | NA | NA | NA | NA | NA | NA | NA | NA | NA | NA | NA | NA | NA | NA | NA | NA | NA | NA | NA | NA | NA | 2 | 5 | NA | 2 | 2 | 2 | NA | NA | NA | 2 | NA | NA | 2 | 3 | NA | NA |
| 3 | 3_P_0 | NA | NA | NA | NA | NA | NA | NA | NA | NA | NA | NA | NA | NA | NA | NA | NA | NA | NA | NA | 2 | 1 | NA | NA | 3 | 1 | NA | 4 | NA | NA | NA | 2 | 2 | NA | 1 | 4 | NA | NA | NA |
| 4 | 1_B_0 | NA | NA | NA | NA | NA | NA | NA | NA | NA | NA | NA | NA | NA | NA | NA | NA | NA | NA | NA | 4 | NA | 1 | NA | 2 | NA | NA | 6 | 4 | NA | NA | NA | NA | NA | 1 | 2 | NA | NA | NA |
| 5 | 2_B_0 | NA | NA | NA | NA | NA | NA | NA | NA | NA | NA | NA | NA | NA | NA | 1 | NA | NA | NA | NA | 6 | 1 | NA | 3 | 2 | NA | NA | 2 | 1 | NA | NA | 3 | NA | NA | 1 | NA | NA | NA | NA |
| 6 | 3_B_0 | NA | NA | NA | NA | NA | NA | NA | NA | NA | NA | NA | NA | NA | NA | NA | NA | NA | NA | NA | 7 | NA | NA | 5 | 5 | NA | NA | NA | NA | 2 | NA | NA | 1 | NA | NA | NA | NA | NA | NA |
| 7 | 1_M_0 | NA | NA | NA | NA | NA | NA | NA | NA | NA | NA | NA | NA | NA | NA | NA | NA | NA | NA | NA | 6 | NA | NA | 1 | NA | NA | NA | 5 | NA | NA | NA | 1 | 2 | NA | 1 | 4 | NA | NA | NA |
| 8 | 2_M_0 | NA | NA | NA | NA | NA | NA | NA | NA | NA | NA | NA | NA | NA | NA | NA | NA | NA | NA | NA | 2 | NA | 1 | 6 | 4 | NA | NA | 1 | 3 | NA | NA | NA | NA | NA | 1 | 2 | NA | NA | NA |
| 9 | 3_M_0 | NA | NA | NA | NA | NA | NA | NA | NA | NA | NA | NA | NA | NA | NA | NA | 1 | NA | NA | NA | 6 | 1 | NA | 3 | 2 | NA | NA | 3 | 1 | NA | NA | NA | NA | 1 | 1 | 1 | NA | NA | NA |
| 10 | 1_C_0 | NA | NA | NA | NA | NA | NA | NA | NA | NA | NA | NA | NA | NA | NA | NA | NA | NA | NA | NA | 7 | NA | NA | 4 | 1 | NA | NA | 2 | 6 | NA | NA | NA | NA | NA | NA | NA | NA | NA | NA |
| 11 | 2_C_0 | NA | NA | NA | NA | NA | NA | NA | 1 | NA | NA | NA | NA | NA | NA | NA | NA | NA | NA | NA | 4 | NA | NA | 2 | 11 | NA | NA | 1 | NA | NA | NA | NA | NA | NA | 1 | NA | NA | NA | NA |
| 12 | 3_C_0 | NA | NA | NA | NA | NA | NA | NA | NA | NA | NA | NA | NA | NA | NA | NA | NA | NA | NA | NA | 5 | NA | 4 | 5 | 4 | NA | NA | NA | NA | NA | NA | NA | NA | NA | 1 | NA | 1 | NA | NA |
| 13 | 1_P_11 | NA | NA | NA | NA | 2 | NA | NA | NA | NA | NA | NA | NA | NA | NA | NA | NA | NA | NA | NA | 1 | NA | NA | 9 | 3 | NA | NA | 1 | 1 | NA | NA | NA | 2 | 1 | NA | NA | NA | NA | NA |
| 14 | 2_P_11 | NA | NA | NA | NA | NA | NA | NA | NA | NA | NA | NA | NA | NA | NA | NA | NA | NA | NA | NA | 2 | NA | NA | 7 | 9 | NA | NA | 1 | NA | NA | NA | 1 | NA | NA | NA | NA | NA | NA | NA |
| 15 | 3_P_11 | NA | NA | NA | NA | NA | NA | NA | NA | NA | NA | NA | NA | NA | NA | NA | NA | NA | NA | NA | 3 | NA | NA | 5 | 3 | NA | NA | 2 | NA | NA | NA | 1 | NA | NA | 4 | 2 | NA | NA | NA |
| 16 | 1_B_11 | NA | NA | NA | NA | NA | NA | NA | NA | NA | NA | NA | NA | NA | NA | NA | NA | NA | NA | NA | 1 | NA | 2 | 2 | 11 | NA | NA | 1 | 1 | NA | NA | NA | NA | NA | 1 | NA | 1 | NA | NA |
| 17 | 2_B_11 | NA | NA | NA | NA | NA | NA | NA | 3 | NA | NA | NA | NA | NA | NA | NA | NA | NA | NA | NA | 2 | NA | NA | 7 | 5 | NA | NA | NA | NA | NA | NA | 2 | NA | NA | 1 | NA | NA | NA | NA |
| 18 | 3_B_11 | NA | NA | NA | NA | NA | NA | NA | NA | NA | NA | NA | NA | NA | NA | NA | NA | NA | NA | NA | 7 | NA | NA | 3 | 6 | NA | NA | NA | 3 | NA | NA | NA | NA | NA | 1 | NA | NA | NA | NA |
| 19 | 1_M_11 | NA | NA | NA | NA | NA | NA | NA | NA | NA | NA | NA | NA | NA | NA | NA | NA | NA | NA | NA | 7 | NA | NA | 3 | 2 | NA | NA | 1 | 3 | NA | 1 | NA | NA | 3 | NA | NA | NA | NA | NA |
| 20 | 2_M_11 | NA | NA | NA | NA | NA | NA | NA | NA | NA | NA | NA | NA | NA | NA | NA | NA | NA | NA | NA | 4 | NA | NA | 2 | 11 | NA | NA | NA | NA | NA | NA | NA | NA | 1 | 2 | NA | NA | NA | NA |
| 21 | 3_M_11 | NA | NA | NA | NA | NA | NA | NA | NA | NA | NA | NA | NA | NA | NA | NA | NA | NA | 1 | NA | 4 | NA | NA | 4 | 2 | NA | NA | 2 | 1 | NA | NA | NA | 3 | NA | 2 | 1 | NA | NA | NA |
| 22 | 1_C_11 | NA | NA | NA | NA | NA | NA | NA | NA | NA | NA | NA | NA | NA | NA | NA | NA | NA | NA | NA | NA | NA | NA | 6 | 6 | NA | NA | 1 | 1 | NA | NA | NA | 1 | 3 | 2 | NA | NA | NA | NA |
| 23 | 2_C_11 | NA | NA | NA | NA | NA | NA | NA | 2 | NA | NA | NA | NA | NA | NA | NA | NA | NA | NA | NA | 5 | NA | NA | 7 | 2 | NA | NA | 3 | NA | NA | NA | NA | NA | NA | 1 | NA | NA | NA | NA |
| 24 | 3_C_11 | NA | NA | NA | NA | NA | NA | NA | NA | NA | NA | NA | NA | NA | NA | NA | NA | NA | NA | NA | 5 | NA | NA | 4 | 4 | NA | NA | NA | 7 | NA | NA | NA | NA | NA | NA | NA | NA | NA | NA |
| 25 | 1_P_18 | 2 | NA | NA | NA | 1 | NA | NA | 1 | NA | NA | NA | NA | NA | NA | 1 | NA | NA | NA | NA | 4 | NA | NA | 5 | 4 | NA | NA | NA | NA | NA | NA | NA | 1 | NA | NA | NA | NA | NA | 1 |
| 26 | 2_P_18 | 1 | NA | 1 | 3 | NA | NA | NA | 5 | 6 | NA | NA | NA | NA | NA | 2 | NA | NA | NA | NA | 4 | NA | NA | 2 | NA | NA | NA | NA | 1 | NA | NA | NA | NA | NA | NA | NA | NA | NA | NA |
| 27 | 3_P_18 | 3 | NA | NA | NA | 1 | NA | NA | NA | 1 | NA | NA | NA | NA | NA | NA | NA | NA | NA | NA | 2 | 1 | NA | 3 | 7 | NA | NA | NA | 2 | NA | NA | NA | NA | NA | NA | NA | NA | NA | NA |
| 28 | 1_B_18 | NA | NA | NA | 1 | 1 | NA | NA | 4 | NA | NA | NA | 3 | NA | NA | NA | NA | NA | NA | NA | 6 | NA | NA | 2 | 2 | NA | NA | 4 | NA | NA | NA | 2 | NA | NA | NA | NA | NA | NA | NA |
| 29 | 2_B_18 | NA | NA | NA | NA | NA | NA | NA | NA | NA | NA | NA | 1 | NA | NA | NA | NA | NA | NA | NA | 8 | NA | NA | 4 | NA | NA | NA | 1 | 1 | NA | NA | 3 | NA | NA | 2 | NA | NA | NA | NA |
| 30 | 3_B_18 | 1 | NA | NA | 1 | NA | NA | NA | 3 | NA | NA | NA | NA | NA | NA | 1 | NA | NA | NA | NA | 5 | NA | NA | 4 | 4 | NA | NA | 3 | NA | NA | NA | NA | NA | NA | 2 | NA | 1 | NA | NA |
| 31 | 1_M_18 | 1 | NA | NA | 1 | NA | NA | NA | 2 | NA | NA | NA | NA | NA | NA | NA | NA | NA | NA | NA | 9 | NA | NA | 5 | 1 | NA | NA | NA | 1 | NA | NA | NA | NA | NA | NA | NA | NA | NA | NA |
| 32 | 2_M_18 | 1 | NA | NA | NA | 1 | NA | NA | NA | 2 | NA | NA | NA | NA | 1 | NA | NA | NA | NA | NA | 1 | NA | NA | 3 | 7 | NA | NA | NA | 2 | NA | NA | NA | NA | 2 | NA | NA | NA | NA | NA |
| 33 | 3_M_18 | NA | NA | NA | NA | NA | NA | NA | 3 | NA | NA | NA | NA | NA | NA | 1 | NA | NA | NA | NA | 5 | NA | NA | 2 | 4 | NA | NA | 4 | NA | NA | NA | NA | NA | 1 | NA | NA | 2 | NA | NA |
| 34 | 1_C_18 | 1 | NA | NA | 1 | NA | NA | NA | 7 | NA | NA | NA | 1 | NA | NA | NA | NA | NA | NA | NA | 4 | NA | NA | 4 | NA | NA | NA | 1 | 1 | NA | NA | NA | NA | NA | NA | NA | NA | NA | NA |
| 35 | 2_C_18 | 1 | NA | NA | NA | NA | NA | NA | 1 | NA | NA | NA | NA | NA | NA | 1 | NA | NA | NA | NA | 6 | NA | NA | 3 | 2 | NA | NA | 2 | NA | NA | NA | NA | NA | NA | 2 | 1 | 1 | NA | NA |
| 36 | 3_C_18 | NA | NA | NA | 1 | 4 | NA | NA | 2 | NA | NA | NA | NA | NA | NA | 2 | NA | NA | NA | NA | 1 | NA | NA | 4 | 2 | NA | NA | 2 | 1 | NA | NA | NA | NA | NA | 1 | NA | NA | NA | NA |
| 37 | 1_P_25 | 1 | NA | NA | NA | NA | NA | NA | NA | NA | NA | NA | NA | NA | NA | NA | NA | NA | NA | NA | 6 | NA | NA | 6 | 4 | NA | NA | 1 | NA | NA | NA | NA | NA | NA | 2 | NA | NA | NA | NA |
| 38 | 2_P_25 | NA | NA | NA | NA | NA | NA | NA | 1 | NA | NA | NA | NA | NA | NA | 1 | NA | NA | NA | NA | 3 | NA | 2 | 3 | 1 | 2 | NA | 2 | 1 | NA | NA | NA | NA | NA | 3 | NA | 1 | NA | NA |
| 39 | 3_P_25 | 1 | NA | NA | 1 | NA | NA | NA | NA | NA | NA | NA | NA | NA | NA | NA | NA | NA | NA | NA | 8 | NA | NA | 7 | 2 | NA | NA | NA | NA | NA | NA | NA | NA | 1 | NA | NA | NA | NA | NA |
| 40 | 1_B_25 | NA | NA | NA | NA | NA | NA | NA | 3 | NA | NA | NA | NA | NA | NA | NA | NA | NA | NA | NA | 8 | NA | NA | 6 | 3 | NA | NA | NA | NA | NA | NA | NA | NA | NA | NA | NA | NA | NA | NA |
| 41 | 2_B_25 | 2 | NA | NA | NA | NA | NA | NA | NA | NA | NA | NA | NA | NA | NA | 2 | NA | NA | NA | NA | 9 | NA | NA | 3 | 2 | NA | NA | NA | NA | NA | NA | NA | NA | NA | 2 | NA | NA | NA | NA |
| 42 | 3_B_25 | NA | NA | NA | NA | NA | NA | NA | NA | NA | NA | NA | NA | NA | NA | NA | NA | 1 | NA | NA | 5 | NA | NA | 3 | 5 | NA | NA | NA | NA | NA | NA | 3 | NA | NA | 1 | NA | 2 | NA | NA |
| 43 | 1_M_25 | 1 | NA | NA | NA | NA | NA | NA | 1 | NA | NA | NA | NA | NA | NA | 3 | NA | NA | NA | NA | 3 | NA | NA | 3 | 3 | NA | NA | 3 | NA | NA | NA | NA | NA | NA | 2 | NA | 1 | NA | NA |
| 44 | 2_M_25 | 3 | NA | NA | 1 | NA | NA | NA | 2 | 2 | NA | NA | NA | NA | 1 | 1 | NA | NA | NA | NA | 4 | NA | NA | 1 | 3 | NA | NA | NA | NA | NA | NA | NA | NA | 2 | NA | NA | NA | NA | NA |
| 45 | 3_M_25 | NA | NA | NA | NA | NA | NA | NA | 2 | NA | NA | NA | NA | NA | NA | 1 | NA | NA | NA | NA | 6 | NA | NA | 4 | 4 | NA | NA | 1 | NA | NA | NA | NA | NA | 1 | NA | NA | 1 | NA | NA |
| 46 | 1_C_25 | NA | NA | NA | 3 | 2 | NA | NA | NA | NA | NA | NA | NA | NA | NA | 1 | NA | NA | NA | NA | 1 | NA | NA | 5 | 6 | NA | NA | NA | NA | NA | NA | NA | 1 | NA | NA | NA | NA | NA | 1 |
| 47 | 2_C_25 | NA | 1 | NA | 2 | 2 | NA | NA | 1 | 1 | NA | NA | NA | NA | 1 | 1 | NA | NA | NA | NA | 2 | NA | NA | 1 | 6 | NA | NA | NA | NA | NA | NA | NA | NA | 2 | NA | NA | NA | NA | NA |
| 48 | 3_C_25 | NA | NA | NA | 1 | NA | NA | NA | 1 | NA | NA | NA | NA | NA | NA | 2 | NA | NA | NA | NA | 2 | NA | NA | 6 | 5 | NA | NA | 1 | 1 | NA | NA | NA | NA | NA | NA | NA | NA | NA | 1 |
Legend:
- X axis: Gender name; its statue: a stands for alive, d stands for dead
- Y axis: Number of line; Number of replicate; Treatment: P stands for pig, B stands for blood, M stands for manure, C stands for control; Post mortem interval (PMI) with the sampling
Environmental data
[edit | edit source]| respi | ph | treatment | PMI | replicate | |||
| 1 | 2.65 | 7.50 | pig | 0 | 1 | ||
| 2 | 2.89 | 7.08 | pig | 0 | 2 | ||
| 3 | 2.79 | 7.62 | pig | 0 | 3 | ||
| 4 | 4.48 | 7.45 | blood | 0 | 1 | ||
| 5 | 3.37 | 7.35 | blood | 0 | 2 | ||
| 6 | 4.17 | 7.38 | blood | 0 | 3 | ||
| 7 | 3.64 | 7.14 | manure | 0 | 1 | ||
| 8 | 3.93 | 7.51 | manure | 0 | 2 | ||
| 9 | 4.60 | 7.45 | manure | 0 | 3 | ||
| 10 | 3.00 | 7.79 | control | 0 | 1 | ||
| 11 | 3.96 | 7.72 | control | 0 | 2 | ||
| 12 | 4.53 | 7.42 | control | 0 | 3 | ||
| 13 | 21.06 | 7.58 | pig | 11 | 1 | ||
| 14 | 57.81 | 8.38 | pig | 11 | 2 | ||
| 15 | 40.93 | 8.78 | pig | 11 | 3 | ||
| 16 | 21.56 | 9.06 | blood | 11 | 1 | ||
| 17 | 30.94 | 8.94 | blood | 11 | 2 | ||
| 18 | 24.38 | 8.92 | blood | 11 | 3 | ||
| 19 | 5.12 | 7.50 | manure | 11 | 1 | ||
| 20 | 6.18 | 7.50 | manure | 11 | 2 | ||
| 21 | 5.23 | 7.58 | manure | 11 | 3 | ||
| 22 | 0.00 | 7.49 | control | 11 | 1 | ||
| 23 | 2.02 | 7.50 | control | 11 | 2 | ||
| 24 | 2.92 | 7.46 | control | 11 | 3 | ||
| 25 | 24.16 | 7.89 | pig | 18 | 1 | ||
| 26 | 10.96 | 6.99 | pig | 18 | 2 | ||
| 27 | 15.60 | 6.85 | pig | 18 | 3 | ||
| 28 | 21.24 | 8.68 | blood | 18 | 1 | ||
| 29 | 17.99 | 9.09 | blood | 18 | 2 | ||
| 30 | 13.74 | 8.88 | blood | 18 | 3 | ||
| 31 | 3.02 | 7.71 | manure | 18 | 1 | ||
| 32 | 2.02 | 7.90 | manure | 18 | 2 | ||
| 33 | 2.97 | 7.69 | manure | 18 | 3 | ||
| 34 | 2.19 | 7.20 | control | 18 | 1 | ||
| 35 | 2.07 | 7.26 | control | 18 | 2 | ||
| 36 | 2.47 | 7.39 | control | 18 | 3 | ||
| 37 | NA | 6.46 | pig | 25 | 1 | ||
| 38 | NA | 5.80 | pig | 25 | 2 | ||
| 39 | NA | 5.68 | pig | 25 | 3 | ||
| 40 | NA | 7.74 | blood | 25 | 1 | ||
| 41 | NA | 7.26 | blood | 25 | 2 | ||
| 42 | NA | 7.62 | blood | 25 | 3 | ||
| 43 | NA | 6.48 | manure | 25 | 1 | ||
| 44 | NA | 6.64 | manure | 25 | 2 | ||
| 45 | NA | 6.01 | manure | 25 | 3 | ||
| 46 | NA | 5.70 | control | 25 | 1 | ||
| 47 | NA | 6.24 | control | 25 | 2 | ||
| 48 | NA | 6.00 | control | 25 | 3 |
Statistical analysis
[edit | edit source]ANOVA: Released CO2 flow in function of time, treatment and interaction between both
[edit | edit source]| Response: respi |
| Df Sum Sq Mean Sq F value Pr(>F) |
| PMI 2 1272.4 636.21 17.9783 1.692e-05 *** |
| treatment 3 1976.2 658.75 18.6152 1.863e-06 *** |
| PMI:treatment 6 1575.1 262.52 7.4183 0.0001425 *** |
| Residuals 24 849.3 35.39 |
| --- |
| Signif. codes: 0 ‘***’ 0.001 ‘**’ 0.01 ‘*’ 0.05 ‘.’ 0.1 ‘ ’ 1 |
| Tukey multiple comparisons of means |
| 95% family-wise confidence level |
| Fit: aov(formula = respi ~ PMI + treatment + PMI * treatment, data = env) |
ANOVA: pH in function of time, treatment and interaction between both
[edit | edit source]| Response: ph |
| Df Sum Sq Mean Sq F value Pr(>F) |
| PMI 3 17.3921 5.7974 68.9444 4.657e-14 *** |
| treatment 3 9.2794 3.0931 36.7848 1.743e-10 *** |
| PMI:treatment 9 5.4843 0.6094 7.2468 1.155e-05 *** |
| Residuals 32 2.6908 0.0841 |
| --- |
| Signif. codes: 0 ‘***’ 0.001 ‘**’ 0.01 ‘*’ 0.05 ‘.’ 0.1 ‘ ’ 1 |
| Tukey multiple comparisons of means |
| 95% family-wise confidence level |
| Fit: aov(formula = ph ~ PMI + treatment + PMI * treatment, data = env) |
ANOVA: Living/dead ratio in function of time, treatment and interaction between both
[edit | edit source]| Response: living/dead |
| Df Sum Sq Mean Sq F value Pr(>F) |
| PMI 3 2.5664 0.85548 6.1263 0.002055 ** |
| treatment 3 0.2414 0.08047 0.5763 0.634787 |
| PMI:treatment 9 1.4706 0.16340 1.1702 0.346392 |
| Residuals 32 4.4685 0.13964 |
| --- |
| Signif. codes: 0 ‘***’ 0.001 ‘**’ 0.01 ‘*’ 0.05 ‘.’ 0.1 ‘ ’ 1 |
| Tukey multiple comparisons of means |
| 95% family-wise confidence level |
| Fit: aov(formula = ld ~ PMI + treatment + PMI * treatment, data = env) |
ANOVA: Shannon index in function of time, treatment and interaction between both
[edit | edit source]| Response: H (Shannon index) |
| Df Sum Sq Mean Sq F value Pr(>F) |
| PMI 3 0.22539 0.075129 1.2125 0.3210 |
| treatment 3 0.21006 0.070019 1.1300 0.3516 |
| PMI:treatment 9 0.43570 0.048411 0.7813 0.6348 |
| Residuals 32 1.98279 0.061962 |
| Tukey multiple comparisons of means |
| 95% family-wise confidence level |
| Fit: aov(formula = H ~ PMI + treatment + PMI * treatment, data = env) |
Pearson's correlation: Correlation between pH and living/dead ratio
[edit | edit source]| Pearson's product-moment correlation |
| t = -1.4297, df = 46, p-value = 0.1596 |
| alternative hypothesis: true correlation is not equal to 0 |
| 95 percent confidence interval: |
| -0.46324980 0.08271776 |
| sample estimates: |
| cor -0.2062648 |
Pearson's correlation: Correlation between pH and Shannon index
[edit | edit source]| Pearson's product-moment correlation |
| t = -0.4397, df = 46, p-value = 0.6622 |
| alternative hypothesis: true correlation is not equal to 0 |
| 95 percent confidence interval: |
| -0.3425392 0.2235426 |
| sample estimates: |
| cor -0.06470173 |