Forensic sciences: Effects of stress and perturbations on soil communities/Results and discussion
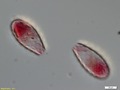
Testate amoebea observed
[edit | edit source]-
 Arcella
 -
 Assulina
 -
 Centropyxis
 -
 Euglypha


-
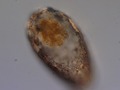 Heleopera
 -
 Nebela
 -
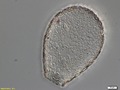
 Plagiopyxis
 -
 Trinema


Respiration: Released CO2 flow
[edit | edit source]
This graph shows the evolution of the CO2 flow released by soil organisms (usually through respiration process) for the three treatments (blood, manure, pig). The control is used as standard in order to minimise the external variables influences. Moreover, our interest was differences between treatments and control samples, thus absolute values are not interesting in those results.
Following our hypothesis, the control should be stable. The pig and the blood should have the highest released CO2 flow because they bring a lot of nutrients in soil, which is known to increase bacterial activity.[1] The manure curve should be situated under the blood and pig because its decomposition process is long, so less nutrients are brought to the soil at the beginning of the experiment,[2] which is less favorable for the bacterial activity.
Our results match with the hypothesis. Indeed, we can see very different results between treatments. On one side the manure is very similar to the control. It could be explained by the dryness of the samples, which were stored in a greenhouse by hot and dry weather conditions. The dryness of the manure didn't allow the nutrients flow to be established through the decomposition process because dryness is not good for decomposers activity. On the other side, the blood and pig treatment show highest respiration rates at each sample times (except T0, which is normal) and the pig sample has the highest one. It could be explained by the presence of a lot of necrophageous maggots remaining on the litter during the measurement. An additional explanation could be the release of cadaver fluids, which contain a lot of bacteria and nutrients, which increases the bacterial activity in soil.[1] The blood sample follows a similar curve as the pig one, but is characterized by lower values. This could be explained by the fact that blood only releases nutrient to the soil, which increases the soil bacterial activity but does not import new bacteria and maggots as the pig treatment does.
No measurement was made at T3, because the respirometer was broken.
An ANOVA and a Tukey test were made in order to test if the treatments and time impacts, and the interaction between this two variables, on the released CO2 flow were significant. The results shows that :
- Time has a significant influence on the released CO2 flow : p-value = 1.692*10-5.
- Treatments have a significant influence on the released CO2 flow: p-value = 1.863*10-6.
- There is a significant interaction between treatment and time on the released CO2 flow : p-value= 0.0001.
(Cf. datas and statistical analysis in Appendices)
pH
[edit | edit source]
This graph shows the standardized values of pH according to the control for each treatment. The standardization is done for two reasons. In first place, we have a drop in values for each treatment at T3, that may be due to improper calibration of pH meter or dryness. The standardization removes the uncontrolled variables impact. Secondly, the important values are the relative values between control and treatments, and not the absolute ones.
At T0, all treatments have a pH close to the control one, which is logic because the treatments were not applied yet. After application of the blood treatment, the pH rises sharply. Then, it stabilizes at 1.5, the highest standardized value of each sample. The increase of blood treatment pH may be explained, among other, by the release of ammonium ions.[1] Results for pig treatment are irregular. At T1, the difference with the control is relatively high. Then, after 18 days, it decreases and stabilizes at the same pH than the control. The presence of a cadaver basify the medium for the same reason as the blood does. However, changes are less significant and long lasting, because the pig cadaver is less concentrated in nutrients than the blood. As for blood treatment, adding manure durably increases the difference of pH with the control, but less strongly than the blood treatment. The highest difference with the control treatment pH is 0.5. This results are quite surprising. This treatment should have acidified the soil pH.[3] This results may be explained by the weather conditions because samples were stored in a greenhouse and there has not been an adequate intake of water to allow the decomposition of the manure and exchanges of nutrients with the soil.
An ANOVA and a Tukey test were made in order to test if the treatments and time impacts, and the interaction between this two variables, on the pH ratio were significant. In general, the p-values are significant (<0.05) for the influence of treatment, time and the interaction of this two variables.
- Time has a significant influence on the pH : p-value = 4.657e-14.
- Treatments have a significant influence on the pH : p-value = 1.743e-10.
- There is a significant interaction between treatment and time on the pH : p-value= 1.155e-05.
(Cf. datas and statistical analysis in Appendices)
Living/dead amoebae ratio
[edit | edit source]
Hypothetically, treatments and time should have an impact on the living/dead ratio of testate amoebae.[4] Indeed, treatments change the moisture rate, the nutrient content and the pH of soil and this should evolve through time.[1] Following our hypothesis, the living/dead ratio should be quiet similar for each treatment at T0 and should decrease afterwards for the pig, blood and manure treatments, but should stay stable for control. Decreases should be caused by changes in moisture rate, nutrient content, pH and specific preys availability.
On the graph, we can see that, at T0 and T1, there is no difference for the living/dead ratio of each treatment and there are almost no living amoebae (ratio closed to 0). This can be easily explained. Indeed, the Rose Bengal coloration (to stain living cells) didn’t work well for the T0 and T1 samples and it was our first encounter with testate amoebae. Thus, this is logical that no difference is seen between the two first treatments and that sudden variations happens at T2 and T3. Indeed, at T2 and T3 the coloration worked, therefore it is logical that more living amoebae have been observed. Seeing the graph, we could believe that between T2 and T3, there is a decrease of the living/dead ratio for the pig, manure and control treatments and an increase for the blood treatment. The decrease could be explain by a negative impact of treatments or weather conditions (The weather was very hot and dry between T2 and T3 and the amoebae depend a lot from the moisture rate), and the increase (blood) could be explained by a positive impact of the treatment. However, seeing the large error bars for each treatment at T2 and T3, we can not affirm that this results are reliable. Indeed, large variations between treatments and between replicates can be explained by the low number of amoebae identified (20 per replicate only), thus only one more living amoebae identified can greatly change the ratio.
An ANOVA and a Tukey test were made in order to test if the treatments and time impacts, and the interaction between this two variables, on the living/dead ratio were significant. Obviously, the time has a significant impact (p-value = 0.002) but this is only because the coloration didn’t work at T0 and T1, so the living/dead ratio suddenly increases at T2, when the living amoebae were finally able to be identified. Indeed, between T0/T1 and T2/T3, p-values are generally significant (>0.05), but no more between T0 and T1 and T2 and T3. P-values for the impact of treatment and the interaction between treatment and time are not significant.
(Cf. datas and statistical analysis in Appendices)
Evolution of communities through time for each treatment
[edit | edit source]
Previous studies showed that time and treatments influence the amoebae communities structure.[4] Indeed, these communities are very sensitive to environmental changes, which are consistently modified by treatments. The species should success each other, according to abiotic and biotic conditions of their environment (Ecological Succession theory). That hasn't been confirmed by our results.
On the graphs, we can see the abundance variation of the three more abundant testate amoebae genders through time, for each treatment.
These genders are:
Other genders are included in the category "other", because of their trivial presence. The results seem quite chaotic and can not be interpreted.
An ANOVA and a Tuckey test were made in order to test if the treatments and time impacts, and the interaction between this two variables on samples species diversity, were significant. The species diversity of each sample is represented by a Shannon index. In general, the impact of time and treatments on testate amoebae species diversity are not significant (for pig, blood, manure and control treatments: p-value > 0.05).
These unexpected results may be explained by many hypothesis :
- The experiment duration : A longer experiment could show a significant difference on communities.
- No reliable methods of identification : It was our first contact with testate amoebae, so our lack of experience makes results not reliable. We also tended to always identify the same well-known species.
- The weak number of individuals : We only identified twenty amoebae in each sample. It’s probably not enough to get reliable results. So for future studies, we advise to count more individuals to have significant results.
- Moisture rate : Our treatment pots were under a greenhouse, so they quickly dried up and we did not immediately water them. The testate amoebae don’t like the drought, so our results are probably biased.
(Cf. datas and statistical analysis in Appendices)
Correlation between living/dead amoebae ratio and pH and correlation between Shannon index and pH
[edit | edit source]The presence of the pig head and blood increased the pH to more basic conditions, which should lead to a decrease in living testate amoebae abundance and specific richness.
A Pearson's correlation test have been made in order to test if the living/dead ratio and the Shannon index are correlated with the pH variations but the correlation coefficients are respectively -0.206 and -0.064. Thus there is no significant correlation between the living dead/ratio or the Shannon index and the pH of the samples (p-value are respectively 0.159 and 0.662).
(Cf. datas and statistical analysis in Appendices)
References
[edit | edit source]- ↑ a b c d L. A. Benninger; et al. (2008). "The biochemical alteration of soil beneath a decomposing carcass". Forensic Science International.
{{cite journal}}: Explicit use of et al. in:|last=(help) - ↑ D. O. Carter; et al. (2006). "Cadaver decomposition in terrestrial ecosystem". Naturwissenschaften.
{{cite journal}}: Explicit use of et al. in:|last=(help) - ↑ A. Siegenthaler et al. (1999). "Auswirkung hoher Gaben von Klärschlamm und Schweinegülle". Umwelt
- ↑ a b I. Szelecz (2010). "Soil organisms beneath a cadaver - a tool for estimating the time of death". MSc Thesis.