Transportation Systems Casebook/Printable version
| This is the print version of Transportation Systems Casebook You won't see this message or any elements not part of the book's content when you print or preview this page. |
The current, editable version of this book is available in Wikibooks, the open-content textbooks collection, at
https://en.wikibooks.org/wiki/Transportation_Systems_Casebook
Introduction
This Casebook contains a set of case studies developed by students enrolled in the Introduction to Transportation Systems course taught in the School of Policy, Government and International Affairs at George Mason University by Prof. Jonathan Gifford.
About
The following should be included the written Case Study Report:
- Summary
- Annotated List of Actors
- Timeline of Events
- Maps of Locations
- Clear Identification of Policy Issues
- Narrative of the Case
- Discussion Questions
- Complete References of Cited (primary and secondary) Documents (with hyperlinks as appropriate)
The report should be written from a Neutral Point-of-View. Online encyclopedias are not acceptable sources for citation (feel free to read to get background information, but they are at best tertiary sources).
The report should be on the order of 3000-5000 words. It should be fully referenced. Additional readings on the order of 30 -100 pages should be assigned with the case, these will be linked on the case web page or handed out in class.
Source: Adapted from "Transportation PlanningCasebook/About, " Wikibooks , accessed Sep 2014
China’s Belt and Road
Summary
[edit | edit source]The Belt and Road Initiative (BRI) is a cross-regional infrastructural initiative unveiled by China in 2013. It has since had global commentary both positive and negative and sparked criticism and support from various political regimes. It is currently as controversial as it is ambitious. Currently, China has spent an estimated $200 billion with Morgan Stanley estimating that by 2027 China would have spent between $1.2- $1.3 trillion on the BRI.[1] China plans to complete this multi-billion dollar initiative in 2049.
Annotated List of Actors
[edit | edit source]· Hillary. R. Clinton, U.S. Secretary of State (2009-2013)
· Xi Jinping, General Secretary of the Chinese Communist Party and President of China
· Central Committee (of the Chinese Communist Party wrote the comprehensive reform blueprint of the Initiative in November 2013).
· State Council of the People’s Republic of China. (The chief administrative authority of China)
· National Development and Reform Commission. (NDRC)
· Ministry of Foreign Affairs. (China)
· Ministry of Commerce. (China)
· Asian Infrastructure Development Bank (AIIB), China-ASEAN Maritime Cooperation Fund, China-Indonesia Maritime Cooperation Fund and Silk Road Fund. These financial institutions lend out loans for infrastructure projects on BRI mostly in the Asia-Pacific region.
· ASEAN. The Association of Southeast Asian Nations is a regional intergovernmental organization of the member countries that promotes and facilitates economic, political, security, military, educational, and sociocultural integration among its members.
· Participating countries and international organizations.
Maps of Locations
[edit | edit source]
Timeline of Events
[edit | edit source]- Initiative unveiled in September and October of 2013 by Chinese leader Xi Jinping.
- Blueprint of the Initiative was made by the Central Committee with the approval of the State Council in November 2013.
- In March 2015, detailed plans of the BRI were laid out by the National Development Reform Commission (NDRC), Foreign Affairs Ministry and Ministry of Commerce.
- Asian Infrastructure Development Bank although established in 2013 began its operation in December 2015.
- The first and inaugural forum on the Belt and Road Initiative was held in May 2017.
- October 2017, the BRI is added to the Chinese Communist Party’s constitution.
- Second forum on the BRI was held in April 2019.
Clear Identification of Policy Issues
[edit | edit source]The Chinese Belt and Road Initiative foster regional, economic and international development for about 64% of the World’s population. This initiative has the following:
Pros:
[edit | edit source]- Fosters economic development and integration resulting in growth to both developed and developing countries.[1] This initiative seeks to make this integration a win-win cooperation and prosperity for all.
- Improving upon and influencing current international economic system reforms and architecture.[2] Having had slow and difficult international economic reforms in decades, China on becoming an emerging power seeks to play an important role in shaping the global economic system.
- Provides hard infrastructure in the form of roads, railways, pipelines ports and others which will lead to a reduction in transportation time and other costs associated with trade.[3] The creation of the infrastructure will help countries export their products easily to other countries leading to such benefits as earning of foreign currencies, creation of jobs and increased market shares of goods and services.
Cons:
[edit | edit source]- Although not fully executed, the BRI faces certain challenges, criticisms and oppositions. Some of the major challenges of the BRI stems from the risk associated with how broad and ambitious the BRI is and also based on political values of participating countries as against that of the Chinese. Some of these challenges, criticisms and opposition include:
- Lack of information and transparency of BRI investments. Some of the BRI investments have the requirement that they can only be awarded and undertaken by Chinese contractors. Contractors use this requirement as a basis to not disclose information which allows them the opportunity to inflate the costs of infrastructure. This has led to over-inflated cost and increase debts on the part of borrowing countries partaking in the building of infrastructure. This has then led to mistrust and opposition and even withdrawal from the BRI in some countries.[4]
- The BRI is considered as neocolonialism or a ploy by China to dominate Asia and trade. Given the low-interest loan rates accessible to participating countries in developing the infrastructure for the BRI, critics see this as a way of China creating unsustainable debt burdens for its neighbors and potentially taking control of regional choke points.
- Excess exports by China are another sign that raises questions and criticisms on the dominance of China on trade. Some Chinese experts are of the view that one of the benefits of the BRI investments is to be able to absorb China’s excess capacity which although true could create unfavorable trading terms for other countries. India is one of the countries that see China as using such a ploy.[5]
- The risk of clashes of political values and culture across countries. Since the BRI has a broad and rich mix of political regimes and economic systems such as capitalism, socialism and others, there are bound to be challenges in cooperation and coordination among countries, which may result in delays in the execution of projects. [6]
- Difficulty in achieving financial sustainability of cross-country projects. To be able to sustain these cross-country infrastructure projects, the return on investment should outweigh the cost. Most Foreign Direct Investment (FDI) undertaken by the Chinese government and companies have not been profitable. This shows that China does not have lot of favorable outcomes running cross-border projects which makes the profits to be derived from the BRI questionable.[7]
Narrative of the Case
From ancient Silk Road to the Belt and Road Initiative: a historic perspective of transcontinental trade in Eurasia.
The human being has historically been in search of more favorable conditions to live in. This desire has been driving him to explore new destinations and open new routes.
The emergence of cross-continental trade networks in the Eurasian continent date back to the period of the Han Dynasty in China, when the unique Chinese merchandise like silk and spices reached Europe. Trade in silk and related byproducts in the broader Eurasian continent opened small-size trade linkages between and among the regional commercial hubs in the Central Eurasia, and stimulated the growth of medieval cities like Samarkand, Bukhara, Aleppo etc. These small trade linkages emerged into major trade routes connecting China to European markets as transcontinental trade began to evolve. Historians named the network of commercial trade routes connecting China to Europe as the “Silk Road”.
Transcontinental trade between China and Europe was flourishing until Constantinople – the capital city of Byzantine Empire and the major trade hub on the crossroads of Europe and Asia, fell to Ottoman Empire in 1453. Constantinople’s fall dramatically changed the geopolitics in the broader Eurasian continent and stimulated the European explorations of alternative trade routes to China.[1]
Although, the commerce in the city re-established following the conquest and Istanbul[2] regained its dominance over transcontinental trade routes shortly, overland trading eclipsed by the exploration of new maritime routes.[3] Improvement in technology which could support long maritime journeys, as well as significant scientific changes about the understanding of the World in late fifteenth century would encourage the Europeans to find new ways for trade with China, avoiding trade middlemen of Central Asia and then less friendly Turkish control of the overland trade routes.
Throughout the history wars and geopolitics significantly shaped and reshaped the Eurasian transcontinental trade routes on micro and macro levels. Decline of the overland trade via Silk Road had mirrored onto the development of the trade hubs in Eastern China, Central Asia and Caucasus. Only in eighteenth century the Silk Road region regained its strategic importance as it had become the intersection of three major geopolitical powers-Russian, British and Chinese empires – now mostly from cultural and archeological point of view.[4]
Establishment of Russian dominance over the Central Eurasian region and the Caucasus in early nineteenth century and emergence of the Soviet Union in 1920s significantly affected the flow of people and goods through the Silk Road.
The collapse of the Soviet Union in 1991 opened unique opportunities for the regional trade, integration and re-emergence of the ancient Silk Road, as this region become attractive again for foreign investments. In 1993, the European Union introduced the “Transport Corridor Europe-Caucasus-Asia” (TRACECA) program to develop transport corridor from Europe to China, via the Black Sea, the Caucasus, the Caspian Sea and Central Asia.[5] Central Asia and the Caucasus has significantly enjoyed the Western political and economic support until recently. On July 20, 2011, in Chennai, India, U.S. Secretary of State Hillary R. Clinton laid out the United States’ vision of the new Silk Road and the U.S. support to re-establishing the “international web and network of economic and transit connections” in Eurasia. The U.S. policy concerning the trade and transit connections in the Central Eurasia would later be dubbed as the New Silk Road Initiative.[6]
In 2013, in the light of the NATO’s (North Atlantic Treaty Organization) gradual withdrawal from Afghanistan, as well as the U.S.’ active engagement with the Central and South Asian countries to forge the regional integration, China introduced the “Belt and Road Initiative” – a new transcontinental integration policy which would stimulate closer economic ties and deepen cooperation in the greater Eurasian region – but this time, under Chinese dominance.
Belt and Road Initiative as an economic tool for the integration of regional economies
Officially, the BRI was introduced by the Paramount leader of the People's Republic of China Xi Jinping during his visits to Kazakhstan in September 2013 and to Indonesia in October 2013. The multi-billion dollars initiative which covers 71 regional economies, including China involves two major components: Silk Road Economic Belt and the New Maritime Silk Road.
In his speech at the Nazarbayev University in Kazakhstan, Chinese leader Xi Jinping proposed a new integration policy to improve the transcontinental connectivity and cooperation by building “economic belt along the Silk Road” which would span from the Pacific to the Baltic Sea.[7]
A month later, Chinese leader Xi Jinping during his speech before the Indonesian Parliament introduced the New Maritime Silk Road Initiative, which envisages strengthening the China-ASEAN maritime cooperation and investments through the China-led China-ASEAN Maritime Cooperation Fund and China-Indonesia Cooperation Fund.[8]
For the implementation of this initiative China has signed intergovernmental agreements and memorandums of understanding with number of countries trying to bind the economies to the emerging transcontinental network. However, the BRI geography still remains debatable due to lack of integrated transportation linkages, disparity in regional economic development and huge cost burden that the initiative can put over smaller economies.
According to the RAND Corporation report, poor development of overland transportation networks, particularly rail connection between neighboring countries significantly affects the regional trade. Rail connection and harmonization of border-crossing processes are of the greatest importance for the trade facilitation in the Central Eurasian region as the 25% of BRI countries in this region are landlocked, thus are heavily depended on the rail communication. The RAND Corporation estimates with regard to the correlation of rail connection to the level of trade in the BRI region show that adding rail connection between trading partners increases trade by 2.8 per cent in average (Table 1).[9]
Table 1. Sensitivity test of the impact of transport connectivity on export trade volumes
| Change of transport indices | Change in trade |
| Added rail connection | 2.8 per cent |
| Air distance reduced by 10 per cent | 0.41 per cent |
| Maritime distance reduced by 10 per cent | 0.13 per cent |
Source: RAND Corporation
From economic point of view, experts argue that if fully implemented, the BRI can reduce travel time for transcontinental delivery of goods and stimulate foreign investments to the regional economies. With proposed level of investment and improved regional trade relations between and among the regional countries, the BRI’s realization would not only affect the level of trade in the BRI region but also would have impact on the non-BRI markets. According to the World Bank report (2019), if fully executed the BRI transport infrastructure can reduce travel time by up to 12 per cent and increase world trade between 1.7 and 6.2 per cent.[10]
The multibillion dollar initiative is heavily dependent on the Chinese investments. It is funded through different China-led programs and financial institutions, most importantly Asian Infrastructure Investment Bank, China-ASEAN Maritime Cooperation Fund, China-Indonesia Cooperation Fund and the Silk Road Bank. Although most of the popular sources indicate that Chinese investments for the BRI projects is from $1 trillion -$8 trillion, the World Bank estimates that the overall BRI investments do not exceed $575 billion.[11]
According to the World Bank statistics, the BRI financing is rapidly increasing public and corporate debt in emerging markets, which have already reached the historic pick since 1980s.[12] In this circumstances, increasing debt burden in less developed economies create challenges for sovereign debt sustainability and make them vulnerable to debt distresses. The Center for Global Development has identified 23 BRI economies relevantly susceptible to the raising debt burden. Eight of them are of particular concern: Djibouti, the Kyrgyz Republic, Lao’s People’s Democratic Republic, the Maldives, Mongolia, Montenegro, Pakistan and Tajikistan.[13]
Belt and Road as the foreign policy tool
In 2017, the 19th National Party Congress of the China’s Communist Party formally incorporated the Belt and Road Initiative into the Chinese Constitution by writing the following wording into it: “[] following the principle of achieving shared growth through discussion and collaboration, and pursuing the Belt and Road Initiative.”[14] This was significant adjustment into the BRI, as it now represents the Government’s policy rather than Chinese overseas investment program.
Although China’s BRI project has widely been seen mostly in economic terms, it has always had strategic meaning for the Chinese Government. The BRI policy identifies five major elements for the transcontinental integration: policy communication among regional countries; hardware improvement; trade facilitation; monetary policy; and people-to-people contacts.[15] Almost all these elements hold national security importance for China.
Experts assert that by investing in BRI Chinese Government aims to stabilize border regions by mitigating threats time-to-time emanating from peripheries; securing energy supply and transport routes by establishing overland oil transportation systems; and the last but least to cultivate stronger diplomatic and economic influence in the region by signing partnership agreements and memorandums of understanding and investing in the development of regional economies.[16]
Effective implementation of the BRI in a broader perspective is shaped by the expectations and reactions of the major World powers, like the United States and the European Union. Although the U.S. Government in many occasions voices that the U.S.’ New Silk Road Initiative and BRI are complementing each other, the trade confrontations between the two, as well as increasing Chinese influence over the regions once dominated by the western investments can prove the opposite. During the hearing before the Senate Armed Services Committee, Secretary James Mattis commented on the BRI in a following way:[17]
Regarding 'One Belt, One Road,' I think in a globalized world, there are many belts and many roads, and no one nation should put itself into a position of dictating 'One Belt, One Road.' That said, the 'One Belt, One Road' also goes through disputed territory, and I think that in itself shows the vulnerability of trying to establish that sort of a dictate.
Another factor that makes the BRI an issue of the national security for China is the security and safety concerns associated with Chinese business involvement in remote and unstable areas like Africa, Middle East and Central Asia. These threats include but not limited to examples as anti-Chinese sentiments in Yemen – deportation of 500 Chinese nationals from Yemen; killing of Chinese citizens in Syria in 2015 and in Pakistan in 2017 etc.[18]
The withdrawal of NATO and U.S. forces from Afghanistan and U.S. distancing from Central Eurasian affairs in recent years have created a geopolitical vacuum in Central Eurasian which has become more susceptible to the increasing Chinese influence, most importantly through the Belt and Road Initiative.
Lessons Learned / Takeaways
[edit | edit source]· The BRI now a part of the Constitution of the Communist Party of China represents the Government’s policy rather than Chinese overseas investment program.
· Although China’s BRI project has widely been seen mostly in economic terms, it has always had strategic meaning for the Chinese Government.
· China seeks to reform existing international economic systems through the BRI.
· There are oppositions to the BRI because the benefits to be derived by the Chinese far exceed the benefits to other participating regional countries.
· According to the World Bank statistics, the BRI financing is rapidly increasing public and corporate debt in emerging markets
Discussion Questions
[edit | edit source]· Is it fair to limit some contracts to Chinese contracts?
· How can transparency be enforced for the BRI?
· Do the overall benefits of the BRI outweigh the current human, economic and political cost?
· How else can the BRI be funded besides Chinese investments?
· Will BRI make fair trade more difficult?
For more information follow the link below
https://openknowledge.worldbank.org/bitstream/handle/10986/31878/9781464813924.pdf
References
[edit | edit source][1] United Nations Educational, Scientific and Cultural Organization (UNESCO). Silk Roads, Dialogue, Diversity and Development (UNESCO). Istanbul: https://en.unesco.org/silkroad/content/istanbul
[2] Following the conquest of Constantinople, the city was renamed to Istanbul.
[3] Peyrouse, Sebastein. The Ohio State University. Building a New Silk Road? Central Asia in the New World Order: https://origins.osu.edu/article/building-new-silk-road-central-asia-new-world-order
[4] UNESCO. The End of the Silk Road. Chapter six: https://en.unesco.org/silkroad/sites/silkroad/files/knowledge-bank-article/the%20end%20of%20the%20silk%20route.pdf
[5] European Union. Central Asia-Transport: https://ec.europa.eu/europeaid/regions/central-asia/eu-support-transport-development-central-asia_en
[6] Clinton R, Hillary. Secretary of State (2009-2013). Remarks at the New Silk Road Ministerial Meeting, September 22, 2011, New York: https://2009-2017.state.gov/secretary/20092013clinton/rm/2011/09/173807.htm
[7] Jinping, Xi. President of the People’s Republic of China. Transcript of the speech at the Nazarbayev University, September 7, 2013, Almaty, Kazakhstan: https://www.fmprc.gov.cn/mfa_eng/wjdt_665385/zyjh_665391/t1078088.shtml
[8] Jinping, Xi. President of the People’s Republic of China. Transcript of the speech at the Indonesian Parliament, October 2, 2013, Jakarta, Indonesia: https://reconasia-production.s3.amazonaws.com/media/filer_public/88/fe/88fe8107-15d7-4b4c-8a59-0feb13c213e1/speech_by_chinese_president_xi_jinping_to_indonesian_parliament.pdf
[9] Hui Lu, Charlene Rohr, Marco Hafner, Anna Knack, “China Belt and Road Initiative: Measuring the impact of improving transportation connectivity on trade in the region”, (RAND Europe, 2019) p. 14-15: https://www.rand.org/pubs/research_reports/RR2625.html
[10] The World Bank Group Report, “Belt and Road Economics, Opportunities and Risks of Transport Corridors”, 2019, p 5
[11] Ibid., p. 37
[12] Ibid., p. 39
[13] John Hurley, Scott Morris, Gailyn Portelance, “Examining the Debt Implications of the Belt and Road Initiative from a Policy Perspective”, (Center for Global Development, 2018), p. 11: https://www.cgdev.org/sites/default/files/examining-debt-implications-belt-and-road-initiative-policy-perspective.pdf
[14] An Baijie, China Daily: http://www.chinadaily.com.cn/china/19thcpcnationalcongress/2017-10/24/content_33644524.htm
[15] Jinping, Xi. President of the People’s Republic of China. Transcript of the speech at the Nazarbayev University, September 7, 2013, Almaty, Kazakhstan: https://www.fmprc.gov.cn/mfa_eng/wjdt_665385/zyjh_665391/t1078088.shtml
[16] Dr.Joel Wuthnow, Research Fellow, Center for the Study of Chinese Military Affairs Institute for National Strategic Studies, U.S. National Defense University, Testimony before the U.S.-China Economic and Security Review Commission Hearing on “China’s Belt and Road Initiative: Five Years Later” (2018) https://www.uscc.gov/sites/default/files/Wuthnow_USCC%20Testimony_20180123.pdf
[17] CSIS, Reconnecting Asia: https://reconnectingasia.csis.org/analysis/entries/many-belts-and-many-roads/
[18] Dr.Joel Wuthnow, Research Fellow, Center for the Study of Chinese Military Affairs Institute for National Strategic Studies, U.S. National Defense University, Testimony before the U.S.-China Economic and Security Review Commission Hearing on “China’s Belt and Road Initiative: Five Years Later” (2018) https://www.uscc.gov/sites/default/files/Wuthnow_USCC%20Testimony_20180123.pdf
[1] China Power, https://chinapower.csis.org/china-belt-and-road-initiative/
[2] Yiping Huang, “Understanding China’s Belt and Rad Initiative: Motivation, framework and assessment” China Economic Review, Vol 40, September 2016, pp 314-321.
https://www.sciencedirect.com/science/article/pii/S1043951X16300785#fn0005
[3] Chatzky, A and McBride, J., “China’s Massive Belt and Road Initiative”, Council on Foreign Relations, May 21, 2019, accessed October 12th, 2019
https://www.cfr.org/backgrounder/chinas-massive-belt-and-road-initiative
[4] Chatzky, A and McBride, J., “China’s Massive Belt and Road Initiative”, Council on Foreign Relations, May 21, 2019, accessed October 12th, 2019
https://www.cfr.org/backgrounder/chinas-massive-belt-and-road-initiative
[5] Chatzky, A and McBride, J., “China’s Massive Belt and Road Initiative”, Council on Foreign Relations, May 21, 2019, accessed October 12th, 2019
[6] Yiping Huang, “Understanding China’s Belt and Rad Initiative: Motivation, framework and assessment” China Economic Review,Vol 40, September 2016, pp 314-321.
https://www.sciencedirect.com/science/article/pii/S1043951X16300785#fn0005
[7] Yiping Huang, “Understanding China’s Belt and Rad Initiative: Motivation, framework and assessment” China Economic Review, Vol 40, September 2016, pp 314-321.
[1] Chatzky, A and McBride, J., “China’s Massive Belt and Road Initiative”, Council on Foreign Relations, May 21, 2019, accessed October 12th, 2019
https://www.cfr.org/backgrounder/chinas-massive-belt-and-road-initiative
NYC Fare Payment System
NYC Fare Payment System
[edit | edit source]This case reviews the Introduction of the New York City transit system’s new fare payment system. It is the collaborative work of Aleksandr Grinshpun and Lukas Camby, graduate students enrolled in George Mason University's Transportation Policy, Operations, and Logistics Program at the time of writing. The following casebook explores the key actors, policy challenges, and history associated with NYC Fare Payment System in the context of its integration into America's public transport. It was produced as an assignment for George Mason University's Introduction to Transportation Systems graduate course, taught by Dr. Jonathan Gifford.
Summary
[edit | edit source]In New York City, the earliest form of fare collection for public transit started with the nickel in exchange for a ticket. As all the transportation modes expanded and centralized, fares increased, and new technologies such as turnstiles and tokens had to be introduced to create operating efficiencies and cut costs. Some fare payment utilities were easily adopted, while others are more difficult to implement. One of the more recent fare payment technologies initiated in the 1990’s was MTA’s MetroCard.[1] These plastic cards featured a metallic strip similar to a credit card that could be swiped at a fare collection point and could also be reloaded at fare machines. This system was proposed as an alternative to the token-based system that past New York City transit companies and operators had used from the 1950’s to the 1990’s without having to ever completely overhaul the entire system.[2] A new digital system was favored. The institution of the MetroCard in 1993 was to facilitate ridership data in an attempt to improve operations.[3]
It was a huge shift for transit users at the time. Jack Lusk, a senior vice president with the MTA, told the New York Times in 1993 that “this is going to be the biggest change in the culture of the subways since World War II, when the system was unified… we think the technology is working just fine. But it may take riders some getting used to.”[4] It would take an additional 4 years until May 14th, 1997, when the entire bus and subway system accepted MetroCard. Cubic Transportation Systems designed the magnetic-stripped, blue-and-yellow card to respond to a swipe-based system. The MetroCard works in the following manner: each MetroCard is assigned an exclusive, everlasting ten-digit serial number when it is manufactured. The value on the card is stored magnetically. While each transaction on the card is recorded in the Automated Fare Collection (AFC) Database. After money is loaded onto the card and it is swiped through a turnstile, the value of the card is read, a new value is written, the passenger goes through, and the AFC is updated with that transaction.[5] Although this system was novel at the time of introduction, it quickly became notorious for its technical limitations. Only a few years after the system was introduced newer technology became available that allowed for contactless payment cards to be used. WMATA in Washington, DC introduced SmartTrip in 1999 as one of the first contactless smartcard systems used for paying transit fares in the United States.[6] Most recently, on May 31,2019, the MTA launched a pilot program of its new tap-to-pay system, known as OMNY, that is intended in due course to take the place of swiping a MetroCard. The fare technology will roll out incrementally, allowing transit officials to overcome obstacles as they work toward fully retiring the MetroCard in 2023. With OMNY, riders can bypass lines to refill their Metro cards and simply tap their contactless bank cards or mobile wallet app on their smart phones to pay the fare.[7]
Annotated List of Actors
[edit | edit source]● Public Transit Users
● MTA vice president Jack Lusk (1993)[8]
● Cubic Transportation System (MetroCard)
● Mayor David Binkens (1990-1994)[9]
● Mayor Rudi Giuliani (1994-2001)[10]
● Mayor Michael Bloomberg (2002-2013)[11]
● Mayor Bill de Blasio (2013-present)[12]
● Accepted on the following public transportation providers:
○ Rail:
■ AirTrain JFK
■ New York City Subway
■ PATH
■ Staten Island Railway
○ Bus:
■ Bee-Line
■ Hudson Rail Link
■ MTA Regional
■ Nassau Inter-County Express
○ Other:
■ Roosevelt Island Tramway
● Technology Companies
○ Apple Pay
○ Samsung Pay
○ Google Pay
● Financial Institutions
Timeline of Events
[edit | edit source]- At inception, private companies organized rapid transit routes and surface lines. Abraham Brower established New York City's first public transportation route in 1827. It was a 12-seat stagecoach called "Accommodation," that operated along Broadway from the Battery to Bleecker Street.[13]
- As of 1831, Brower had added the "Sociable" and horse drawn "Omnibus."[14]
- In 1832, John Mason organized the New York and Harlem Railroad, that used a street railway powered by horse-drawn cars with metal wheels running on metal track.[15]
- As early as 1855, 593 omnibuses traveled on 27 Manhattan routes and horse-drawn cars ran on street railways on Third, Fourth, Sixth, and Eighth Avenues.[16]
- Before any underground excavation commenced for the "official" underground subway in 1900, under the management of the Brooklyn Rapid Transit Corporation (BRT), the City of Brooklyn was serviced by a series of elevated railway lines referred to as "Els".[17]
- From 1870 to 1873, Alfred E. Beach created a 312-foot tunnel under lower Broadway and ran a subway car operated by "pneumatic pressure."[18]
- In 1872, the Interborough Rapid Transit Company (IRT)[19] began operating the first El in Manhattan along Ninth Avenue.[20] The elevated lines accommodated efficient rapid transit service, with frequent trains, a cheap fare, and swifter travel time than street traffic.[21] However, these wooden cable cars powered by steam, were prone to mechanical malfunctions such as; snapped cables, engine problems, and track fires.[22]
- Nearing the end of the 19th century, the adoption of electricity on trolley cars, led to the replacement of horses for propulsion. [23]
- New York City's first ‘official’ subway system opened its doors for business in Manhattan on October 27, 1904.[24]
- Until May 10, 1920, to pay for their fare Subway customers purchased tickets which cost $0.05.[25]
- IRT service expanded to the Bronx in 1905, to Brooklyn in 1908, and to Queens in 1915. Also in 1915, the BRT began subway service between Brooklyn and Manhattan. Shortly after, the Brooklyn-Manhattan Transit Corporation (BMT) absorbed the BRT.[26]
- Trolley bus lines, also called trackless trolley coaches, used overhead power lines to serve Staten Island in the 1920s.[27]
- Beginning in 1930, for three decades, Brooklyn's surface transit were also reliant on trolley bus lines.[28] However, by 1956 and 1960, motor buses had become the dominant form of New York City public transit, replacing trolley cars and trolley buses.[29]
- The first city-run subway service began service in 1932, when the NYC's Board of Transportation completed construction of the Eighth Avenue line and created the Independent Rapid Transit Railroad (IND).[30]
- Post the purchase of the BMT and IRT in 1940, NYC's Board of Transportation became the sole owner and operator of all the city’s subway and elevated lines.[31]
- Towards the late 1940’s, the city also acquired three other bus companies that operated in Queens and Staten Island.[32]
- From 1920 through 1948, turnstiles were introduced for fare payment collection as a cost-cutting initiative in response to post-World War I inflation.[33]
- In 1948, turnstiles started accepting dimes once the fares were increased by 5 cents.[34]
- On June 15, 1953, the New York State Legislature formed the New York City Transit Authority (now MTA New York City Transit) as a separate public entity to manage and operate all city-owned bus, trolley, and subway routes.[35]
- Since turnstiles couldn't handle two different coins, tokens replaced coins in 1953, when the fare rose to 15 cents.[36]
- In 1970, NYCTA released a larger version of the classic Y token in 1970 to accompany a fare increase to 30 cents.[37]
- In 1979, for the anniversary of the Subway, the Diamond Jubilee token was unveiled. The commemorative token had a fare value of 50 cents.[38]
- In 1980, the city introduced the Solid Brass NYC token, which featured an updated design.[39]
- 1986 brought a new token called “bull’s eye,” and “fare rose to $1 a trip.”[40]
- In 1995, the MTA introduced the symbolic “Five Boroughs” token, the last token before the MetroCard, which was phased out in 2003. This token was valued at $1.50.[41]
- In 1993, the MetroCard was introduced.[42]
- When WMATA launched SmartTrip in 1999, it was the nation’s first contactless smart card for transit.[43]
- On May 31,2019, the MTA launched a pilot program of its new tap-to-pay system, known as OMNY, that is intended to replace swiping a MetroCard. The fare technology is expected to be released in phases, allowing transit officials to identify complications and find solutions prior to fully retiring the MetroCard in 2023.[44]
History of NYC Public Transit Fares
[edit | edit source]● $0.05 (1904– July 1, 1948)
● $0.10 (July 1, 1948 – July 1, 1953)
○ Bus fare: $0.07 from 1948 until 1950 and $0.10 from 1950 till 1953
● $0.15 (July 2, 1953 – July 5, 1966 )
○ Bus fare: $0.13 from 1954 till 1955 and $0.15 from 1956 till 1966; 5th Avenue Bus line fare raised to 15 cents on January 1, 1954
● $0.20 (July 5, 1966 – January 3, 1970 )
● $0.30 (January 4, 1970 – December 31, 1971 )
● $0.35 (January 1, 1972 – August 31, 1975 (MSBA/Long Island Bus from 1973)
In December 1973, the MTA started trialing a program in which passengers could pay a single one-way fare to take round trips on the subway, buses, and railroads on Sundays. Since this resulted in higher ridership, the MTA extended it through the beginning of 1975.
● $0.50 (September 2, 1975 – June 27, 1980 )
● $0.60 (June 28, 1980 – July 2, 1981 )
● $0.75 (July 3, 1981 – January 1, 1984 )
● $0.90 (January 2, 1984 – December 31, 1985 )
● $1.00 (January 1, 1986 – December 31, 1989 )
● $1.15 (January 1, 1990 – December 31, 1991 )
● $1.25 (January 1, 1992 – November 11, 1995 )
● $1.50 (November 12, 1995 – May 3, 2003 )
● $2.00 (May 4, 2003 – June 27, 2009 )
● $2.25 (June 28, 2009 – December 29, 2010 )
● $2.25 base fare (December 30, 2010 – March 2, 2013 )
● $2.50 SingleRide MetroCard ticket fare
● $2.50 base fare (March 3, 2013 – March 21, 2015 )
● $2.75 SingleRide MetroCard ticket fare
● $2.75 base fare (March 22, 2015 – present)
● $3.00 SingleRide MetroCard ticket fare
Maps of Location
[edit | edit source]Policy Issues
[edit | edit source]● Too old or too new? Since the system used technology that has only been tried in a few other places, the MTA is being extremely ambitious with the OMNY project. They are also putting a huge amount of confidence that the technology will work seamlessly. Contactless smartcard systems are now the standard method of paying for transit fares in many parts of the world and many people have long been perplexed about why the New York City transit system has used a system that feels very obsolete by comparison as it was developed using early 1990’s technology. The root of the problem is that New York switched from tokens to electronic reloadable fare cards a little early, before the technology developed further just 5 years later to allow for a contactless system adopted by WMATA. Although WMATA’s SmartTrip system is not without its problems, it is still a very reliable system that has completely replaced the disposable farecards that the Washington Metro used beforehand. While the system was cutting edge at the time of its installation, the technology of fare payments advanced very quickly and obsolescence by the late 2000’s was inevitable.
● Misuse of Technology As with all new technologies, the public is concerned that their personal identifying information (PII) may be put at risk in a contactless fare system. Policymakers will have to ensure that appropriate data security measures are in place and evolve as new cyber threats emerge. Furthermore, an aversion to government-operated technology systems among the general public may give rise to skepticism over this method of payment. Although this phenomenon is already taking place with the MetroCard, the fact that contactless fare payment may cross over ridership information with PII may be worrisome to certain users.
Additionally, fare evasion/insufficient funds will continue to be an issue with contactless fare technology. Systems will need to ensure collection of fares prior to boarding or the beginning of a trip to avoid freeloading off of the system. Non-collection of fares may put a burden on MTA’s bottom line.
● Advertising on Metro Cards Metro cards have long been used for advertising. Pilot programs that started in the early 2000’s undertaken to see how effective advertisements were for the Metro cards. The program was expanded in 2012 when the entire card was put on offer for advertisement space, this created a frenzy of companies placing logos and messages on New York City farecards. While advertising on transit is far from a new idea, the concept of placing advertisements on transit fare cards has rarely been done on a large scale before. The benefits of this program include added revenue from a larger cohort of advertisers and much greater flexibility of ad selection and variety than compared to using physical wraps on trains. This policy however has been criticized for creating some confusion amongst transit riders about the need for consistency in the appearance of the cards. Some have also questioned why some cards have ads while others don’t and that the fare remains the same regardless it the card has an ad or not. While the new system will feature new cards with the OMNY logo, it is yet to be seen on whether the new cards will feature ads.
● Lack of connectivity with other transit systems in the region such as, NJ transit. While the OMNY program is going to be compatible with all services operated by MTA including the subway, local buses, express buses, LIRR, and Metro-North. Compatibility with these extra services will be added in stages as OMNY begins its proving ground operations with the subway. But one notable transit agency in the region that will not be participating in ONMY is New Jersey Transit which operates NJ Transit Rail and many local and express buses that serve urban and suburban communities in Northern New Jersey. They will be using a different system developed by Conduent of Florham Park, NJ. This lack of connectivity will be notable given how most large urban areas have favored developing a single smartcard payment system that works amongst all major transit providers in an area such as WMATA for the Washington, D.C. area. While the need for connections and compatibility has been addressed within MTA, the concerns over lack of coverage with the services outside the state of New York have been a cause of concern. Advocates want the system to be as integrated with all services in the region as it can be, and as things are currently developing, a commuter from New Jersey may have to maintain 2 cards in their wallet so that both NJ Transit services and MTA services can be used conveniently. The issue has existed for a while as NJ Transit has long had their own train and bus tickets.
● Half- priced fares and Access-A-Ride New York City has instituted a system of reduced fares in recent years for enabling low-income people to use the subways in a more affordable fashion. The programs issues special Metro cards for those who qualify by submitting a request to the MTA. The introduction of the new OMNY system has been met with concerns from some advocates that the new system is inherently disadvantageous to low income subway user in that it will make it more difficult to have access to these kinds of benefits when the new system becomes dominant. MTA has not yet specified how it plans to keep these benefits going once OMNY is fully installed and operational.
● The issue of cash users. Although the new system will dispense reloadable smartcards from fare machines that accept cash, OMNY has been criticized for being another example of how technological change is making cash users feel like they are a burden. OMNY will feature credit card payment options both online and at physical fare machines that will be universally accepted. MTA has not provided details on how the new cards will be distributed to those who wish to continue to use cash to pay for their fares. WMATA in the D.C. area faced early criticism for SmartTrip cards being only available in a few select stations and that the cards cost $10 a piece. The MTA of New York will almost certainly suffer similar criticisms once these new machines that dispense OMNY cards are put into service.
Narrative of the Case
[edit | edit source]New York City’s public transportation fare payment has evolved with the demands of an expanding system. However, one could argue that fare payment technology has not kept pace with the ridership volume created by that expansion. The earliest form of fare payment was five cents in exchange for a ticket to board. In the 1920’s turnstiles were introduced to lower costs associated with operating public transit. Since turnstiles were unable to accept multiple coins for payment as fares increased, tokens became the currency to board public transit. However, tokens are unable to provide ridership data that the MTA urgently craved. Collecting data would allow for knowing “the exact location and time that every rider entered the station or boarded a bus.” In theory, this data would allow for better planned routes serving the ridership population when needed at a reduced operating cost. As such, the magnetic strip MetroCard was introduced in the early 1990’s. These Metro cards are still in use today. In May 2019, MTA launched its new tap-to-pay system, known as OMNY, that is intended to replace the MetroCard.
Unfortunately, some technologies are more adaptable than others. For example, the exchange of coins for tickets is straightforward. The later iteration of exchanging coins for tokens is also a concept that is easy to implement. Turnstiles were also easily accepted by the public. On the other hand, transitioning from tokens to the MetroCard provided challenges for both users and the MTA. The AFC made frequent errors in tracking values held on Metro cards. Turnstiles often were not able to read the cards and users found ‘hacks’ to game the system and gain free ridership.
The introduction of the new payment system for the New York City subway has been touted as a crucial step forward for the public transportation system of America’s most populous city. As other cities around the world have been aggressively adopting new technologies into their operations, the MTA has taken key notice. With the introduction of other fare payment systems that use contactless cards in the united states and some systems introducing smartphone based payment systems, the New York City subway system’s fare payment technology has become notably outdated by comparison in recent years. The system is in desperate need of an update as eventually the Metro card system will become incompatible with other technologies and the existing system would need the be maintained through contractors that no longer make the required components and software making the system much more expensive to operate. The fare payment system update is also a great way for the MTA to tout the continued advancement and upgrading of the system, as the subway has long struggled with a perception of widespread infrastructure woes due to the age of the system and has tried to find innovative ways of solving these pressing problems and restoring rider satisfaction for a city as globally important as New York.
In order to restore ridership and give the public greater satisfaction when using public transit, MTA is converting to a OMNY, a contactless fare payment system, wherein riders will be able to bypass lines to refill their Metro cards and simply tap their contactless bank cards or mobile wallet app on their smart phones to pay the fare. Metro cards, which are 25 years old, “run on OS2,” an obsolete operating system deemed “‘no longer supportable’” by MTA leadership. User experience is also expected to improve, with leaders aiming to facilitate “‘end-to-end connectivity’ across” multiple modes of MTA-offered transit. This contactless feature is supposed to support saving riders their most valued commodity - time.
From a technical standpoint, an update is a must. But an update is not without consequences for the riders who are used to the current system. The new system has such a heavy reliance on the latest technology of fare collection that some who are used to the relative simplicity and familiarity of Metro cards may be somewhat apprehensive about adopting the new system. While the benefits from the installation of the new system will only become apparent as the new fare and turnstile machines are implemented. Lessons Learned
As with all new technologies, there is an evolution throughout the birth, growth, and maturity stages. One can say that the implementation of the MetroCard was like implementing developed technology in an age that favored more innovative data tracking and management systems. It is also quite surprising that the most-used transit system in the United States has taken over 20 years, or well into the maturity stage, to adopt contactless fare payment technology. While newer metropolitan transit systems, such as WMATA in Washington, DC, were able to leverage such technology from their inception, NYC’s MTA was forced to retrofit older existing technology and infrastructure. The introduction of the OMNY fare payment system for New York City is one of the most notable developments in the story of American public transportation. The technological developments that have led New York City to this point in fare collection have been extensive and pose a unique challenge for a city where more than 1 billion rides are made on public transit within the city limits annually. With the scale of this new payment system’s implementation comes a multitude of challenges that have to be addressed and solved both before the system is designed and before it is fully tested, proven, and completely operational. Discussions about the adoption of new technology on a systemwide scale have been made within the wider New York City community, as have how these decisions will affect the way New Yorkers pay their transit fares decades to come. But some of the most important lessons have come from how the technology has already progressed and discussions about ensuring fairness in an urban space as complicated and multifaceted as New York. How an agency balances the pros and cons of a technical update like this is the key issue that can be observed from this development and what it does for the people who actually use the transit system. Does it increase efficiency over the long run? Is it a technical burden for all those involved? Is a city like New York truly ready for a system like this? Are we able to foresee the consequences and potential shortcomings to this technology? Is OMNY being truly embraced by city leadership the way MetroCard was? These questions and the lessons we can gain from the New York City experience will set a precedent for other large cities as they move from old fare collections systems to newer ones.
Discussion Questions
[edit | edit source]● How does fare payment matter for transit users? ● Does technological change make fare payment harder or easier? ● How can transit agencies learn from the experience of MetroCard to make informed decisions on when to make updates to fare payments? ● Do you think that MetroCard was a victim of its early success and age? ● How does fare payment technology evolve further beyond contactless smartcard and smartphone based payment technologies? ● Is New York City the ideal proving ground for a system like OMNY?
Assigned Readings
[edit | edit source]Spivack, Caroline. “A Guide to OMNY, the MTA’s New MetroCard-Replacing Fare System.” Curbed NY. Curbed NY, May 22, 2019. https://ny.curbed.com/2019/5/22/18617849/nyc-subway-mta-omny-contactless-payment-system. “NYC Subway History: The Story of Fares, Tokens & Cards,” Living In | CitiHabitats.com, June 6, 2018, https://livingin.citihabitats.com/nyc-subway-history-the-story-of-fares-tokens-cards/.
“Mta.Info | Facts and Figures,” Mta.info, n.d., http://web.mta.info/nyct/facts/ffhist.htm.
References
[edit | edit source]“15C FARE STARTS; LINES FORM TO BUY TOKENS IN SUBWAYS; Half of Turnstiles Converted by Deadline -- Mechanics Work Through the Night FEW HITCHES REPORTED Quota of Disks Is Raised to 5 -- 2 Restaurants Offer to Take Them for Food FARE RISES TO 15C ON ALL CITY LINES.” The New York Times, July 25, 1953. https://www.nytimes.com/1953/07/25/archives/15c-fare-starts-lines-form-to-buy-tokens-in-subways-half-of.html.
Adam Clark Estes. “The Cursed History of NYC MetroCards.” Gizmodo. Gizmodo, October 23, 2017. https://gizmodo.com/the-cursed-history-of-nyc-metrocards-1819774428.
“Approved Fares for NYC Transit, MTA Bus, Long Island Bus and the Staten Island Railway Effective December 30, 2010.” Archive.org, 2009. https://web.archive.org/web/20101122052827/http://mta.info/mta/pdf/approved_fares.pdf
Boorstin, Robert O. “ALL OVER CITY, TRANSIT FARE TRANSITIONS MADE Of.” The New York Times, January 1, 1986. https://www.nytimes.com/1986/01/01/nyregion/all-over-city-transit-fare-transitions-made-of.html.
Cavan, Sieczkowski. “MTA Approves MetroCard, Single-Ride Fare Hike For 2015.” HuffPost Canada. HuffPost Canada, January 22, 2015. https://www.huffpost.com/entry/mta-metrocard-fare-hike_n_6525462.
“Costlier Token.” The New York Times, September 2, 1975. https://www.nytimes.com/1975/09/02/archives/costlier-token.html.
“Display Document.” Thejoekorner.com, 2011. http://www.thejoekorner.com/scripted-ticket-display.shtm?http://www.thejoekorner.com/brochures/fare-changes-2003.gif.
Donohue, Pete. “MTA Subway Fare Hike Takes Effect on Sunday, Price Rises to $2.25 per Ride.” Nydailynews.com, 2018. https://www.nydailynews.com/new-york/mta-subway-fare-hike-takes-effect-sunday-price-rises-2-25-ride-article-1.373236.
Evelly, Jeanmarie. “City’s Half-Priced MetroCard Program Continues to Expand, But Frustrations Persist.” City Limits, October 2, 2019. https://citylimits.org/2019/10/02/citys-half-priced-metrocard-program-continues-to-expand-but-frustrations-persist/.
“Expect Long Lines for Tokens.” The New York Times, November 11, 1995. https://www.nytimes.com/1995/11/11/nyregion/expect-long-lines-for-tokens.html.
Fitzsimmons, Emma G. “M.T.A. Is Raising Fares and Tolls; One Subway or Bus Ride Will Cost $2.75.” The New York Times, January 22, 2015. https://www.nytimes.com/2015/01/23/nyregion/mta-raises-fares-subways-and-buses.html.
Frost, Mary. “What’s Going on with OMNY, Public Transit’s New Fare-Payment System?” Brooklyn Eagle, August 23, 2019. https://brooklyneagle.com/articles/2019/08/23/omny-public-transits-new-fare-payment-system/.
“Half‐Fare Plan Extended To’75.” The New York Times, May 24, 1974. https://www.nytimes.com/1974/05/24/archives/halffare-plan-extended-to75-5-holidays-added.html.
https://viewing.nyc/authors/coneybeare, and Matt Coneybeare. “Check Out This Great Schematic-Style Redesign of the New York City Subway Map.” Viewing NYC. Viewing NYC, June 7, 2019. https://viewing.nyc/check-out-this-great-schematic-style-redesign-of-the-new-york-city-subway-map/.
Illson, Murray. “M.T.A. Ready for 2‐for‐1 Fare Test Tomorrow.” The New York Times, December 15, 1973. https://www.nytimes.com/1973/12/15/archives/mta-ready-for-2for1-fare-test-tomorrow.html.
“Mayors of the City of New York.” Nyc.gov. Accessed November 17, 2019. https://www1.nyc.gov/site/dcas/about/green-book-mayors-of-the-city-of-new-york.page.
Meislin, Richard J. “FARE RISES TO 75¦; TRANSIT TAX PLAN DRAWN IN ALBANY.” The New York Times, July 3, 1981. https://www.nytimes.com/1981/07/03/nyregion/fare-rises-to-75-transit-tax-plan-drawn-in-albany.html.
“MTA - News.” Archive.org, 2019. https://web.archive.org/web/20030614085656/http://www.mta.info/mta/news/public/fares/nyct.htm.
“M.T.A. Is Raising Fares and Tolls; One Subway or Bus Ride Will Cost $2.75.” The New York Times, January 22, 2015.
https://www.nytimes.com/2015/01/23/nyregion/mta-raises-fares-subways-and-buses.html.
“Mta.Info | Facts and Figures.” Mta.info, n.d. http://web.mta.info/nyct/facts/ffhist.htm.
“Mta.Info | New Fares - Effective March 3, 2013.” Archive.org, 2013.
https://web.archive.org/web/20130224131911/http://www.mta.info/nyct/fare/NewFares.htm.
Nonko, Emily. “The History of the New York City MetroCard | 6sqft.” 6sqft, November 8, 2017. https://www.6sqft.com/the-history-of-the-new-york-city-metrocard/.
“NYC Subway History: The Story of Fares, Tokens & Cards.” Living In | CitiHabitats.com, June 6, 2018. https://livingin.citihabitats.com/nyc-subway-history-the-story-of-fares-tokens-cards/.
“Old and New Commuter Fares in New York Area.” The New York Times, June 30, 1980. https://www.nytimes.com/1980/06/30/archives/old-and-new-commuter-fares-in-new-york-area.html.
Ormsbee, Brian. “A Historical Look at the New York City Subway - 100 Years Underground.” Cooperator.com, December 2004. https://cooperator.com/article/100-years-underground/full.
Prial, Frank J. “TOKEN UNCHANGED.” The New York Times, January 5, 1972. https://www.nytimes.com/1972/01/05/archives/token-unchanged-mta-also-votes-rise-in-tolls-for-bridges-and.html.
Raschke, Kurt. “A Brief History of Metrorail Fare Collection.” Ggwash.org, July 8, 2011. https://ggwash.org/view/9979/a-brief-history-of-metrorail-fare-collection.
“Report for the Three and One-Half Years Ending June 30, 1949.” HathiTrust, 2016. https://babel.hathitrust.org/cgi/pt?id=mdp.39015023094926&view=1up&seq=6.
Robinson, Douglas. “New Tokens Go on Sale in Subways.” The New York Times, January 3, 1970. https://www.nytimes.com/1970/01/03/archives/new-tokens-go-on-sale-in-subways-30cent-tokens-are-put-on-sale-at.html.
“Same Subway Token Despite Fare Increase.” The New York Times, January 2, 1984. https://www.nytimes.com/1984/01/02/nyregion/same-subway-token-despite-fare- increase.html.
Schmitt, Eric. “Transit Lines Brace for Test Of $1.15 Fare.” The New York Times, January 2, 1990. https://www.nytimes.com/1990/01/02/nyregion/transit-lines-brace-for-test-of-1.15-fare.html.
Spivack, Caroline. “A Guide to OMNY, the MTA’s New MetroCard-Replacing Fare System.” Curbed NY. Curbed NY, May 22, 2019. https://ny.curbed.com/2019/5/22/18617849/nyc-subway-mta-omny-contactless-payment-system.
Steinberg, Jacques. “That Extra Dime Is a Little to Some, a Lot to Others.” The New York Times, January 1, 1992. https://www.nytimes.com/1992/01/01/nyregion/that-extra-dime-is-a-little-to-some-a-lot-to-others.html.
“TAKING OVER 10 NASSAU BUS LINES.” The New York Times, December 28, 1972. https://www.nytimes.com/1972/12/28/archives/mta-taking-over-10-nassau-bus-lines.html.
“Variations in Fare.” Nytimes.com, 2019. https://timesmachine.nytimes.com/timesmachine/1966/07/05/82469245.html.
“Www.Nycsubway.Org: Subway FAQ: Which Lines Were Former IRT, IND, BMT.” Nycsubway.org, 2012.
https://www.nycsubway.org/wiki/Subway_FAQ:_Which_Lines_Were_Former_IRT,_IND,_BMT.
Yohana Desta. “1904 to Today: See How New York City Subway Fare Has Climbed over 111 Years.” Mashable, March 22, 2015. https://mashable.com/2015/03/22/new-york-city-subway-fare/.
Supersonic Flight Integration
Supersonic Flight Integration
[edit | edit source]This case reviews the Challenge of Integrating Supersonic Flight into American Airspace. It is the collaborative work of Alexander Merker and Farida Ibrahim, graduate students enrolled in George Mason University's Transportation Policy, Operations, and Logistics Program at the time of writing. The following casebook explores the key actors, policy challenges, and history associated with supersonic commercial flight in the context of its potential reintegration into America's national airspace. It was produced as an assignment for George Mason University's Introduction to Transportation Systems graduate course, taught by Dr. Jonathan Gifford.
Summary
[edit | edit source]In the early 2010s, interest in commercial supersonic air transport (SST) was renewed as advances in technology and an increasing demand for private and business air travel created a market niche for faster and longer-range aircraft. Supersonic air travel, that which exceeds the speed of sound, offers considerable speed advantages over subsonic flight. The Concorde, a first-generation supersonic airliner, completed air travel to London in only 2 hours, a third of the time its subsonic competitors took to complete the journey. The speed advantage of supersonic aircraft is a strong selling point in the private and business aviation market, where time-savings are a principal reason for ownership.[45]
However, allowing supersonic aircraft to fly at their intended speeds in American airspace poses the same challenges it did over half a century ago when the first wave of supersonic airliners was in active development. The most significant regulatory barrier to supersonic aircraft is a Federal Aviation Administration ban on overland supersonic flight by civil aircraft in American airspace, which was enacted during the first wave of supersonic airliners in 1973.[46] This ban and the public perceptions behind it remain a barrier to integration of such air travel into American airspace, with additional concerns regarding the environmental impact of the pollution generated by these aircraft contributing to public perception issues.[47]
Annotated List of Actors
[edit | edit source]Aerospace Manufacturers
[edit | edit source]- Boom Technology
- Aerion Supersonic
- Spike Aerospace
- The Boeing Company
- Lockheed Martin
Federal Aviation Administration
[edit | edit source]- Responsible for the regulation and oversight of airspace in the United States, the FAA establishes rules relating to supersonic flight in American airspace
National Aeronautics and Space Administration
[edit | edit source]- NASA provides research into the effects of supersonic flight, in addition to developing sonic boom dampening technologies
Environmental Groups
[edit | edit source]- The Anti-Concorde Project
- International Council on Clean Transport
International Civil Aviation Organization
[edit | edit source]- United Nations body responsible for maintaining international standards for air travel
Timeline of Events
[edit | edit source]1962: The British and French merge their development efforts and the Concorde Project begins
1963: Development of the Soviet Tu-144 begins
1967: The American SST Program selects the Boeing 2707 as its production design
1971: The American SST Program is cancelled
1973: The Federal Aviation Administration bans all civil aircraft from exceeding Mach 1 over land in American airspace
1975: The Tu-144 enters regularly scheduled service
1976: Concord begins regularly scheduled service
1983: The Tu-144 is retired from service
2003: British Airways and Air France retire the Concorde
2006: NASA begins its Quiet Spike sonic boom mitigation test program
2018: NASA begins construction of the QueSST Supersonic Demonstrator
2018: The Federal Aviation Administration (FAA) implements the Reauthorization act of 2018 which grants the Federal Aviation Administration (FAA) the power and authority to establish new federal and international policies to regulate and certify safe and efficient civil supersonic aircraft operations.
2020: Expected first flight of the Boom Technologies XB-1 Supersonic Demonstrator
2021: Expected first flight of NASA’s X-59 QueSST Supersonic Demonstrator
2023: Intended date of first flight for the Aerion AS-2 Supersonic Business Jet
Maps of Locations
[edit | edit source]
A Map of Concorde's Flight Path
Policy Issues
[edit | edit source]Noise Concerns
[edit | edit source]The primary regulatory concern involving supersonic aircraft is their trademark sonic boom. The sonic boom can be defined as “a shock wave of pressure created by compression of sound waves as the air is displaced by the air-frame traveling at or above Mach 1”.[48] This shock wave of pressure results in a large ‘boom’ that are often compared to the clap of thunder. It is for this reason, that public pressure on the federal government was high in regards to the sonic booms created by aircraft travelling faster than Mach 1. The public skepticism surrounding supersonic flight was fueled by the belief that supersonic aircraft would be detrimental to public health and damaging to property. As a result, the federal government amended the existing Federal Aviation Act of 1958 to include a section that gave the Federal Aviation Authority (FAA) the capacity to extend already set noise standards of civil subsonic aircraft to supersonic civil airliners. As a result, the Control and Abatement of Aircraft Noise and Sonic Boom Act of 1968 was implemented.[49] However, in 1973 the Federal Aviation Authority issued a ban on all civil air travel exceeding the sound barrier (Mach 1) over land in American airspace. To date, this ban remains the largest policy barrier for commercial supersonic aircraft in the United States. This is largely because it limits the capacity of supersonic airliners to service a large surface area and to expand its routes.

Studies into the subject of the sonic boom and the impact on health and property have yielded a an uncertain measurement of the impact of sonic boom pressure shock waves on the general population. As far back as the 1950s, studies have found that the impact of sonic booms is heavily dependent on factors such as aircraft altitude, atmospheric conditions and body shape.[50] The most physical aspect of sonic booms, its characteristic pressure shock wave, was found by NASA to have been at a measurement 1.94 psf for the Concorde under normal flight conditions. This is at the cusp of the 2-5psf, what NASA categorizes as “Rare minor damage”, and above the 1.0 psf where public reaction is seen. However, the perceived impact of sonic boom in the form of shattered windows and other structural damage, has not been found to occur below 11 psf.[50]
However, the opposing opinions on the effects of the supersonic aircraft have led to numerous debates between policy makers and supersonic flight proponents. This has resulted in continued dialogue between supersonic aircraft manufacturers and government agencies, such as the International Civil Aviation Organization (ICAO). Since the ban in 1973, stakeholders within the aerospace industry and NASA have worked to develop a better understanding of sonic boom and solutions for mitigation. Examples of this include NASA's Quiet Spike test bed.[51]
With the resurgence of interest in supersonic transport technology, a renewed effort against the technology has emerged as well. In a series of announcements, the FAA pledged to acknowledge the technological differences between supersonic and subsonic aircraft and take it into consideration when assessing noise requirements.[52] This was a significant achievement for the technology, showing both maturity in sonic boom mitigation developments, as well as changing perspectives on its impacts.
So far, dialogue between supersonic aviation and policy makers have remained open and productive as agencies such as the FAA have expressed willingness to modify current policies if supersonic airliners are able to achieve a sound level comparable to that of their subsonic counterparts.[53] This signifies a shift in trends among policy makers as the FAA has shown willingness to revisit the issue and possibly lift the ban if provided with adequate research to support the stance that supersonic airliners will not be damaging to physical property, the environment, or the human body.
In 2019, the International Council on Clean Transport, an environmental advocacy organization focusing on transportation, produced a report outlining the potential environmental impacts of this technology under current fleet projections made my potential manufacturers.[54] This report concluded that regions under the most traveled supersonic flight paths might experience sonic booms up to 200 times a day. The United States, United Kingdom and United Arab Emirates were expected to be the most traversed of all counties in this projected scenario for 2035.
Research into this topic continues at the same time NASA and the FAA work towards re-defining the standards for overland supersonic flight and an end to the ban on such air travel.[55] One of the goals of NASA’s X-59 supersonic technology demonstrator is to build a supersonic aircraft that produces a reduced overland sonic boom. As a result, the X-59 has been marketed as a quieter supersonic aircraft with a mission to elicit public feedback on the impact of the modified produced for the purposes of reopening U.S. airspace to supersonic flight.[56]
Environmental Concerns
[edit | edit source]Rising concerns over climate change have resulted in an increasingly environmentally conscious society. As a result, environmental groups stand in opposition to the reintegration of supersonic transports into the national airspace. In addition to concerns over the impact of sonic booms, another concern for environmental groups are the emissions created by these aircraft which could potentially deplete the stratospheric ozone layer.[57]
A 1966 scientific study by the American National Academy of Sciences confirmed that exhaust emissions released from supersonic jetliners are harmful to the stratosphere and could contribute to climate change. The research showed that “a five-fold increase in the amount of water vapor would lead to a two degree Celsius increase in surface temperatures”.[58] A 2019 study on the carbon emissions impact of supersonic commercial aviation found that it would contribute to a substantial increase in such emissions.[59]
In addition, a 1972 report by future Nobel Laureate Paul Crutzen, also found that nitrous oxide emissions from supersonic transport engines might have a significant impact on ozone depletion.[60] This study was used as the basis for environmental agreements made by anti-SST organizations such as the Anti-Concord Project.[61] Crutzen's work on ozone depletion would eventually lead to research which was crucial to the understanding of the human influence on climate change, for which he won a Nobel Prize.[62]
More recently, a 2019 ICCT report on the environmental impacts of supersonic commercial aviation found that it would contribute to a substantial increase in carbon emissions.[63] The study determined that a hypothetical global fleet of 2000 supersonic aircraft (as proposed by proponents of the technology) would emit a carbon footprint equivalent to 59% of the combined fleets of all American air carriers in 2017.
The issue of carbon footprint is a growing area of concern for the technology, as governments and airlines take increasingly aggressive measures to reduce carbon emissions in air travel. In 216, the United Nations body responsible for international aviation standards, The International Civil Aviation Organization, set in place a carbon emissions reduction program for international air travel.[64] These strict standards are likely to conflict with the reintegration of commercial supersonic aircraft, though developers of the technology like Boom Technologies have claimed that their use of bio fuels over kerosene will have an mitigating effect on their carbon emissions, with its XB-1 test aircraft being "..history’s first zero net carbon footprint on a supersonic flight,".[65]
Narrative of the Case
[edit | edit source]The First Wave of SST Development
[edit | edit source]In the early 1960s, airlines and aerospace manufacturers believed that the future of air travel would be through supersonic aircraft. Seeking to gain an advantage in an advantage for both their manufacturers and airlines, the United Kingdom, France, Soviet Union and the United States invested in programs to develop and produce supersonic airliners.[66] The United Kingdom and France quickly merged their efforts, developing a partnership to build the Anglo-French Concorde.[67] The United States, with a large manufacturing base to draw upon, selected two competing designs for further government investment in what was known simply as the SST Program.[68] The Soviets utilized their Tupolev design bureau to develop their supersonic transport, the Tu-144.[69]

In 1964 the Federal Aviation Administration (FAA) authorized a series of tests flights to be carried out in Oklahoma City. The purpose of these tests were to measure the effects of supersonic booms on the environment and also what physical effects it would have on civilians on the ground.[70] These experiments were controversial as it was during this phase, that residents concentrated within these areas began to raise concerns about the loudness of supersonic engines and the damage it was doing to their property.[71] Many people submitted claims to the government requesting compensation for broken windows, cracked tiles and other damage to physical property. In addition, there were also numerous complaints regarding the noise levels and the associated thunder claps. These experiences contributed heavily to the formation of public opinion as the experiences of individuals within this city continued to spread across the United States influencing the ideas and opinions about supersonic flight. By 1966, The Anti-Concorde project was formed to counterbalance the claims of the aerospace industry about the technical and economic viability of the Concorde program. This created the opportunity for people who shared similar views, to rally together collectively bargain against the Concorde. It became one of the most predominant groups in opposition to supersonic air travel, as it assembled a group of experts to publish information regarding the extensive fuel consumption, and sonic booms that would result from supersonic airliners.[61] The project would also publicize the facts about the economics of Concorde; that the plane could not be operated at a profit, and that the research and development costs, funded entirely with taxpayer's money, would never be recovered.[72] The anti-Concorde project used this information to lobby against the aerospace industry to end all supersonic transport projects on economic and environmental grounds.
Facing both intense scrutiny for its environmental impacts and a transition by American air carriers to high-capacity subsonic aircraft, the United States cancelled its supersonic airliner program (SST) in 1971 before a prototype could fly.[73] Boeing, the winner of the design competition for the SST program, was forced to lay off more than 60,000 employees as a result of the program’s cancellation.[74] Shortly after the end of the SST Program, the Federal Aviation Administration would ban all overland supersonic flight by civil (non-federal) aircraft in 1973.[75] The ban remains in place to this day.[76]
The Anglo-French Concorde and Soviet Tu-144 projects continued despite challenges in public perception and airline economics. The Concorde and Tu-144 entered full commercial service in the mid-1970s, achieving the project goals. However, they still faced challenges. The Tu-144, which suffered a fatal crash on the world stage at the 1971 Paris Airshow, was found to be ill-suited for passenger air travel due to high internal noise levels and serious reliability issues.[77] As a result, the Soviet Union retired the Tu-144 from commercial airline service less than a decade later in 1983.
After the retirement of the Tu-144, the Anglo-French Concorde maintained its status as the only active commercial supersonic aircraft despite challenges involving public perception and the economic viability of the project. The Concorde fared far better than the Tu-144, remaining in service until 2003. Serving the national flagship carriers of the United Kingdom (British Airways) and France (Air France), fourteen Concorde's provided transatlantic supersonic air travel between their national capitols and New York City.[78] The Concorde was not the commercial success it was intended to be though. The economics of operating the fuel inefficient aircraft, which sat only 100 passengers, were compounded by bans on overland supersonic travel that eliminated all but one destination outside of Europe.[79] In comparison, the Concorde’s subsonic competitor Boeing 747 sat 660 passengers and consumed half the amount of aviation fuel during an equivalent flight between New York and London.[80] By the 2000s, increasing costs of fuel and maintenance led to the retirement of the aircraft from both fleets, bringing an end to supersonic commercial air travel.
Continuing Investment in SST Technology
[edit | edit source]
Despite the cancellation of the American SST Program, supersonic aircraft testing and research was not abandoned entirely in the United States. NASA continued to study potential evolutions of the design and made notable contributions to the cause by offering potential solutions to the design challenges that led to the cancellation of the SST.[81] NASA, through its research, continued to influence supersonic transport development and remained a fundamental contributor to the study of supersonic flight. This included a partnership with its Russian counterparts in 1996 for continued supersonic transport development, retrofitting a Tu-144 for test flights that were conducted through 1999.[82] More recently, NASA studied supersonic boom mitigation through Quiet Spike Program, which mounted a modified nosecone to an F-15B aircraft to test experimental structural solutions to the issue.[51]
The Second Wave of SST Development
[edit | edit source]Currently, in response to renewed business interest in such aircraft, NASA is in the final development stages of the X-59 Quiet Supersonic Transport experiment aircraft that will demonstrate new technologies and design methods for civilian supersonic aircraft.[83] The overall goal of this program is to develop sonic boom dampening technologies that will allow for a return to overland supersonic travel.
Outside of government initiatives into this technology, private industry has taken a strong interest in the prospects of supersonic air travel for private and business aviation. In these markets, where time savings are the commodity being purchased, the benefits of supersonic air travel are clear over current aircraft. The current fastest business aircraft, the Cessna Citation X+, has a top speed of Mach 0.935, just below the sound barrier.[84] Aerospace startups Boom Technologies and Aerion Supersonic believe that their in-development supersonic business jets will fill this market niche.[85]

The first tests of new supersonic transport demonstrator aircraft are expected to take place in the early 2020s. The NASA developed and Lockheed Martin produced X-59 is scheduled for its first flights in 2021, while the Boom Technologies XB-1 is expected to fly in 2020.[86] [87] Meanwhile, Aerion Supersonic intends to produce and fly its AS-2 supersonic business jet by 2023, forgoing the process of developing a demonstrator entirely.[88] All of these designs, with the exception of the X-59, will depend upon a repeal of the overland supersonic flight ban before they can enter the market.
Federal regulators are presently optimistic of a near-future repeal of the supersonic test ban. The FAA is currently in the process of developing standards for overland supersonic flight, though they would not outright repeal the ban.[89] This rule-making process would create a noise certification process through which manufacturers would need to seek approval for designs under yet to be determined noise standards. The data collected through the X-59 program will be used in the development of these standards. Additionally, the FAA is working to develop a streamlined approval process for supersonic flight authorization, which would allow pilots to legally fly pass the speed of sound.[90] The FAA expects that these two regulatory changes would allow for commercial supersonic flight without repealing the overland ban, instead providing a process through explicit authorization for such flight activities. This is, in essence, an indirect repeal of the overland supersonic ban.
Outside of the United States, there is at least one other program to develop a supersonic transport aircraft. In Japan, the Next Generation Supersonic Transport program has been in active development since 2006.[91] This project, financed by the Japan Aerospace Exploration Agency (JAXA), intends to ultimately produce a supersonic aircraft which will seat up to 50 passengers. If this program were to succeed in producing a commercial aircraft by 2030, it would almost certainly fly through American airspace.
Lessons learned
[edit | edit source]Going forward, it is fundamental to acknowledge the importance of public perception and its influence on guiding public policy. The regulatory obstacles were due in large part due to public perceptions of the impact of supersonic aircraft, many of which did not align with research into the subject. A barrier to the reintegration of supersonic flight into American air space remains the regulatory policies that prohibit supersonic airliners from flying over land. These existing regulatory policies hinder the success of supersonic airliners by limiting their hide speed transit to specific trans-oceanic routes. It is evident from past experience that without public approval supersonic air travel would have limited mainstream success. This case study is an excellent example of how the development of technologies can be affected by politics and public discourse. In the instance of this technology, a stagnation in innovation was not the reason for its demise, but rather the misinformed opinions of the voting public that resulted in regulatory action. At the moment, this regulatory action remains a barrier for the revival of this technology, and the public perceptions which led to it have forced innovators to respond to these beliefs with investments in noise reduction technologies.
In addition to the regulatory barriers that remain in place, the process of removing such barriers will likely run afoul of environmental groups and those ambivalent about aircraft noise and the effects of sonic booms. In the 1960s, the chorus of concerns for both emissions impacts and noise issues played a very prominent role in the creation of the regulatory barriers that exist today. Both manufacturers and users of these aircraft will need to address these concerns as the make their case for an indirect deregulation of the FAA’s overland supersonic flight restrictions. These issues are already present in the national conversation for conventional commercial aviation, with “Flight Shaming” over the emissions of air travel currently gaining popularity in Europe and noise complaints surging as the FAA implements its “NextGen” air traffic management system.[92] [93]
While both technical and public perception barriers exist for the reintegration of these aircraft into the national airspace, it is clear that the FAA and Department of Transportation are in support of loosening restrictions. Though there is a groundswell of investment of these aircraft, and a perceived business case for their revival, eliminating regulatory barriers is the most fundamental requirement for their viability in the American market. The clear interest shown by the FAA and Department of Transportation are therefore crucial indicators of the likelihood of success in both reintegrating these aircraft into U.S. airspace, as well as their business viability. Reintegration will of course also rely on continued mitigation efforts in noise and environmental impact, two of the two biggest points of contention for the technology's detractors. As covered in this case study, both government and industry are in the process of developing mitigation techniques for both, and this will likely be one the of biggest cases for loosening restrictions and successful reintegration. Therefore, it can be assessed that there is a high likelihood that reintegration efforts will be successful and commercial supersonic aircraft will fly in American skies in due time.
Discussion Questions
[edit | edit source]- To what extent should public perceptions of technologies be taken into account by policy makers?
- How much should environmental concerns be weighed against the potential economic benefits of a transportation technology?
- Are there any other examples of technologies whose development was curtailed due to environmental concerns?
- Given the evidence put forth in this case book, do you believe the overland supersonic flight ban should be repealed?
Assigned Readings
[edit | edit source]GMU Mercatus Center: Make America Boom Again: How to Bring Back Supersonic Transport (2016, 39 Pages)
The Heritage Foundation: It’s Time to Let Supersonic Flight Soar Again (2018, Web)
Aerospace America: Supersonic’s not-so-super emissions (2019, Web)
Congressional Research Service: Supersonic Passenger Flights (2018, 18 Pages)
International Council on Clean Transport: Noise and climate impacts of an unconstrained commercial supersonic network (2019, 15 Pages)
References
[edit | edit source]
Micro-mobility
Summary
[edit | edit source]Micro-mobility platforms are small, human and electric-powered pieces of transportation equipment such as bikes, scooters, and similar (e.g. skateboards, segway) that operate at fairly low speeds of no more than 20–25 mph. Companies offering micro-mobility services typically make them available for short-duration rental after which time, these platforms are stored in the public right of way.[94][95] Micro-mobility has become a distinct movement within the broader transportation trend towards new mobility services, which began with the 2009 advent of smartphone-enabled ride hailing services like Uber and the introduction of station-based bikesharing businesses between the early 2000s to roughly 2015. More recent dockless systems are an evolution of the station-based bikeshare and smartphone-enabled ride haling models. Dockless micro-mobility platforms began arriving in U.S. metropolitan areas in 2017, and 2018 saw large growth in deployment of dockless electrified systems. Analysts anticipate this trend has the potential to continue quick growth and may have a large impact on urban transportation.[96] Given the potential impact, municipal governments and the public sector are likely to be required to further analyze this trend, determine additional policy, and plan for incorporating more micro-mobility technologies into urban landscapes.
In the Washington D.C. metropolitan area, Metrorail transports passengers from suburban areas from as far as 20 miles to the urban center surrounding the National Mall. Though Metrorail stations are typically placed within a half mile of each other, many destinations of interest are located beyond walking distance of those stations. Micro-mobility services have disrupted the traditional first and last-mile modes on these trips, and also offer a single mode for one-way point to point trips within the urban center. A large majority of urban trips are below 3 miles, and micro-mobility is finding a niche in that space.
Annotated List of Actors
[edit | edit source]- Private Corporations
- Lime - U.S. dockless scooter and bikesharing startup company based in San Mateo California founded in 2017.[97]
- Spin - U.S. dockless scooter and bikesharing startup company based in San Fransciso founded in 2016.[98]
- Motivate - U.S. station-based bikesharing company based in New York established in 2012 in Portland, OR as Alta Bicycle Share. Operates Capitol Bikeshare in Washington, D.C. Motivate was acquired by Lyft in June of 2018.[99]
- Jump Bikes - U.S. dockless e-bikesharing company headquartered in New York, NY (formerly station-based bikesharing company SocialBike launched in 2010), acquired by Uber in April of 2018.[100]
- Bird - Santa Monica based dockless scooter-sharing startup founded in 2017 by a former Uber and Lyft executive.[101]
- Skip - San Francisco based startup dockless scooter-sharing founded in 2018.[102]
- U.S. municipalities, including but not limited to:
- San Francisco
- Austin
- Santa Monica
- New York
- Boston
- Chicago
- Atlanta
- Denver
- Seattle
- Los Angeles
- San Jose
- Greater Washington DC Area
- Arlington County, VA
- City of Alexandria, VA
- Fairfax County, VA
- Washington DC
- City Council
- District Department of Transportation (DDOT)
- District Department of Energy and Environment (DOEE)
- Washington Metropolitan Area Transit Authority (WMATA)
- Nation Association of City Transportation Officials (NACTO)
- Community-based development organizations and NGOs
Timeline of Events
[edit | edit source]- Early 2000s – 2006 station-based bikesharing schemes begin to launch at small scale internationally[103]
- 2007 larger scale deployment including Paris’ launch of Vélib
- 2010 station-based bikeshares launch in U.S., including Capital Bikeshare in Washington, D.C.
- 2014 dockless bikesharing catches on in China[104]
- August 2018 Chinese based firm Ofo scales back operations and laying off U.S. employees
- Sept 2017: DDOT explores dockless vehicle options for D.C.
- Sept 2018: Regulatory framework proposed by DDOT, Phase I extended (DDOT 2018)
- Fall 2018: 300 additional racks (600 total) to be installed throughout D.C.
- Dec 2018: Planned end of pilot period (DDOT 2018)
- Jan 2019: DDOT to issue new permits to service providers under revised regulations (DDOT 2018)
Maps of Locations
[edit | edit source]Policy Issues
[edit | edit source]- Concerns over safety and integrity of public space (DDOT 2018)
- Regulatory framework to include guidance (DDOT 2018):
- Equipment and operation standards
- Coverage in all eight wards (equity)
- Data sharing requirements
- Program fees to cover public administration and space management costs
- Performance bonds and enforcement mechanisms
- Sustainability and waste at end of equipment life (see china’s bikeshare graveyards)
- Safety while sharing public right of way with traditional vehicles – speed limit policy
- Impact on transportation system emissions
- Capacity limits
- Transit system planning
Narrative of Case
[edit | edit source]Although the concept of bikesharing dates back well into the middle of the 20th century, deployment of limited bikesharing systems did not begin to gain momentum until the 1990s.[105] Further adoption was sporadic until the middle of the 2000s, when station-based services began emerging in cities across Europe, North America, and China. By the end of 2010, station-based bikesharing services were a common feature in major international metropolitan areas, and have since continued to grow.
It took approximately seven years of concurrent development for smartphone-enabled on-demand transportation services like Uber and bikesharing models to combine, but in 2017 and 2018 an influx of private investment helped launch numerous dockless micro-mobility startup businesses across the U.S.[106] Washington, D.C. was the site of early adoption of each of these innovations.
In the Washington D.C. metropolitan area, Metrorail transports passengers from suburban areas from as far as 20 miles to the urban center surrounding the National Mall. Though Metrorail stations are typically placed within a half mile of each other, many destinations of interest are located beyond walking distance of those stations. Riders would traditionally rely on taxis or buses for the final mile of their trips. Micro-mobility services have opened up a whole new level of personalized transportation options for residents of urban areas where systems using shared electric bikes and scooters have been deployed. Shared assets governed by D.C.’s Dockless Vehicle Program have greatly enhanced mobility within the District, not only as a supplement to heavy rail or bus trips, but also as the sole mode for many cross-town journeys. A 2018 study by VA Tech determined that the most common motivation for both dockless and docked bikeshare use was to get around faster and easier (88% of CaBi users). Less common was the practice of using the bike to get to other modes of transportation (54% for CaBi).[107]
With the exception of folding bicycles, personal bicycles are only allowed on Metrorail during off-peak hours. Therefore riders using Metrorail for morning and evening commutes need to get to their final destination (if beyond walking distance) through a mode which is present in the terminal vicinity. Buses offered the most economic option, traditionally, with taxis or later Uber drivers offering a more expensive, but often quicker option. CaBi was the first to introduce a low-cost Personal Transportation Device (PTD) for relatively short one-way trips. A 2018 study conducted by VA Tech determined that riders of CaBi tended to be regular commuters, with little variation in time of day or routes chosen. CaBi riders were also found to be more regular riders than dockless bikeshare users, reporting six trips per month compared to 1–2.[108] The public advantage of the CaBi docked bicycles is that they are not scattered throughout the landscape, creating an eyesore, and are easily located by riders in established collection points. The disadvantage of a human-powered bicycle, however, was that a rider must exert considerable effort (and perspiration) which may not be desirable while dressed in business attire. Riders are also limited by the power of their legs, making mechanical bicycles a relatively slow option.
When electric-assisted bicycles or (e-bikes) were introduced, they offered a faster option, easily sustaining speeds of 20mph. As a dockless system, the bikes were found scattered throughout communities, often in odd places. This made it somewhat unreliable as a transportation mode, as riders could not count on finding a bike in any particular location. A problem for the service provider is that of charging. Trucks need to be dispatched to collect and charge the bikes as their batteries are depleted. Bird, an electric scooter company, has solved this problem by providing users an opportunity to earn money by taking the scooters to their residence and charging them overnight (coordinated through the smartphone application). Users embark on a sort of scavenger hunt to find the scooters in the evening, with the most depleted being significantly more valuable, and earn up to $20 per scooter after returning them to a Bird “Nest” by 7:00 am.
Electric scooters have several advantages over bikes in that they require virtually no effort, can be ridden by women in skirts, or men with messenger bags or other garments/accessories which may otherwise impede the ability to pedal. For both dockless bikes and scooters, DDOT has recognized the need to discourage riders from leaving the PTDs in areas which block pedestrian traffic or otherwise take away from the visual enjoyment of the landscape. New regulations which are expected to go into effect in December, 2018, will require them to be secured to something when not in use. This will not prevent them from being a scattered eyesore along thoroughfares, but it will prevent them from being left in open spaces. Safety is a concern as these devices are integrated into existing traffic. Scooters are not allowed on sidewalks in D.C., as these nearly silent scooters travelling 20 mph pose a significant risk to pedestrians at a walking pace. The scooters are forced onto the streets, where riders are expected to wear helmets and any other appropriate personal protective equipment (PPE) as would be typically used by cyclists: goggles, gloves, reflective clothing. However, few scooter riders seem to be taking this seriously. Riders are often seen in dark-colored business attire, with no PPE, and little regard for their lack of visibility by drivers of automobiles.
According to some surveying, the public perception of micro-mobility deployment appears to be favorable by a majority of approximately 70 percent favoring with 30 percent unfavorable.[109]
Conclusion: the proliferation of PTDs in D.C. has provided urban travelers with a low-cost, flexible option for short trips (under 3 miles) and last-mile connections from other modes. The physical presence of the bikes and scooters has forced DDOT to implement policies which provide for safety of users and pedestrians and preservation of aesthetics. Riders are not afforded the same level of safety and security as when riding in a car, bus or train, but that is not preventing growth in micro-mobility. Indeed, if San Francisco is any indicator, where a 2018 announcement for 5 e-scooter permits was met with proposals from 12 entities, growth seems likely to rise sharply.[110] The primary motivation for using micro-mobility is that it is the fastest way to navigate a dense urban environment on trips less than three miles. Low-income inner-city riders have not yet embraced the technology, and continue to rely on buses or walking for local trips.
Lessons Learned
[edit | edit source]- Docked bikes are most often used during peak commuting hours by a demographic which reports having at least a Bachelor’s Degree and makes in excess of $100,000 per year.[111]
- Dockless scooters tend to crowd public spaces and block walkways.
- DDOT is requiring unattended scooters to be locked to prevent them from being left in open areas.
- Scooters are not compatible with pedestrian traffic.
- Riding scooters on public roads may be a more hazardous activity than riding bicycles, which are more visible and capable of traversing larger obstacles.
- Users are required to bring their own PPE, however few do, and several fatalities have resulted.
- There is a risk of oversupply of services and equipment.
- Service providing companies are engaging in aggressive competitive behavior with public policy implications, particularly with regard to legislation.
- The rise of dockless micro-mobility is a result of the convergence of technologies leading to innovation.
Discussions Questions
[edit | edit source]- What level of regulatory oversight should cities provide to ensure the safety of micro-mobility riders and pedestrians?
- Does the presence of dockless PTDs detract from the architectural the aesthetics of city landscapes, e.g., in Washington, D.C. the National Mall?
- Are high-speed scooters and electronic-assisted bicycles compatible with human-powered cycles or vehicular traffic?
- Why are bikeshare programs under-utilized by low-income residents with no other mode available?
- How can cities transfer the costs of the additional public administration workload to the service providers?
- Is micro-mobility a passing venture-capital-inspired bubble?
- What is the likely impact on city transit systems and ridership?
Further Reading
[edit | edit source]- Populus Technologies. “The Micro-mobility Revolution: The Introduction and Adoption of Electric Scooters in the United States.” 2018. https://www.populus.ai/micro-mobility-2018-july
- Transportation Officials. "NACTO Policy 2018 Guidelines for the Regulation and Management of Shared Active Transportation." July 2018. https://nacto.org/wp-content/uploads/2018/07/NACTO-Shared-Active-Transportation-Guidelines.pdf
- Virginia Tech and the District Department of Transportation. "D.C. Dockless Bike Share: A First Look." Spring 2018. https://ralphbu.files.wordpress.com/2018/05/dc-dockless-bikeshare_a-first-look_may_10_2018_publication.pdf
- The Economist. "How bike-sharing conquered the world." December 2017. Beijing. https://www.economist.com/christmas-specials/2017/12/19/how-bike-sharing-conquered-the-world
List of Works Referenced
[edit | edit source]
Airport Passenger Facility Charges
Overview
[edit | edit source]The Federal Aviation Administration (FAA), as mandated by the Aviation Safety and Capacity Expansion Act, implemented a passenger facility charge (PFC) in 1990. Under this Act, airline tickets included a fee of $3 per flight, with a cap of $12 round trip. These funds in turn support FAA approved airport infrastructure projects. In 2000, Congress increased PFCs to $4.50 per flight, with a cap of $18 round trip, and the fee has since remained at these levels.
PFCs were initially established to help the country’s ailing airport infrastructure. At the time, both airports and airlines were in bad economic shape, and it is estimated that the airline industry was $35 billion in debt. In 1978, President Jimmy Carter deregulated the airline industry, which some believed attributed to decline of the airline industry. Others attribute the decline to the airlines overextending themselves and making significant fleet investments that did not provide a return on investment.[114] Regardless, the Executive and Legislative branch both agreed that the airline industry could not be relied upon to provide funding to improve airport infrastructure. PFCs provided a way to raise revenue, while only charging the users of the system.[115]
PFC funded projects fall into four broad categories: airside, landside, noise, and access. Nearly half of airside funding, supports runway investments and nearly all landside funding supports terminal improvements.
In addition to support from local and state authorities and the PFC program, there are two alternative ways airports receive funding from the U.S. government:
- Airport Improvement Program (AIP) - A Federal grant program which targets aircraft operations, and airports planning and development.
- Investors preferential income tax - Provides investors preferential treatment on income generated by airport improvement projects.[116]
A benefit of the PFC program, in comparison to AIP and investor preferential income tax, is that the program allows for flexibility on how the funds are used. PFCs can fund FAA approved airport transit, noise mitigation, and terminal improvement projects. Airports have the discretion to use PFC funds to meet their needs; however, PFCs cannot be used for income generating projects (i.e. terminal food concession or airport parking garages).[117] Overall, the PFC program is thought to be more flexible, in comparison to more prescriptive programs like AIP and investor preferential income tax.
In 1992, the first year PFC’s were first collected, over $85 million was collected . By 2017, the FAA collected $3.2 billion.[118] The PFC program has significantly grown in the past two decades. Accounting for inflation, $85 million in 2017 dollars equates to over $161 million.
The below graph depicts air passengers carried in the United States, from 1990-2017, the same time period PFCs have been in effect. According to the International Civil Aviation Organization, in 1990 there were nearly 465 million air passengers in the United States. There are two significant downturns in the number of passenger. The first downturn followed the events from September 11, 2011. During this time, most Americans avoided air travel out of fear. The second downturn was during the 2008 Recession, as Americans avoided unnecessary expenses, such as air travel. By 2017, passenger traffic climbed to 849 million travelers in the United States.[119]
Annotated List of Actors
[edit | edit source]Actors for the Increase in PFCs
[edit | edit source]American Association of Airport Executives - An association representing airport management personnel at public-use and general aviation airports.[120]
Airports Council International North America - Pursues airports interest in international organizations, such as the International Civil Aviation Organization.
Senator Susan Collins - Republican from Maine, chairs the Transportation, Housing, and Urban Development Appropriations subcommittee.
Congressman Bill Shuster - Republican from Pennsylvania, chairs the House Transportation and Infrastructure Committee.
Senator John Thune - Republican from South Dakota, Chairman of the Senate Commerce, Science, and Transportation Committee.
Congressman Peter DeFazio - Democrat from Oregon, Ranking Member on the House Transportation and Infrastructure Committee.
Actors Against the Increase in PFCs
[edit | edit source]Airlines for America - An association comprised of the largest U.S. flagged carriers that advocate for America’s airlines as models of safety, customer service, and environmental responsibility.[121]
Taxpayer Associations - Associations such as Americans for Tax Reform and National Taxpayers Union view an increase in PFCs as an additional tax.
Government Actors
[edit | edit source]Federal Aviation Administration - An operating administration of the U.S. Department of Transportation whose mission is to provide the safest, most efficient aerospace system in the world.[122]
Timeline of Events
[edit | edit source]1990 - Aviation Safety and Capacity Expansion Act of 1990
- Established the PFC program, at a rate of $3 per flight.
1994 - Federal Aviation Administration Authorization Act of 1994
- Mandated the Secretary of Transportation to review the effectiveness of the PFC program.
1995 - GAO Report on Airport Improvement Program, Update of Allocation of Funds and Passenger Facility Charges, 1992-94
- Provides information on the funds collected by the airports from 1992 - 1994 and the projects funded with PFCs.[123]
2000 - Wendell H. Ford Aviation Investment and Reform Act for the 21st Century
- President Clinton signed this Act that allows for modifications to the PFC program, allowing the FAA to increase the PFC to $4 or $4.50.[124]
2007 - FAA Reauthorization Act of 2007
- Reduced some limitations on the use of PFC funds[125]
2012 - FAA Modernization and Reform Act of 2012
- Authorized non-hub small airports to collect PFCs, and required GAO to study alternative ways PFCs could be collected.
2014 - GAO Releases Study “Raising Passenger Facility Charges Would Increase Airport Funding, but Other Effects Less Certain”
- GAO was asked to conduct study after airports wanted to raise the PFC ceiling to $8.50.
2018 - FAA Reauthorization Act of 2018
- Removes certain restrictions on the use of funds generated by PFC.
Origins
[edit | edit source]The Aviation Safety and Capacity Expansion Act of 1990 allowed the Secretary of Transportation to authorize public agencies that control commercial airports to impose a PFC charge on each paying passenger boarding an aircraft at their airports to supplement their AIP grants. The intent of the PFC program was to further airport development that preserves or enhances airports’ safety, security, capacity, reduces noise generated by airport activities, or enhances airline competition.
Continuous airport improvement projects are crucial to reducing airport congestion. Flight delays due to congestion have a significant economic and environmental impact. In 2007, the FAA reported that airport congestion, and the resulting delays, cost the airlines and passengers $40 billion.[126] The FAA requires airlines to track their delays, which is defined as arriving 15 minutes later than the scheduled time. Using these statistics, the FAA compiles reports to analyze the root cause of delays. In 2015, 18.9% of total domestic flights were delayed. The third leading cause for these delays are due to the national aviation system, which includes runway closures and heavy traffic.[127]
The below graph depicts total PFC collections from 1990 through 2017. This data, obtained from the FAA, shows one significant downturn in revenue during the 2008 Great Recession. Even after the events of September 11, 2001, airport PFC’s revenue modestly increased by $28 million. Taking into consideration the 2008 downturn, PFC collections have, on average, increased, reaching $3.2 billion in 2017.
Policy Issues
[edit | edit source]PFC Ceiling
[edit | edit source]Under current law, airport operators can impose a charge of up to $4.50 on each ticket. Most airports charge $4.50, although they must demonstrate to the FAA that the project they are funding will make significant improvements to air safety, increase competition, or reduce congestion or noise impact on the community.
Airlines have opposed any increase in the PFC ceiling, claiming that raising or eliminating the cap would decrease air travel, as the charge would make people less likely to fly with an increased cost. Airport operators and other supporters of PFC’s have favored raising the cap to $8.50, or in some cases, eliminating the cap altogether. They claim that airports are unable to undertake all the necessary upgrades to make flying a better experience for passengers, as $4.50 does not bring in enough revenue. The Senate FY19 Transportation, Housing, and Urban Development (THUD) legislation included a provision that would increase the PFC ceiling to $8.50, but this was not included in H.R. 302, the FAA Reauthorization Act of 2018.
Americans for Tax Reforms, a leading conservative U.S. taxpayer advocacy group, believe airports can finance construction and other improvement projects without raising the airport PFC limit. This organization highlights an $8.5 billion improvement project at Chicago O’Hare International Airport. O’Hare is not relying on PFC to finance the project. Instead, the project will be funded by the airlines. The airlines leases at O’Hare expired in May 2018, and O’Hare increased the cost of the leases in order to fund the expansion project. Americans for Tax Reform suggest the other airport can follow this example in order to complete airport improvement projects.[128]
Other organizations, such as American Association of Airport Executives (AAAE) advocated before the Senate Transportation Appropriations Subcommittee to increase the PFC. AAAE President and CEO Todd Hauptli urged policymakers that increasing the PFC limit was the only way to assist airport with critical infrastructure projects, while also not impacting the federal budget.[129]
Use of Revenue
[edit | edit source]There has been some debate between airport operators and airlines about the appropriate scope of PFC projects. Unlike other grant programs that the FAA operates, like the AIP grant, which are limited to airside projects, PFC money can go towards a broader scope of improvement projects. Airport operators would like to broaden the scope of PFC-eligible projects.
Airlines have strongly opposed this, as they feel that airports will use PFC funds on projects that deliver less value and have no direct benefit to the airlines. Airlines are especially concerned that while passengers get charged the additional $4.50, they often do not have any input on what projects are funded with PFC’s. Federal law requires airports consult with the airlines on projects, but it does not require their consent.
Transparency of Spending
[edit | edit source]Stakeholders have also raised concerns about the transparency of PFC collections. Under the current systems, airlines are required to have audits of their PFC collections and the FAA provides audit guidance to help provide assurances that collections are accurate.[130] Airports have raised the concern that there is no transparent way for airports to track exactly how many passengers travel through an airport each day, resulting on their reliance on the audits and data that is published by the airlines. FAA regulations require that all airlines that process more than 50,000 PFC collections produce an annual independent audit of their accounts and processes.
According to the most recent GAO report, the FAA has reported that they do not know how many airports are receiving these audits, and they do not know how many airlines’ auditors follow the audit guidelines. While the FAA has stated that it is a rare occurrence that airlines do not follow their audit guidelines, it is difficult to know if this is the case, since the audits are rarely reviewed.
While airport stakeholders have expressed an interest in increasing transparency, it is not clear what that would involve. Currently, PFC charges are collected when passengers pay for their airline tickets, along with the other fees and charges that must be collected, such as TSA fees and state and local taxes. One proposal from the airports would be a separate payment screen for passengers when they purchase a ticket. For example, passengers who buy a ticket at the counter or kiosk, there would be an additional screen at the kiosk to pay the PFC. Passengers who purchase tickets online, there would be an additional screen before checkout.
Further, the FAA publicly provides monthly data on the type of investment projects (i.e. airside, landside, noise, and access) but it does not provide any further details on these projects or categorize projects by airport. Information on specific PFC airport projects can only be obtained from the media, which likely obtains their information through Freedom of Information Act (FOIA) requests. After extensive research for examples of current PFC projects, media recently reported that Bangor International Airport is using the funds to build a new terminal, and Seattle-Tacoma International Airport and Missoula International Airport are working to improve their terminals and runways.[131]
Funding Airport Infrastructure
[edit | edit source]A 2016 report found that of the 100 “top” airports in the world, only 13 were U.S. airports. The top two airports (Singapore and Incheon) are both private airports.[132] Many airports around the world have increased airport efficiency and competitiveness by privatizing. According to Cato, more than 100 countries have taken steps to partly or fully privatize their airports. Privatized airports and airlines estimated to be valued at $3.3 billion. An early proponent of airport privatization was the United Kingdom, under the leadership of Prime Minister Margaret Thatcher. Following this model, Europe has become a leader in airport privatization. In 2016, the Airports Council International found that 47% of airports in the European Union are private, an increase of 5% from 2010.[133] These airports are providing long term leases, sometimes upwards of 60 years, for an airport’s operations to be run by a company.
Airport privatization has been a much discussed subject in the U.S. In 1996, Congress took steps to allow for airport privatization through the Airport Privatization Pilot Program, but since only two airports have successfully privatized - Branson, Missouri and San Juan, Puerto Rico. Since 2001, twelve airports have submitted applications for consideration into the Airport Privatization Pilot Program, but many have withdrawn their applications. The main reasons
these airports withdrawal is that airports are unable to meet the conditions required by the program to solicit bids for privatization.
Discussion Questions
[edit | edit source]- Should the PFC rate remain at the current level or increase? If it should increase, what level should it increase to?
- Do you believe PFC should be described as a tax?
- Should the airlines bear more financial responsibility in maintaining airport infrastructure?
- Are PFCs an effective way to increase capital for airports?
- Should there be increased oversight of the PFC program?
- Should U.S. airport privatize?
Conclusion
[edit | edit source]The PFC program has allowed airports to conduct land-side projects by charging passengers a surcharge of $4.50 on airplane tickets. Since 2000, this charge has remained at the same level. The airline industry has lobbied to keep PFCs at this level, as they feel an increase in the fee would decrease airport passengers. Alternatively, the airport industry has lobbied to increase the PFC charge, as a way to increase revenue for infrastructure projects.
Further Reading
[edit | edit source]GAO Report on Raising Passenger Facility Charges Would Increase Airport Funding, but Other Effects Less Certain.
Resources
[edit | edit source]https://www.faa.gov/airports/pfc/
https://www.faa.gov/airports/pfc/monthly_reports/
http://airlines.org/blog/even-airports-struggle-to-make-the-case-for-a-pfc-increase/
http://airlines.org/blog/airports-are-hoping-to-gobble-up-your-cash/
https://www.gao.gov/products/GAO-15-107
https://www.cato.org/publications/tax-budget-bulletin/privatizing-us-airports
Citations
[edit | edit source]
CEQ 2-Year Planning
Summary
[edit | edit source]On August 15, 2017, President Donald Trump signed Executive Order (EO) 13807, which aims to reduce the federal review time of major infrastructure projects under the National Environmental Policy Act (NEPA).[134] The EO seeks to limit the NEPA process to no more than 21 months, with final approvals issued within 3 months following a decision.[135] These changes are designed to achieve the administration’s goal of expediting the construction of large infrastructure projects by shortening the federal permitting process to 2 years. The Trump Administration’s efforts are largely focused on streamlining environmental review process of Environmental Impact Statements (EISs), the most comprehensive of three levels of review under NEPA. Currently, any project requiring federal approval or utilizing federal funds must be reviewed according to one of three NEPA processes, which require agencies to examine how an action will affect the environment both temporarily, during the construction phase, and permanently. In such cases, each federal agency often produces its own study and conclusion. Each federal agency implements NEPA differently, and in a 2014 U.S. Government Accountability Office (GAO) report, agencies reported a huge disparity in costs paid to private contractors to complete EISs, ranging from $250,000 to $1.5 million.[136]
Timeline of Events
[edit | edit source]September 18, 2002 - President Bush signs Executive Order 13274
- EO 13274 applied only to transportation infrastructure projects. It allowed the Secretary of Transportation to designate high-priority projects and then assembled an interagency task force of all of the federal agencies with a role in the permitting process to find ways to work together to complete all permitting as quickly as possible.[137]
March 22, 2012 - President Obama signs Executive Order 13604
- This order applied to more infrastructure projects beyond just transportation. EO 13604 placed the federal Chief Performance Officer (a Deputy Director of the Office of Management and Budget) in charge of an interagency steering committee to “facilitate improvements in Federal permitting and review processes for infrastructure projects in sectors including surface transportation, aviation, ports and waterways, water resource projects, renewable energy generation, electricity transmission, broadband, pipelines, and other such sectors as determined by the Steering Committee.”[138]
- The Obama order focused on transparency by identifying projects and their timelines on a new website (the “Permitting Dashboard”), where the public could see how quickly the process was or was not moving.[139]
December 4, 2015 - FAST Act signed by President Obama
- The most recent surface transportation reauthorization bill, the FAST Act of 2015, included Title 41 (“Federal Permitting Improvement”). This provision established a statutory Federal Permitting Improvement Steering Council that has the same membership as the Steering Committee established by the Obama’s E.O. 13604 (plus FERC, the Nuclear Regulatory Commission, and HUD). The Council was charged with selecting infrastructure projects that have a total project cost of over $200 million each, and don’t qualify for abbreviated review processes under any other law. The Council is then directed to set performance schedules (using the Dashboard), including intermediate and final completion dates, for the permitting processes of the projects.[140]
January 24, 2017 - Trump Executive Order 13766
- Trump’s initial order on the subject was drastically more concise than President Obama’s EO 13604, and excluded language in the Bush order about federal responsibility “to promote environmental stewardship.” Trump’s order dispensed with any kind of interagency working group or task force, and rather directed the chairman of the CEQ to be in charge of corralling agencies into compliance.[141]
August 15, 2017 - Trump Executive Order 13807
- EO 13807 included focused on the concept of “One Federal Decision” in order to meet a two-year processing goal of environmental reviews and permitting.
- The order included projects that meet certain statutory requirements as high priority projects and says that the head of CEQ shall satisfy the requirements of the earlier order by simply referring projects to the FPISC. In doing so, the order aims to implement title 41 of the FAST Act.[142]
February 12, 2018 - President Trump Releases Infrastructure Plan Outline
- In addition to calling for $200 billion in new federal spending that aims to encourage investment of over $1 trillion in non-federal funds for infrastructure projects, the plan included the “one agency, one decision” environmental review structure that would reduce the permitting time frame to a two year maximum.[143]
April 9, 2018 - Federal Agencies Sign MOU Implementing EO 13807
- Twelve separate agency heads within the Trump Administration signed the MOU which seeks to implement EO 13807 by establishing a coordinated and timely process for environmental reviews of major infrastructure projects.[144]
October 29, 2018 - USDOT issues Final Rulemaking to Streamline NEPA Requirements and other key environmental rules.
- The rule aims to speed up and ensure “greater consistency” in the permitting of surface transportation projects. This effort will also reduce duplicative environmental reporting efforts between the Federal Highway Administration, Federal Railroad Administration, and Federal Transit Administration.[145]
Overview
[edit | edit source]The Trump Administration and others believe that the federal permitting process, especially the environmental review aspect under NEPA, is too long and prevents or delays the completion of important infrastructure projects. According to a GAO report in 2014, the completion of final EISs in 2012 had an average preparation time of 1,675 days, or 4.6 years—the highest average EIS preparation time the organization had recorded since 1997. Additionally, the GAO reported that many agencies told them that the “time frame measures for EISs may not account for up-front work that occurs before the Notice of Intent to produce an EIS—the 'start' date typically used in EIS time frame calculations.”[146] For example, DOT officials reported to GAO that the “start” date is unclear in certain instances because of the large volume of project development and planning work that takes place before they issue a Notice of Intent.
Under the president’s executive order, federal agencies would adhere to a policy of “One Federal Decision” that aims to improve coordination between federal entities to expedite the review process. On April 9th, 2018, the heads of 12 different departments and agencies in Trump’s cabinet signed a Memorandum of Understanding (MOU) that aimed to implement EO 13807. Specifically, agencies agreed to work together to “develop a single Permitting Timetable for the necessary environmental review and authorization decisions, prepare a single environmental impact statement (EIS), sign a single record of decision (ROD), and issue all necessary authorization decisions within 90 days of issuance of the ROD, subject to limited exceptions.”[147] Furthermore, agencies agreed under the MOU to conduct their review processes at the same time, rather than sequentially.[148]
Attempts at making the environmental review process more efficient are not exclusive to the Trump Administration. In 2002, President Bush signed an EO that allowed the Secretary of Transportation to designate high-priority projects and then assembled an interagency task force of all of the federal agencies with a role in the permitting process to find ways to work together to get all the permitting done as quickly as possible. In 2012, President Obama issued EO 13604, which focused on transparency by identifying projects and their timelines on a new public website - the “Permitting Dashboard”, so the public could follow the review process.[149]
Policy Considerations
[edit | edit source]Critics of the President’s plan argue that the cumbersome environmental review process is important to ensure fair consideration of the impacts federal projects may have on “wetlands, endangered species, Coast Guard navigational consents,” etc. Beyond impacts to the natural environment, EISs assess potential impacts to Environmental Justice populations, such as socioeconomically disadvantaged and limited English proficiency populations, as well as noise and vibration disturbing the surrounding communities and visual impacts.[150] By consolidating reviews and requiring them to be completed within a certain timeframe, environmental and public interest groups fear that such considerations will be excluded or not thoroughly assessed as part of the NEPA process.[151]
Another critical aspect of the NEPA process is public involvement. Multiple public review periods are required throughout the EIS process, including a 45-day public comment period following the publishing of the draft EIS.[152] Opponents worry that expediting the NEPA process that lack of public involvement will be one of the main consequences. The Sierra Club asserted, “Without strong NEPA procedural regulations, the public will not get the opportunity to comment or the opportunity to comment will be excessively shortened so that agencies and special interests can get approval to spend 100’s to billions of taxpayer dollars on projects that devastate the environment, including impacts due to activities that exacerbate climate change.”[153]
Furthermore, opponents believe that many delays to the process are caused more so by political disputes over project scope, character, funding and siting, rather than the actual environmental review. They are quick to point out that less than 10 percent of federally assisted transportation projects require an EIS. In 2014, the GAO reported that less than 1 percent of projects required an EIS.[154] Most projects qualify for a Categorical Exclusion (CE) from the National Environmental Policy Act, the least intensive NEPA review process. Additionally, about 5 percent of projects are subject to Environmental Assessments, the mid-level NEPA review.[155] Moreover, critics identify other issues that they believe have a more impactful role in creating project delays than the permitting and review process:
- Funding for Permitting and Reviews: Many believe that one of the largest problems to processing reviews is not the process itself, but a lack of funding and staff required to process the permitting and environmental reviews. They argue that the loss of agency expertise and the lack of support for NEPA and permitting staff in the agencies is responsible for many problems in implementing NEPA. They believe the process could be accelerated while ensuring environmental protection by implementing a system to collect fees from project sponsors to address bottlenecks by allocating those funds to agencies.[156]
- Lack of Sustainable Project Funding: Opponents also point to the impediments created by a lack of sustainable funding. Without guaranteed revenue streams, state and local agencies are slow to carry out projects because of the risks created by not having funding certainty.[157]
- Procurement Practices: Most states require a design-bid-build procurement process in which contracts for design and construction have to be awarded in separate bids. Some argue that this inhibits the efficiency in delivering process.[158]
- Other Environmental Requirements: As noted in the 2014 GAO report, beyond the lack of documentation on the number of NEPA reviews and associated costs and timelines, it is not well documented if environmental compliance efforts are aimed at meeting the requirements of the “Endangered Species Act and the Clean Water Act; executive orders; agency guidance; and state and local laws.” Without knowing where the current efforts are being directed, it is difficult to know how to effectively streamline NEPA reviews while maintaining adequate environmental protections.[159]
Annotated List of Actors
[edit | edit source]Governmental Actors
[edit | edit source]President Donald Trump
- Assumed office in January 20, 2018. Among other issues, campaigned on improving the nation’s infrastructure.
DJ Gribbin, former Special Assistant to the President for Infrastructure Policy
- Point person for infrastructure policy in the White House, responsible for coordinating the Administration-wide process behind the President’s infrastructure initiative
CEQ
- Structured within the Executive Office of the President, “CEQ oversees the implementation of NEPA, reviews and approves federal agency NEPA procedures, and issues regulations and guidance documents that govern and guide federal agencies’ interpretation and implementation of NEPA.”[160] CEQ is technically a three-person council, with each member nominated by the President and confirmed by the Senate, but for at least 20 years, Congress has set up the CEQ to be led by one member through language in appropriations funding.
Trump Administration and Agency Heads Signing MOU:
- Department of Interior Secretary Ryan Zinke
- Department of Agriculture Secretary Sonny Perdue
- Department of Commerce Secretary Wilbur Ross
- Department of Housing and Urban Development Secretary Ben Carson
- Department of Transportation Secretary Elaine Chao
- Department of Energy Secretary Rick Perry
- Department of Homeland Security Kristen Nielsen
- U.S. Army Corps of Engineers Secretary Mark Esper
- Environmental Protection Agency Administrator Scott Pruitt
- Federal Energy Regulatory Commission Chairman Kevin McIntyre
- Advisory Council on Historic Preservation Executive Director John Fowler
- Federal Permitting Improvement Steering Council Acting Executive Director Angela Colamaria
Federal Permitting Improvement Steering Council (FPISC)
- The Fast Act, the most recent surface transportation reauthorization bill, created a new entity – the Federal Permitting Improvement Steering Council (FPISC), composed of agency Deputy Secretary-level members and chaired by an Executive Director appointed by the President. The entity was tasked with improving Federal infrastructure permitting.
Opponents
[edit | edit source]Natural Resources Defense Council
Sierra Club
Proponents (non-governmental)
[edit | edit source]U.S. Chamber of Commerce
National Association of Manufacturers
North America’s Building Trades Unions (NABTU)
American Council of Engineering Companies[161]
Additional Suggested Reading
[edit | edit source]White House Press Release on Issuing MOU:
https://www.whitehouse.gov/briefings-statements/president-donald-j-trumps-administration-improving-inefficient-permitting-reviews/
Opposition Op-Ed on Other Steps Needed to More Quickly Process Permits: https://www.usnews.com/opinion/op-ed/articles/2017-08-22/trump-wont-speed-up-infrastructure-projects-by-gutting-environmental-rules
GAO Report on NEPA Efforts (2014):
https://www.gao.gov/assets/670/662543.pdf
White House MOU on Executive Order for Streamlined Permitting: https://www.whitehouse.gov/wp-content/uploads/2018/04/MOU-One-Federal-Decision-m-18-13-Part-2-1.pdf
Discussion Questions
[edit | edit source]- From your experience or assessment, what do you think causes the most significant delays in permitting and reviews?
- Do you believe the application of NEPA has become too stringent and inhibits infrastructure improvements, or does it ensure an adequate consideration of environmental impacts?
- What action, if any, do you think federal policymakers should take to address issues with delays of environmental reviews, permitting, and project delivery?
- Do you think the Trump Administration’s 2-year permitting plan is a good goal and would be a benefit for transportation systems?
- Is it possible to conduct all environmental reviews, required public outreach, and complete documentation within 2 years?
- Will special interest groups gain influence bypassing public interests if environmental reviews are expedited?
Sources
[edit | edit source]
I-66 Inside the Beltway Tolls
Summary
[edit | edit source]The I-66 inside the beltway tolls is implemented jointly by the Implemented jointly by the Commonwealth Transportation Board, Northern Virginia Transportation Commission and Virginia Department of Transportation. Proposed project follows a multi-year study undertaken in 2011 and completed in 2013. Tolling: Convert I-66 to dynamically-priced toll lanes in both directions during weekday rush hours. The I-66 inside the Beltway project is part of the multimodal project that involves: enhanced bus service throughout the corridor, better access to Metro, new bicycle and pedestrian access, and roadway improvements on local roads. The revenue from the I-66 tolls provide necessary funding for ongoing maintenance and infrastructure improvements in the I-66 corridor.
Annotated List of Actors
[edit | edit source]- Virginia Department of Transportation (VDOT). VDOT is responsible for building, maintaining and operating the state's roads, bridges and tunnels
- Commonwealth Transportation Board (CTB). The CTB operates under CTB Policy Handbook dated January 25, 2018. It is chaired by the Secretary of Transportation and has direct approval authority of VDOT and Department of Rail and Public Transportation and have funding allocation authority through the funding mechanism established by statute.
- Northern Virginia Transportation Commission (NVTC). Founded in 1964, in part to represent the interests of the Commonwealth during the establishment of the Washington Metropolitan Area Transit Agency (WMATA), NVTC is charged with the funding and stewardship of WMATA and the Virginia Railway Express (VRE), which it co-owns. Because Northern Virginia is also home to six bus systems, NVTC works across jurisdictional boundaries to coordinate transit service. Per the terms of the MOA, the CTB has delegated to NVTC the authority to select and administer the I-66 Commuter Choice Program.
- Arlington County
- Fairfax County
- City of Falls Church
- INRIX. A private corporation aimed towards delivering innovative products for the automotive and transportation industries such as real-time parking and traffic information and solutions that facilitate the safe testing and deployment of autonomous vehicles.
- Federal Highway Administration (FHWA) supports State and local governments in the design, construction, and maintenance of the Nation's highway system (Federal Aid Highway Program) and various federally and tribal owned lands (Federal Lands Highway Program).
- Department of Rail and Public Transportation (DRPT): The mission of DRPT is to facilitate and improve the mobility of the citizens of Virginia and to promote the efficient transport of goods and people in a safe, reliable, and cost-effective manner.
- Transportation Planning Board (TPB). It is the federally designated metropolitan planning organization (MPO) for metropolitan Washington.
- Transcore. A private corporation aimed towards developing express lanes technology and creating smarter traffic systems.
Timeline of Events
[edit | edit source]- 1982-I-66 opened inside of I-495 as one of the first interstates in the US limited to HOV-only traffic during peak weekday travel periods.
- 2009-VA DRPT conducted the I-66 Transit/Transportation Demand Management (TDM) Study.
- 2012- DOT and DRPT completed the I-66 Multimodal Sudy Inside the beltway, followed by Supplemental Report in 2013.
- March, 2015-VA Secretary of Transportation Aubrey Layne announced plans to transform I-66 inside the beltway. CTB approves Governor Terry McAuliffe’s administration’s proposal to transform I-66 inside the beltway.
- 2016-Governor McAuliffe announces bipartisan compromise to address gridlock on I-66 inside the beltway. Design public hearings are held and
- March, 2016-I-66 inside the beltway design public hearings held. Information discussed how dynamically-priced toll lanes will operate on I-66 inside the Beltway, locations of the toll gantries and pricing signs.
- June, 2016-CTB awards construction contracts valued approximately $60M to Tran score, LP (toll integrator contract) and Fort Myer (civil infrastructure) for Tolling System on I-66 inside the Beltway.
- August, 2016-Governor McAuliffe announced groundbreaking for I-66 Inside the Beltway Improvements Project
- December, 2017-Tolls for solo drivers and expanded rush hour periods begin.
- June, 2018 Inside the Beltway Express Lanes Six-Month Performance.
- 2011 HOV-3+ will travel for free as adopted in the Regional Transportation Plan
Maps of Locations
[edit | edit source]
.jpg)
Clear Identification of Policy Issues
[edit | edit source]Road pricing is a policy that requires you to pay for the use of a road. There are a lot of different types of road pricing. The aim of the road pricing is to make the price of using the road equal to the cost of using the road, including the negative externalities like pollution, noise, accidents, and etc.
Pros:
- Reveals the true economic costs of the road use (including replacement costs) so that intermodal competition would become fairer. Because road prices would be primarily connected with congestion costs, some distributional and locational effects could arise. Costs of driving in non-urban areas would probably fall whereas urban driving costs would increase so that in the medium run, the quality of the public urban transport system would improve. *Reducing the cost of congestion - It has been estimated that traffic congestion in urban cities lowers GDP by as much as 3.50%. Lowering congestion will translate into more benefits for business and citizens. [162]
- Increased efficiency in public transportation - With increased usage, public transport will attract more funds through fees levied for services. This will add to its corpus and improve the efficiency and quality of public transportation. [163]
- Lowering air pollution by making use of less cars and motorcycles will also mean a lower degree of air pollution. [164]
Cons:
- Congestion tax is vertically inequitable - Those who have higher incomes will pay lower proportion of their income in such charges as compared to those with limited monetary resources. [165]
- City centers will lose business - Currently, people have the convenience of travelling to shops and urban centers with ease. Imposing a congestion tax will only serve to lowered traffic to city centers and this will impact business adversely. [166]
- Expensive to implement - Collecting the congestion tax will be a tough task, given that the cost of collection will be high. Even the technologies and manpower needed to administer this tax will be costly. [167]
- Public transport systems will be overburdened and overcrowded - Increasing the burden on public transport systems will create further problems for the State as more people will take this transportation mode and create a burden on already choked systems. [168]
Narrative of the Case
[edit | edit source]Traffic congestion in many of the nation’s metropolitan areas is endemic, with the cost of congestion—including lost time, wasted fuel, and vehicle wear and tear—topping $78 billion per year for the nation’s 437 urban areas. Transit ridership has recently surged, leaving some systems operating near or beyond their physical capacity. Many rural areas currently do not have any transit services and in areas that do have service, the quality and coverage are inconsistent. The federal government does not bear sole responsibility for the current crisis. All levels of government are failing to keep pace with the demand for transportation investment. Increasingly, policy makers at all levels must use existing revenues simply to attempt to keep pace with the preservation and maintenance of an aging system, leaving few or no resources for vitally needed new capacity and improvements to the system. Meanwhile, the federal Highway Trust Fund faces a near-term insolvency crisis, exacerbated by recent reductions in federal motor fuel tax revenues and truck–related user fee receipts. Our current federal funding approach is weakened by two factors. First, by not being indexed to inflation, the Highway Trust Fund’s purchasing power relative to needs erodes over time. Without periodic correction by Congress, the gap between needs and revenues grows. Second, increasing fleet fuel economy and changing vehicle technology will erode the long-term sustainability of fuel-tax-based revenue mechanisms, as vehicles use less, and different, fuel over the same distance traveled and thus pay lower taxes for the same travel benefit. [169]
In addition to insufficient investment, our system is underpriced. Basic economic theory tells us that when something valuable, such as roadway space, is provided for less than its true cost, demand increases and shortages result. Shortages in our road system are manifested as congestion. As the symptoms of congestion manifest and proliferate deteriorating roadways, bridges, and transit systems will increase and, more accidents and fatalities will be prone to take place in transportation systems. Compounding these effects will be the waste of time robbing businesses of vital economic activity and productivity. Simultaneously, there will be a significant waste of fuels and add on harm to the environment unnecessarily. [170], Congressionally-created Commission Recommends Mileage Tax Instead of Fuel Tax for Transportation Infrastructure Financing. </ref>
By making those who directly use and benefit from the transportation system should, as a general rule and when feasible, bear the primary responsibility for the full cost of system use, including externalities costs placed on others and the environment. Internalizing the full costs of transportation will require more accurately identifying, quantifying, and charging the full range of costs, including the direct costs of transportation improvements and operations, such as pavement damage, and the indirect costs, such as those due to associated congestion, accidents, and pollution. The various applications of tolling and pricing can generally be grouped into two types of approaches, one of which targets tolling and the other comprehensive pricing. Both of which are differentiated by the geographic scope of their application. [171]
Across the United States and around the world, targeted tolls and pricing are a proven technique for charging users who travel on selected roads or within a regional transportation system. Widespread acceptance depends on clear evidence that the fees can be administered in ways that are fair and convenient for users and that are practical and cost-efficient for governments. A New Framework for Transportation Finance 127 network. Advances in technology are encouraging adoption of more sophisticated tolling and pricing practices. In the United States, targeted tolls are mostly used to pay for construction, maintenance, operation, and improvement of individual facilities and sometimes to manage congestion. Facilities that are subject to targeted tolling and pricing are access-controlled, and prices to use them are usually fixed. Examples of targeted tolling and pricing include charging to use selected highways, tunnels, or bridges; pricing access to designated congestion-free lanes; and charging to enter cordoned areas prone to heavy congestion. Targeted tolling and pricing approaches refer to direct user fee mechanisms that are administered at the local, regional, or state levels and that focus on pricing access to and/or distance traveled on individual facilities or regional networks. Specific targeted approaches include tolling applications (such as a tolled bridge or highway), high occupancy toll (HOT)/ managed lanes, and cordon pricing. Targeted tolling and pricing rates can be fixed as a set rate for facility access or for specific distances, or they can be variable, with dynamic rates that can change based on considerations such as type of vehicle or time of day/level of congestion (typically referred to as congestion pricing). [172] Targeted tolling and pricing are not feasible strategies for revenue generation at the federal level because they focus on specific roads or networks of facilities in defined geographic areas. They are nonetheless important tools that some states, localities, and regions use to generate funding for surface transportation investment. In addition, the systems and architecture that would be required to implement comprehensive pricing at the federal level could be leveraged to facilitate broader use of targeted tolling and pricing—particularly congestion pricing—at the state and local levels. [173]
The Virginia Department of Transportation (VDOT), in partnership with the Virginia Department of Rail and Public Transportation (DRPT), developed and introduced the conversion of I-66 inside the Beltway between I-495 (the Capital Beltway) and Rosslyn, to variably-priced toll lanes and extend the existing morning and evening high occupancy vehicle (HOV) periods from a 2.5-hour window to a 4-hour window between 5:30 a.m. and 9:30 a.m. traveling eastbound and 3:00 p.m. and 7:00 p.m. traveling westbound to better manage the travel demand in the corridor.[174] Beginning in 2017, single occupancy vehicles (SOVs) were allowed to use the lanes during the restricted hours by paying a toll, and vehicles with two or more occupants (HOV-2+) were no longer tolled. Beginning in 2021, which is consistent with the opening of the express lanes project along I-66 outside the beltway, both SOVs and vehicles with two occupants (HOV- 2) will be required to pay a toll to use the lanes, and HOV-3+ will not be tolled. In accordance with the National Environmental Policy Act (NEPA) and 23 CFR 771, a Categorical Exclusion (CE) has been prepared in cooperation with the Federal Highway Administration for an electronic tolling system under the federal Value Pricing Pilot Program. [175]
During the initial launch of the I-66 tolls lanes, there was vast wave of criticism against their continuing used and rates. Several Virginia lawmakers called for the state to suspend tolls on I-66, condemning initial variable tolls rates that went as high as $40 as an outrageous and unacceptable measure. Amongst critics their argument stated that the currently application of the inside the beltway tolls rates were very different from what we briefed people it would be. He said VDOT told him that as many as 76 commuters paid $40 at the peak of the morning rush hour on Tuesday, out of about 11,000 vehicles that went through the system during the morning rush. But, it is still unclear what the average toll is. In a presentation to the Northern Virginia Transportation Commission in September 2015, Deputy Transportation Secretary Nick Donohue said the tolls were projected to be about $7 going eastbound in the morning rush hour and about $9 westbound in the evening. The tolls are intended to vary significantly depending on congestion. The tolls are dynamic, meaning they change according to demand and volume of traffic to maintain a target speed. The tolls are calculated every six minutes. During Monday’s commutes, the average speed was 57 mph consistently.[176]
Other large metropolitan locations have developed and enacted road pricing measures in order to combat the growing effects of congestion. One example is London, which enacted strict congestion pricing through many of its central districts in 2003. If a motorist wants to bring their vehicles into central London between 7 a.m. and 6 p.m., they have to pay a fee of roughly $15. In the first 10 years, the fees have netted about $1.6 billion, most of which has been reinvested back into transit, including improving the city’s bus network. Several other cities have also experimented with congestion pricing. In Stockholm, traffic dropped by an average of 20 percent after the city introduced its congestion fees. Though 70 percent of Swedes were initially opposed to the tax, after a few years of lighter traffic, 70 percent support now the tax. [177] The electronic road pricing (ERP) system that was launched in YEAR continues to be carried out in Singapore. In July 1989, the Cabinet gave the go-ahead for the ERP system, with an initial target to introduce it in five years' time. The $197-million system, produced by a Singapore-Japan consortium led by Philips Singapore, underwent rounds of tests to its gantries and in-vehicle units for 12 months before the system's launch. The system was implemented in stages, beginning with the CBD, and on the Central Expressway, Pan-Island Expressway and the East Coast Parkway in the following two years. It was later extended to other expressways and major arterial roads, such as Orchard Road. In preparation for the launch, motorists had to make appointments at vehicle inspection centers and workshops to get their vehicles fitted with an in-vehicle unit. [178] Currently, the charge period in the central RZ is in effect from 7:00AM to 7:00PM (Monday through Friday) and charge rates vary from zero to approximately US$2.00 per crossing at a charge point. The rates vary from zero to about US$4.00. Also, a few of the arterial streets are priced weekdays from 7:00AM to 9:30AM and the prices vary from zero to about US$0.80. Over the past thirty years, the expansion of the congestion pricing program has been accompanied by major reforms and expansion in vehicle taxation policies as well as significant enhancements to public transportation services including introduction and expansion of mass rapid transit, light rail and bus systems. [179]
Northern Virginia is really taking a significant approach towards comprehensive transporation policy, naturally a wide array ofattention is being made on I-66 inside the Beltway. Moving forwrds there will be a new project coming online for I-66 outside of the Beltway. All of these things seem like separate, different projects, but they’re actually all designed to work together. The magnitude and reach of these projects are required for the larger redevelopment that is happening in the region. The projected growth is estimated to take place not only in Arlington but also Tysons Corner, and other surrounding periphery urban locations. The goal is aimed towards large experiments in urban redesign and redevelopment. So all of this has to be taken in this bigger context because they’re not just transportation projects in isolation, they’re part of what’s going on across the entire region. Part of the success is directed towards actually reducing travel times. Travel times were 10-12 minutes compared with 15-30 minutes last December. In addition, travel speeds on I-66 averaged 52.4 miles per hour (mph) during morning commutes compared to 45.7 mph in February 2017. Drivers on parallel arterial roadways including Routes 7, 29 and 50, and the George Washington Memorial Parkway, experienced similar or improved travel speeds and times. The application and dispersion of funds is and will continue to be an essential element towards the feasibility and vitality of the inside the Beltway toll lanes. Funding is being directed towards a stable revenue stream to support multimodal investments on I-66 and complementary corridors adjacent to I-66. Toll revenue generated from the I-66 inside the Beltway Express Lanes supports the I-66 Commuter Choice Program run by the Northern Virginia Transportation Commission. All toll revenues after operating costs will be allocated to transit and other multimodal initiatives that provide a direct benefit for those who travel on the I-66 corridor by the Commission. Fairfax Connector Express Bus Service between Vienna/Fairfax-GMU and Pentagon Metrorail stations, Fairfax County ($3,452,618). [180]
Lessons Learned
[edit | edit source]- Lack of political support and long term commitment is indicative of a faulty finance transportation policy
- Poor popular perception reflects poor general awareness road conditions and capacity. towards
- Congestion pricing is considered as inequitable often suggest that it will harm those with lower incomes who will be forced to pay additional costs or be priced off the roads
- Mass transit systems are ill-equipped to handle rapid passenger surges.
- Shuffling traffic around to other surrounding roads is not the best methods to handle mass congestion.
Discussion Questions
[edit | edit source]- Exactly where does the toll revenue go?
- Should other U.S. cities use congestion pricing to ease traffic?
- Which measures should be installed in order to make congestion pricing politically permissible?
- Aside from congestion pricing, which other mechanisms should be set in place in order to alleviate congestion?
- Does congestion pricing hurt local business?
Conclusion
[edit | edit source]Most transportation pricing systems usually require several months or even years to achieve its full effects. One of congestion pricing’s greatest strengths is convincing drivers to skip trips they don’t really need to take, or convince them to go at another time. Though the express lane scheme targets commuters, not everyone who travels during those periods is going to work. The percentages vary by metro area and travel corridor but the data show that about half of peak period trips are for other purposes. A long term commitment is required in order to see this if congestion pricing can influence where people choose to live.
Complete Reference
[edit | edit source]
Sidewalk Based Delivery Robots
Summary
[edit | edit source]Starship Technologies is a startup company building fleets of self-driving sidewalk-based delivery robots designed to deliver goods locally within 15-30 minutes in up to a two-mile radius from a local hub. The robots drive autonomously 99 percent of the time to make curb-side deliveries. When encountering a situation the robot cannot handle, it will be remotely piloted over the internet. Launched by Skype co-founders, Starship’s aim is to fundamentally reshape how goods are shipped and delivered. There are a few other competitors to Starship Technologies, but with strategic partnerships like with Daimler the company is emerging as a leader in this new transportation mode that has several challenges to successful widespread implementation.
Annotated List of Actors
[edit | edit source]Ahti Heinla
[edit | edit source]CEO, CTO and co-founder of Starship Technologies. Also a co-founder of Skype. [181]
Daimler (Mercedes-Benz)
[edit | edit source]Major automotive manufacturer and investor in Starship Technologies who has launched "pilot projects combining Mercedes-Benz vans and delivery robots" [182]
Dispatch
[edit | edit source]Startup company and competitor to Starship Technologies. [183]
DoorDash and Postmates
[edit | edit source]Food delivery startups conducting pilot testing with Starship delivery robots [184]
District Department of Transportation
[edit | edit source]Approved testing of Starship six-wheeled delivery robots in summer 2016 to run from September 15 through December 2017. [185]
Janus Friis
[edit | edit source]Co-founder of Starship Technologies and also co-founded Joost, Skype, Kazaa and Joltid . [186]
Marble
[edit | edit source]Startup "urban logistics" company and competitor to Starship Technologies. [187]
Virginia Commonwealth
[edit | edit source]Passed SB1207 in February 2017, which "allows for the operation of electric personal delivery devices on the sidewalks and shared-use paths and across roadways on crosswalks in the Commonwealth unless otherwise prohibited by a locality." [188]
Timeline of Events
[edit | edit source]- July 1, 2014 - Starship Technologies is founded.
- August 2014 - First robot prototype is created.
- December 2014 - First Starship Technologies office opens in Tallinn, Estonia.
- September 2016 - Mercedes-Benz Vans partnership with Starship Technologies is announced.
- January 2017 - Starship Technologies announces $17.2M in funding.
- March 2017 - Starship Technologies office opens in Washington, D.C.
- April 2017 - Starship Technologies office opens in Hamburg, Germany.
- July 2017 - Delivery Robots are approved for testing on sidewalks in five states: Florida, Idaho, Wisconsin and Virginia plus the District of Columbia. Virginia is the first state to codify electric personal delivery devices.
- August 2017 - Just Eat announces it has delivered its 1000th meal in London by robot [189]
Maps of Locations
[edit | edit source]This is a Google Map of the five states that currently have laws in place allowing for sidewalk-based delivery robots. It also shows San Francisco that is debating whether to ban or allow for testing. https://drive.google.com/open?id=1bp_hizKtIXfhL6EHo-a_ewNUZpFcKRXM&usp=sharing
Narrative of the Case
[edit | edit source]In DC area, street delivery robots recently appeared on the sidewalks. They are designed to deliver takeout food from restaurants to customers. Starship Technologies, an Estonian-based ground delivery robotics company, has teamed up with Postmates and Dashdoor, online delivery service providers, to deliver food. The robot is a medium-sized, knee-height with six wheels. Each robot is about 35-pounds. The average speed is about 4 miles per hour which is a little bit slower than the human walking speed of 5 miles per hour. It is equipped with an orange flag to make it more visible to pedestrians on the sidewalk. After receiving an order from a customer, normally via a smartphone app, takeout food will be placed inside the robot by restaurant staff. The customer can also make the payment, including the delivery fee, via the mobile app. The robot will then deliver the order to the customer along the street and sidewalk. The customer will be notified by the app to expect that the robot is coming. Using the app, the customer can unlock the lid on top of the robot, take out the food and close the lid. Then, the robot will be dismissed by marking as one successful delivery. [190]
The robot is operated through the mobile app. When placing an order, a consumer can input the destination for delivery. The destination can either be coordinates or street names, the same inputs as people traveling to a place. The robot is equipped with GPS, sensors and cameras etc. Artificial intelligence technologies are applied to facilitate integrating all the technologies so the robot can drive by itself. [191]
The built-in artificial intelligence technologies allow the robot to learn more about sidewalks, traffic patterns and interaction with pedestrians. They are able to learn and recognize signals, traffic lights, crosswalks, pedestrians and animals. Integrated navigation and obstacle avoidance software enables the robot to drive mostly on its own.
Human supervision and monitoring is needed in case the robot needs to be operated manually for situations that involving in safety, emergency or beyond robot’s ability to manage. A human operator can take over by through remote access. The robot is equipped with security system, such as alarm sounds, cameras and tracking devices, to prevent theft. Normally, the value inside the robot is not expensive. However, they are equipped for this scenario just in case. Each robot can carry the equivalent of two grocery bags (around 22 pounds) up to three miles from a local hub, restaurant or retail outlet. Customers will be able to choose a delivery route and expect goods to be delivered at a time that fits their schedule. A shopper can also track the robot’s location in real time during delivery. Therefore, they can meet the robot at the set destination to finish the delivery. [192]
While Starship is testing its robots in Washington, D.C. area, Virginia has made robotics history. The Commonwealth was the first state to pass legislation allowing delivery robots to operate on sidewalks and crosswalks across the state. The new law goes into effect on July 1, 2017 and was signed into law by the governor. The two Virginia lawmakers who sponsored the bill, Ron Villanueva and Bill DeSteph, teamed up with Starship Technologies to draft the legislation. Idaho, Wisconsin, Florida likewise passed state legislation to allow for the use of delivery robots earlier this year — all with the help of Starship Technologies. Ohio is now the fifth U.S. state to pass a law permitting the use of delivery robots on sidewalks and in crosswalks statewide. The regulations for each state are listed below with the sequence of the state passing the sidewalk delivery robot law:
1. Virginia (Signed on 2/24/2017)
[edit | edit source]Robots operating under the VA law won’t be able to exceed 10 miles per hour or weigh over 50 pounds, but they will be allowed to rove autonomously. The law doesn’t require robots to stay within line of sight of a person in control, but a person is required to at least remotely monitor the robot and take over if it goes awry. Robots are only allowed on streets in a crosswalk. [193]
2. Idaho (Signed on 3/27/2017)
[edit | edit source]Ground-based delivery robots are allowed to operate in Idaho without a person walking alongside them or watching them in their line of sight. In other words: The robots can operate autonomously in Idaho. But there still has to be a remote monitor somewhere in the loop to intervene in case one of the rovers needs assistance. The delivery robots that fall under the law can’t go faster than 10 miles per hour. Similar to the Virginia legislation, local Idaho municipalities are allowed to adopt their own regulations, like if a town wants to prevent the operation of the robots in certain crosswalks or limit the speed of the devices. [194]
3. Wisconsin (Signed on 6/21/2017)
[edit | edit source]The Wisconsin law places an 80-pound weight limit on the robots and doesn’t permit the machines to travel faster than 10 miles per hour. The robots are also required to have a person in the loop to take over control in case something goes awry. The 80-pound limit, however, might mean that some of Starship’s competitors can’t operate in the state. [195]
4. Florida (Signed on 6/26/2017)
[edit | edit source]Robots operating on sidewalks and crosswalks in Florida will not be allowed to weigh over 80 pounds or travel faster than 10 miles per hour. That weight limit is important to note as it could lock out other ground robot companies from operating in the state. That’s because some of Starship’s competitors, including the robot delivery startup Marble, which started a trial in San Francisco earlier this year, make robots that weigh more than 80 pounds. The three other state laws similarly have potentially prohibitive weight limits. (Starship’s robots weigh 45 pounds when empty.) [196]
5. Ohio (Signed on 6/30/2017)
[edit | edit source]Ohio’s new robot law allows for the machines to operate on sidewalks and in crosswalks in the state, so long as they weigh less than 90 pounds and travel at speeds of less than 10 miles per hour. The robots can rove unmanned, but a person is required to be in the loop remotely to take over operation in case something goes awry. All the other state laws have near identical provisions, with weight limits ranging from 50 to 90 pounds. [197]
6. San Francisco (City ordinance signed 10/27/2017)
[edit | edit source]San Francisco was considering banning sidewalk delivery robots. This is despite being home to tech company Marble that is testing robot similar to Starship's. San Francisco supervisor Norman Yee said "our streets and our sidewalks are made for people, not robots" and also expressed concern that delivery jobs would be eliminated. SF police commander Robert O'Sullivan is also in favor of the ban fearing potential harm to children, the elderly or people in wheelchairs. "If his by a car, they also have the potential of becoming a deadly projectile," he said. [198] However, San Francisco has implemented a city ordinance that establishes a permit system and allows for testing of delivery robots in certain zones and within a list of permitted parameters. [199]
Policy Implications
[edit | edit source]Potential Benefits
[edit | edit source]- Reduced congestion from larger delivery vehicles
- Since they are electrically powered with a lithium-ion battery, they can reduce urban air pollution
- Reduced costs for customers and businesses spurring more economic activity
Potential Negative Impacts
[edit | edit source]- Reduction in employment or impacts to the nature of delivery services
- Crowding of constrained urban space now reserved for pedestrians and people in wheelchairs - i.e. a few sidewalk robots will not cause too much of an issue, but what happens beyond a certain critical mass?
Consequences to employment and society
[edit | edit source]The primary motivators for these robots is convenience and cost. By lowering the cost of delivery, this will likely induce more customers to order from restaurants and at a lower costs per item. DoorDash co-founder Stanley Tang said that the company will not attempt to replace human workers with robots. He said, “We have people who use cars, bikes, scooters, motorcycles or walk to make a delivery. And each has a different strength and suitability for different deliveries. Robots will be another type of vehicle in our system.” He continued that since human "dashers" depend on tips, they prefer not to do a lot of lower cost deliveries. [200]
Matt Delaney, one of Marble’s three co-founders who called robots “the only sane solution” said that these sidewalk-based delivery robots could improve quality of life for people like his grandfather, who lost his driver’s license and has to hire someone for tasks like picking up prescriptions at the pharmacy. [201]
Potential solutions to employment impacts
[edit | edit source]South Korea is the first country to implement a "robot tax" by "limiting tax incentives for investments in automated machines." Also, Bill Gates has called for a tax on robots as jobs are lost to automation. He said it could help slow down the pace of change and provide money to hire additional employees in sectors that require people, such as health care, as well as to fund worker retraining. Gates said: "Right now, the human worker who does, say, $50,000 worth of work in a factory, that income is taxed and you get income tax, social security tax, all those things. If a robot comes in to do the same thing, you’d think that we’d tax the robot at a similar level." [202]
Elon Musk, the founder and CEO of Solar City, Tesla, and SpaceX said that robots will push us to a universal basic income (UBI) and that is the reasonable next step for the U.S. "There is a pretty good chance we end up with a universal basic income or something like that, due to automation," Musk told CNBC. "Yeah, I am not sure what else one would do. I think that is what would happen." [203]
Lessons Learned
[edit | edit source]The challenges of robot delivery include finding their way around roads and sidewalks, navigating next to vehicles and around pedestrians, and interacting more directly with humans. In addition, GPS isn’t accurate enough to keep the robots on sidewalks. The robots have to use equipped sensors to detect the surroundings and determine proper actions via the built-in artificial intelligence. They will have to rely on digital street maps like autonomous cars do. They will have to be able to face and react appropriately under the following situations:
- Traffic lights
- Pedestrian crossing behaviors and patterns
- Emergency vehicles
- Unpredictable humans and animals
Sharing a sidewalk with delivery robots is another issue. The robot moves a little bit slower than people walking. The motion may be like every few feet it pauses, jerking to the left or right, perhaps turning around, and then turning again before continuing on its way. Accommodation to the street delivery robot will have to be accepted by the public. It may need more time and experiences to determine if the public will fully accept them.
Sidewalk-traversing robots are one of several possible solutions to the “last-mile” logistics. “With just a handful of robots in service, urban areas have yet to face any backlash. But the revolutionary promise of robot deliveries will only be realized if these companies achieve thousands and thousands of robots in thousands of cities around the world.” according to the San Jose Mercury News. [205]
Discussion Questions
[edit | edit source]- Will robots disrupt the fabric of urban neighborhoods?
- Can sidewalk robots be made sufficiently safe and secure and not potentially used for harmful purposes (i.e. terrorists hiding a device in one)?
- Are pedestrians prepared to jostle for limited sidewalk space?
- Are robots safe without risking hurting pedestrians during operation and who is liable for injury?
- Will (or should) sidewalks be adapted for robots?
- Are sidewalks maintained appropriately in meeting the needs for robotic operations?
Further Reading
[edit | edit source]Gaskill, Tyler. 2017. "Conquering the Last Mile." Quality Progress 50 (4): 10-12. https://search.proquest.com/docview/1888662912.
Reference
[edit | edit source]
Evacuation Best Practices (Lessons Learned)
Summary
[edit | edit source]Taken together, natural disasters (comprising hurricanes, tropical storms, floods, firestorms, tsunamis, and volcanic eruptions) affect 26+ million people in the US and 255 million globally each year. There are six areas that contribute to the success or failure of any evacuation: Control of the Evacuation, Evacuation of Vulnerable Populations, Fuel Availability, Evacuation Routes, Media Influence and Public Awareness.[206] The page reviews major hurricane areas and evaluates the critical failures during past evacuations and lessons learned that resulted in policy changes.
List of Actors
[edit | edit source]President
Can declare a state of emergency or disaster for any situation. The President plays a large role in disaster response but does not have much of a role in evacuation.[207]
Governor or Tribal Chief Executive
The Stafford Act[208] gives the authority to issue the evacuation orders or delegate authority to the local officials. He or She must request that the President declares a state of emergency or disaster to receive federal aid. The governor has the authority to activate his state's National Guard and request assistance from other states based on the Emergency Management Assistance Compact.[209]
Mayor
Issues a local evacuation order and advises the governor on local needs.[210]
National Guard
Will pre-stage equipment for hurricane response. They can also assist local police to provide security during evacuations and provide transportation to evacuate people from areas using ground or air assets.[211]
Local Law Enforcement
Actively enforce and facilitate evacuation operations. They have several responsibilities including actively evacuating people from their homes, ensuring that people safely evacuate the area, enforcing curfews, escort essential supplies, build protective barriers around hazardous materials, maintaining law and order during and after the evacuation, and actively preventing looting.[212]
National Hurricane Center
Collects storm data and analysis, enabling them to provide advice to decision makers on necessary evacuation areas, storm strength, establishing watches, and warnings. They provide the data on the affected area or to appointed state organizations in order to advise local or state officials.[213]
Homeland Security and FEMA
Work in conjunction with each other to advise state and local governments on creating and refining evacuation plans and procedures. They also assist in coordination for critical evacuation resources (transportation, delivery of supplies, support locations and shelters). They control air space, movement for all resources and manage security operations in the evacuation area to ensure delivery of supplies and evacuation of vulnerable populations.[214]
Clear Identification of Policies
[edit | edit source]The Robert T. Stafford Disaster Relief and Emergency Assistance Act (Stafford Act)
In 1974 President Nixon signed the first version of the Disaster Relief Act later to be known as the Stafford Act. This act established law and guideline to plan, evacuate, and recover from disasters. State and local governments are required to establish evacuation plans to include establishing routes, stock piling necessary supplies, shelter locations and shelter plans. They must also plan for evacuation and delivery of necessary resources. Plans must consider all modes of transportation in order to relocate and evacuate all residents in the area including vulnerable populations. Public education plans must be made available to all, including limited knowledge of English. This act has been amended several times to expand its scope usually in the wake of a hurricane.[215]
Post-Katrina Emergency Management Reform Act (PKEMRA)
In 2006 following the destruction of Hurricane Katrina PKEMRA was used to amend the Stafford Act to prevent future loss of life. PKEMRA established a Disability Coordinator and developed rules and guidance to ensure individuals with disabilities have appropriate care, transportation equipment and shelters capable of tending to their needs.[216] It established the National Emergency Family Registry and Locator System to reunite family members separated in the evacuation process. It coordinated and supported precautionary evacuations and recovery efforts. It also provided transportation and relocation assistance to individuals without the means to provide self-transportation. And it provided case management assistance to identify and address unmet needs of survivors of major disasters.[217]
Public Law 109–308
Amended the Stafford Act to require evacuation plans to include households with pets. [218]
Public Law 104-321
Congress granted consent for the Emergency Management Assistance Compact (EMAC). EMAC are agreements between Delaware, Florida, Georgia, Louisiana, Maryland, Mississippi, Missouri, Oklahoma, South Carolina, South Dakota, Tennessee, Virginia, West Virginia, the Commonwealth of Puerto Rico, the District of Columbia, and all U. S. territorial possessions to provide assistance during an emergency situation. It also includes providing emergency services, evacuation shelters, National Guard personnel, and any other government aid or personnel required. The requesting state is required to compensate for all services rendered.[219]
Jones Act
This requires only United States flag ship vessels to transport goods between the coasts of the United States.[220]
Policy Issues
Lack of Enforcement
These policies make the State responsible for enforcing these standards but the States are reluctant to hold people liable for failing to meet these guidelines. The federal government does not have guidelines to hold States responsible for failing to enforce these standards.
Funding The acts did not include additional funding for building infrastructure to assist in meeting these guidelines. FEMA can assist in contracting and coordinating public transportation. Areas lack the amount of various routes and modes required to meet all of the established guidelines.
Timeline of Events
[edit | edit source]Each evacuation plan is unique to each case, as differences in scale and structures of the cities exist. Generally, the evacuation takes place 72 hours before the landfall of the hurricane, when the mayor of the city announces mandatory evacuation.
Usually, the hurricane watch condition follows 48 hours[221] before estimated landfall. Ideally, during this phase, people should review their evacuation routes and the items in their disaster supply kit, add or drop items based on their needs especially for children, or the elderly.
During the hurricane warning phase, 36 hours before the landfall of the hurricane the following steps should be taken: “follow evacuation orders from local officials” [222], communicate with family and friends to update them about your conditions, and follow the checklists provided by the city websites concerning preparedness in relation to where the landfall will hit first. The hurricane warning phase can be divided into four different sub-phases:[223]
36 Hours before landfall
During this phase, people should usually be constantly updated with the weather conditions and the emergency instructions, prepare the items for their disaster supply kit making sure to include water, food, batteries, first aid supplies for at least 72 hours. Moreover, people should plan on how to communicate with their families should there be an outage of power. Phone lines are usually overloaded, so it is more reliable to send texts. It is, in addition, recommended to keep the fuel tank of vehicles full in order to evacuate. In this phase, people should stock their vehicle with the emergency kits and supplies for the evacuation.[224]
18-36 Hours before landfall
During this phase, people should keep checking for updates concerning weather conditions and emergency instructions.[225] This would be the phase where people take care of removing lightweight objects from the perimeter of their houses, and take these inside the house. It is also recommended to trim or cut trees that could fall on buildings. Windows should be covered in case the storm will break the glass.[226]
30 Hours before landfall
People who evacuate, usually do so 30 hours before landfall, either by reaching the closest evacuation spot posted in the city website or by using the contraflow lanes[227] designated as the “evacuation route”. Usually, evacuations start with inland areas and then coast areas are the last ones to evacuate in order to help the flow of traffic.[228]
6-18 Hours before landfall
Weather and emergency updates should be be checked every 30 minutes during this phase and people should be charging all their devices in order to have full battery to communicate during the disaster.[229]
6 hours from landfall
At this point, if some of the people have not evacuated, they are recommended to be home and keep family and friends updated about their conditions. People should stay away from windows and should set the temperature of their fridges and freezers to the coldest option so that in case of power outage, the food can be stored for longer. In addition, people should check emergency communications, weather conditions and city websites for constant update about the disaster.[230]
Maps of Evacuation Routes
[edit | edit source]The Stafford Act requires that all areas have established evacuation routes including posted signs, primary routes and secondary routes, and established control measures to convert two way roads to one way roads. Below are links to Miami, New Orleans and Houston evacuation plans with best practices listed for each. [231]

Miami Evacuation Route[232]
- Clearly marked evacuation zones
- Well established primary and secondary routes
- Displays additional routes
http://www.floridadisaster.org/publicmapping/Evac/EVAC_MIAMI-DADE.pdf
New Orleans Evacuation Route[233]
- Map is interactive tailored to location
- Establish how many hours are required for evacuation
- It can be downloaded and used on mobile applications
http://www.contraflowmaps.com/
Houston Evacuation Route[234]
- Has a clear date to reevaluate the map
- Displays the flow of traffic during a evacuation
https://www.h-gac.com/taq/hurricane/documents/2017-evacuation-routes-map-small.pdf
Critical Failures and Best Practices
[edit | edit source]
Evacuation Control
Evacuation control is critical to a safe and effective evacuation. In September 2005 several counties in Texas had a mandatory evacuation order issued for several counties including those that were not in the direct path of the storm. Officials anticipated that only 800,000 people would evacuate and 1.2 million actually evacuated.[235] Most travelers ran out of gasoline on major evacuation routes causing further congestion. This spurred FEMA to institute policies requiring States to maintain fuel reserves for emergency evacuation purposes.[236] They also issued evacuation orders for inland counties prior to the coastal areas completing their evacuation. This caused extreme traffic congestion, public hysteria, and dangerous road conditions leading to 107 of the 113 deaths during Hurricane Rita being attributed to the evacuation.[237]
Best Practices
In years since several States have developed control measures to prevent evacuations turning fatal. Most States have developed evacuation zones with separate primary and alternate routes. States have also started factoring in congestion from neighboring counties when developing evacuation timelines like New Orleans displays on their evacuation routes.[238] FEMA requires that supply deliveries of fuel and other essential resources are on pre-established routes.[239] During Hurricane Irma to ensure that hurricane evacuation routes were used critical supplies were only delivered along the routes.[240]
Vulnerable Populations

Evacuation plan policy makers should address the importance of evacuation planning for vulnerable populations. Vulnerable populations include but are not limited to people who are unable to self-evacuate in a car and those with specific or functional needs[241]. Vulnerable populations include elderly, hospitalized, children, homeless, and handicapped. During Hurricane Katrina nearly 1 million people evacuated by automobile within 48 hours. However, vulnerable populations, specifically elderly people, were not able to evacuate. Therefore, post Katrina disaster, evacuation planning for vulnerable populations requires a national policy response. As shown in a study, the failure of evacuation planning prior to Katrina caused over 1,800 deaths, of which 71% of the victims were over the age of sixty and 47% were over the age of seventy-five[242]. Ever since, evacuation planning for vulnerable populations has been a major policy issue to address. For this reason, the matter of vulnerable populations shifted to be a matter of not only sociology and emergency management, but also a discipline of transportation and planning. In fact, in 2006, the GAO (Government Accountability Office) carried out a study to address this issue in the policy making process. One of the study’s major findings was that one of the most critical challenges to address during evacuations was to identify appropriate transportation modes for vulnerable people.
Best Practices
The major problem identified by the GAO was that both state and local governments are not disposed to evacuate “transportation-disadvantaged populations”[243] because they lack preparation and organization of planning, training and exercising. In addition, another problem that had to be addressed was legal barriers, such as liability concerns, regarding roles of agencies and across jurisdictions. The post-Katrina disaster led various actors (city of New Orleans, together with public, nonprofit, state and federal agencies) to create the City Assisted Evacuation Plan (CAEP), which was tested during Hurricane Gustav in 2008. This evacuation program addressed specifically people with medical needs, who needed to be evacuated in a short period of time. In the case of Hurricane Gustav, they were transported to Belle Chasse Naval Air Field. In addition, the plan also focused to address the elderly, transporting them by Amtrak to the neighboring safe states. The homeless were also picked up from different locations in the city and transported to designated areas. The CAEP was created based on the lessons learned from Katrina concerning vulnerable populations and has become a “best practice” for this matter. In addition, the failure to include vulnerable populations within the evacuation plans, led Congress to pass the Post-Katrina Emergency Management Reform Act of 2006 mentioned above.
Fuel Availability

Fuel shortages have occurred during several evacuations. For example, during Hurricane Rita in 2005 some travelers were in traffic for over 36 hours unable to find fuel stations, clogging the evacuation routes once their vehicles ran out of gas.[244] Most travelers ran out of gasoline on major evacuation routes causing further congestion. This spurred FEMA to institute policies requiring States to maintain fuel reserves for emergency evacuation purposes.[245] Several oil refineries were shut down in the wake of Hurricane Harvey earlier this year cutting Florida off from its fuel reserves during the mass evacuation from Hurricane Irma. [246] Hurricane Irma was one of the largest evacuations seen in Florida’s history and many travelers were left stranded on the roads, 12 years after precautions were taken to prevent this occurrence.
Best Practices
As previously stated States are required to maintain fuel reserves for emergency situations. Unfortunately due to the refineries in Texas being shut down in the wake of Hurricane Harvey, Florida could not access its fuel reserves.[247] Florida’s Governor arranged for shipments to be rerouted from other States and provided police escorts for deliveries. They focused on resupplying evacuation routes and urged travelers to take only as much fuel as they required to get to safety. The President also waived the Jones Act of shipments of fuel delivered to Florida by ship.[248] Local law enforcement also made allowance for gas station owners providing them with police escorts if they were willing to wait to evacuate ensuring many others made it to safety. In spite of the fuel shortage in Florida measures were quickly utilized at all levels to assist in correcting the crisis.
Public Awareness and Media Influence
.jpg)
The media has been indicated as being one of the most important influences to make sure people evacuate when natural disasters happen.
A Congressional Research report claims that one of the first lessons learned from hurricane events is that “informing citizens about evacuation routes and shelter locations as part of a community preparedness activity can help reduce the amount of time a household takes to evacuate. Without this information, households are generally slow to react to an evacuation order”[249] However, further researchers have demonstrated that information alone does not guarantee best evacuation practices nor more people evacuating outside the danger zone. Major findings have been discovered through hypothesis testing of different issues[250] which are supposed to collaborate with information about the severity of the event. In 1985, FEMA started a National Hurricane Program to address these issues. Following is a summary of each problem identified when it comes to evacuation:
Perceived Risk and Evacuation Behavior
When the information conveyed to people about increased winds appears severe, then it will be more likely that people evacuate from the danger area. However, risk perceived from the storm surge does not have the same effect of the strong winds, meaning that people will not perceive the risk of surge as seriously as the strong winds leading to fewer people evacuating.
Information Sources about Evacuating
The media has a positive impact on evacuation pattern decisions of people that are within the official evacuation area. However, it has been shown that people that are out of the designated evacuation are less likely to evacuate. What made people outside the designated evacuation area make the decision of evacuating was the neighbor's behavior. The more neighbors evacuate, the more people from the same neighborhood do. This seems to increase the risk perception of the event.[251] Another source of information that has shown to be essential to increase evacuation has been the knowledge of designated evacuation areas; it has been shown that the more people know about the evacuation plan, evacuation location, the more likely it would be for people to evacuate.
Sociodemographic Characteristics of Evacuation
A study shows that “none of the social and demographic control variables (e.g., age, children in the household) have a significant effect on the evacuation behavior of the respondents inside or outside of an officially designated evacuation area.”[252] The only variable that seems to have significant weight was the age variable. The more elderly people in the household, the less likely they seem to evacuate.
Best Practices
All these studies about evacuation behavior and patterns can be helpful in implementing new policies as well as creating initiatives to modify these patterns and make sure everyone evacuates during natural disasters. The National Hurricane Program (1985) started by FEMA is one of these initiatives that helps protect communities through awareness. The major goals[253] of the program are training for emergency managers of state and local governments, and Federal agencies; and operations which provide support to both state and local managers during the hurricane event. It has been also useful to provide role assignments especially for state and local and federal agencies.
Evacuation Exercise
[edit | edit source]The class will break into groups of three and plan an evacuation of ten people from George Mason Arlington Campus. This plan must include node, routes used, food and shelter plan for all ten people, one person will have additional medical considerations. You will have 10 minutes to develop a plan using the internet and the class presentation.
Further Reading
[edit | edit source]Director, Hani S. Mahmassani; Center, Transportation; University, Northwestern. "Traffic jams during hurricane evacuations are entirely preventable". Quartz. Retrieved 2017-10-03.
"About the National Hurricane Center". Retrieved 2017-10-24.
nrf_massevacuationincidentannex.pdf (PDF), retrieved 2017-10-24
"Congressional Document". Retrieved 2017-10-24.
Stafford_ActselectHSA2016.pdf (PDF), retrieved 2017-10-24
"Transportation Systems Casebook/Evacuation Best Practices (Lessons Learned) - Wikibooks, open books for an open world". Retrieved 2017-10-24.
mass_evacuation_incident_annex_2008.pdf (PDF), retrieved 2017-10-24
Armey, Richard (2002-11-25). "H.R.5005 - 107th Congress (2001-2002): Homeland Security Act of 2002" (webpage). Retrieved 2017-10-24.
PLAW-109publ308.pdf (PDF), retrieved 2017-10-25
"What Is EMAC?". Retrieved 2017-10-26.
Cuite, Cara; Morss, Rebecca (2017-09-08). "Perspective | What to tell people to get them to evacuate before a hurricane hits". Washington Post. ISSN 0190-8286. https://www.washingtonpost.com/outlook/what-to-tell-people-to-get-them-to-evacuate-before-a-hurricane-hits/2017/09/08/09b1efc0-93e0-11e7-8754-d478688d23b4_story.html. Retrieved 2017-10-27.
"The Disaster Declaration Process | FEMA.gov". Retrieved 2017-10-27.
2017-evacuation-routes-map-small.pdf (PDF), retrieved 2017-10-28
"Appendix E: Best Practices - Catastrophic Hurricane Evacuation Plan Evaluation: A Report to Congress". Retrieved 2017-10-28.
"How Harvey made it harder to evacuate for Irma - Vox". Retrieved 2017-10-28.
"U.S waives Jones Act to secure fuel for hurricane responders". Reuters. 2017-09-08. https://www.reuters.com/article/us-storm-irma-shipping/u-s-waives-jones-act-to-secure-fuel-for-responders-to-hurricanes-idUSKCN1BJ2GE. Retrieved 2017-10-28.
Carpender, S. Kay; Campbell, Paul H.; Quiram, Barbara J.; Frances, Joshua; Artzberger, Jill J. (2006). "Urban Evacuations and Rural America: Lessons Learned from Hurricane Rita". Public Health Reports (1974-). 121 (6): 775–779. ISSN 0033-3549. JSTOR 20057041. Retrieved 2017-10-28.
"Hurricanes | Ready.gov". Retrieved 2017-10-28.
"Hurricane - NOLA Ready". Retrieved 2017-10-28.
Renne, John (2011). "Evacuation Planning for Vulnerable Populations: Lessons from the New Orleans City Assisted Evacuation Plan". Brookings Institution Press.
EVAC_MIAMI-DADE.pdf (PDF), retrieved 2017-10-28
"Contraflow Evacuation Maps - New Orleans, Louisiana". Retrieved 2017-10-28.
EVAC_MIAMI-DADE.pdf (PDF), retrieved 2017-10-28
"Contraflow Evacuation Maps - New Orleans, Louisiana". Retrieved 2017-10-28.
2017-evacuation-routes-map-small.pdf (PDF), retrieved 2017-10-28
Congressional Research Service (2011-09-04). Federal Evacuation Policy: Issues for Congress. Retrieved 2017-10-28.
Stein, Robert M.; Dueñas-Osorio, Leonardo; Subramanian, Devika (2010). "Who Evacuates When Hurricanes Approach? The Role of Risk, Information, and Location". Social Science Quarterly. 91 (3): 816–834. ISSN 0038-4941. JSTOR 42956432. Retrieved 2017-10-28.
Stein, Robert M.; Dueñas-Osorio, Leonardo; Subramanian, Devika (2010). "Who Evacuates When Hurricanes Approach? The Role of Risk, Information, and Location". Social Science Quarterly. 91 (3): 816–834. ISSN 0038-4941. JSTOR 42956432. Retrieved 2017-10-28.
Congressional Research Service (2011-09-04). Federal Evacuation Policy: Issues for Congress. Retrieved 2017-10-28.
"Post-Katrina Emergency Management Reform Act". Retrieved 2017-10-28. "40 Years Ago: The Disaster Relief Act of 1974". National Low Income Housing Coalition. Retrieved 2017-10-28.
References
[edit | edit source]
Keystone Pipeline
Summary
[edit | edit source]The Keystone Pipeline is a cross-border pipeline that is owned by TransCanada. The Keystone Pipeline System, stretching 4,324km (2,687 miles) in length, plays a key role in delivering Canadian and United States crude oil supplies to markets around North America.[254] The Keystone Pipeline System currently runs through the following states: North Dakota, South Dakota, Nebraska, Kansas, Missouri, Illinois, Oklahoma, and Texas.[255] The system is mostly known for the controversial expansion phase proposal, the Keystone XL Project. The Keystone XL (KXL) Project is a proposed 36-inch-diameter crude oil pipeline beginning in Hardisty, Alberta, and extending south to Steele City, Nebraska.[256] This project would be an additional extension of the current pipeline that is already present in the United States. The base Keystone Pipeline System, which went into service in July 2010, has already transported over 1.4 billion barrels of crude oil from where it is produced in Canada to key U.S. refining centers; KXL is expected to enhance this system.[257] Because the pipeline is a cross-border pipeline, the pipeline requires a Presidential permit. The Keystone would be an economic benefit to the United States; however, posing environmental threats to U.S. localities has caused the project to be highly controversial. The project has been debated in Congress over the presidency of Barack Obama and has continued into the presidency of Donald Trump. To date, under the Trump administration, the U.S. Department of State has signed and issued a Presidential Permit to construct the Keystone XL Pipeline.[258]
Annotated List of Actors
[edit | edit source]TransCanada
[edit | edit source]TransCanada is a Canadian owned energy company that primarily operates in the natural gas, oil and power industries. The company currently owns and operates the Keystone Pipeline.[259] The company has been responsible for transporting more than 1.5 billion barrels of crude oil since operations began in 2010. TransCanada has submitted multiple iterations of the Keystone XL pipeline. After President Barack Obama refused a Presidential Permit to the company, TransCanada filed a claim under the NAFTA trade agreement stating the president's denial of the permit was unwarranted.
States
[edit | edit source]Nebraska
[edit | edit source]Landowners filed a suit to stop TransCanada from building the Keystone XL on the grounds that a Nebraska law was unconstitutional. The law allowed the governor to give TransCanada eminent domain power in the state. The lower circuit court ruled in favor of the landowners causing a stop to the proposed route of the pipeline. However, the case was overruled by the Nebraska Supreme Court, indicating the law was not unconstitutional. This lead to the push for the Obama Administration to finally make a decision on the whether or not TransCanada’s application would get approved.
Montana
[edit | edit source]In 2012 Montana approved easements to let the Keystone XL pipeline cross state-owned land, including the Missouri and Yellowstone rivers.[260]
South Dakota
[edit | edit source]In 2010, South Dakota Public Utilities Commissions granted a permit, with 50 conditions, for the construction of the Keystone XL Pipeline in western South Dakota.[261]
Department of Energy
[edit | edit source]The Department of Energy, under the Office of NEPA Policy and Compliance was responsible for evaluating the potential impacts of the Keystone XL pipeline and related facilities.
Department of State
[edit | edit source]The Secretary of State has the authority to issue Presidential Permits for cross-border liquid (water as well as petroleum product) pipelines and other cross-border infrastructure.[262] The Department of State has issued permits for the Keystone Pipeline System under Presidents George W. Bush, Barack Obama and Donald Trump.
The Environmental Protection Agency
[edit | edit source]The Environmental Protection Agency is an independent agency under the Executive Branch. The primary role is to review the environmental impact statements (EIS) of other federal agencies and to comment on the adequacy and the acceptability of the environmental impacts of the proposed action.[263] Several environmental studies were done to evaluate the proposed project and multiple Draft Supplemental Environmental Impact Statements were released prior to the Final Environmental Impact Statement.
The United States Congress
[edit | edit source]The United States Congress became involved in the Keystone Pipeline during the Obama Administration. The U.S. Senate approved TransCanada to build the Keystone Pipeline which was controversial because the legislative branch overstepped in a decision that was to be made by the executive branch. While the bill was passed, the President did counter and veto the bill.
President George W. Bush
[edit | edit source]President was primarily involved in the early stages of the Keystone Pipeline System. Before the November 2008 elections, George W. Bush, Jr. approved the construction of the Keystone Pipeline. In March, 2008 the Department of State issued a Presidential Permit authorizing TransCanada Keystone Pipeline LP to construct, operate and maintain facilities related to the Keystone crude oil pipeline project.[264]
President Barack Obama
[edit | edit source]President Barack Obama had the longest tenure with the pipeline. He is most known for the controversy revolving around the lengthy process to the decision of whether or not the pipeline application would be approved. Ultimately, president Obama rejected TransCanada’s application to build the XL pipeline due to several reasons. The White House released a statement from the President on November 6, 2015 stating that the pipeline would not make a meaningful long-term contribution to the economy; the pipeline would not lower gas prices for American consumers; and shipping dirtier crude oil into the country would not increase America’s energy security.[265]
President Donald Trump
[edit | edit source]President Donald Trump campaigned in the 2017 presidential election by promoting the construction of the Keystone XL. Months after being in office, president Trump approved the construction of the Keystone XL by presidential memorandum. The memorandum included language that “invited TransCanada to promptly re-submit its application to the Department of State for Presidential permit, directed the Department of State to take all actions necessary and appropriate to facilitate its expeditious review, and required a decision to be made within 60 days of TransCanada’s application submission."[266]
Timeline of Events
[edit | edit source]July 2008: TransCanada Corp. and ConocoPhillips, joint owners of the Keystone Pipeline, proposes a major extension to the network, dubbed Keystone Pipeline XL.[267]
March 2010: The National Energy Board [Canadian Board] approves TransCanada’s application for Keystone XL, with 22 conditions regarding safety, environmental protection and landowner rights.[268]
April 2010: The U.S. State Department releases a draft environmental impact statement stating the Keystone XL would have a limited effect on the environment. Months following, the Keystone XL opposition put political pressure on elected officials and major Department stakeholders to reconsider the stance.[269]
June 2010: TransCanada completes phase one of the Keystone Pipeline System, from Hardisty, Alberta to Wood River [refinery in Roxana, Illinois] and Patoka, Illinois and begins operation in July.[270]
July 2010-March 2011: The State Department extends its review of the Keystone, indicating that the federal agencies involved need more time to weigh in before a final environmental impact assessment can be released.[271]
February 2011: The second phase of the Keystone Pipeline System is completed and begins commercial deliveries of crude oil to Cushing, Oklahoma. The project consisted of an extension from Steele City, Nebraska to Cushing, Oklahoma.[272]
August 2011: The State Department releases its final environmental assessment, which reiterates that the pipeline would have limited environmental impacts.[273]
November 2011: The State Department indicates that TransCanada must reroute the Keystone XL to avoid an ecologically sensitive region in Nebraska and TransCanada agrees.[274]
December 2011-January 2012: Members of Congress pass a bill with a provision stating that President Barack Obama must make a decision on the pipeline’s future in the next 60 days. The President rejects the project due to the insufficient amount of review time needed to review the new proposed route. TransCanada is given the opportunity to resubmit another application for review, if desired.[275]
May 2012: TransCanada applies for Keystone XL Presidential Permit which includes an alternative route in Nebraska as soon as that route is selected.[276]
January 2013: The Governor of Nebraska approves the new route of the Keystone Pipeline and sends the recommendation to President Barack Obama and Secretary Hillary Clinton.[277]
January 2014: Keystone Pipeline System begins delivering crude oil to refineries on the Gulf Coast of Texas with the completion of the Gulf Coast Pipeline project (phase three).[278] The State Department releases Final Supplemental Environmental Impact Statement for the Keystone XL Project.[279]
February 2014: A Nebraska judge rules that the law that allowed the governor to approve Keystone XL over the objections of landowners was unconstitutional.[280]
January- February 2015: The Supreme Court of Nebraska strikes down the lower-court decision.[281] The U.S. Senate approves a bill to build Keystone XL; however the bill was vetoed by the President in February.[282]
November 2015: The Obama Administration rejects TransCanada’s application to build the Keystone XL pipeline.[283]
January 2016: TransCanada announces that it would file a Notice of Intent to initiate a claim under Chapter 11 of the North American Free Trade Agreement (NAFTA) in response to the U.S. Administration’s decision to deny a Presidential Permit for the Keystone XL Pipeline on the basis that the denial is arbitrary and unjustified. TransCanada also files a lawsuit in the U.S. Federal Court in Houston, Texas, asserting that the President’s decision to deny the construction of the pipeline exceeds his power under the U.S. Constitution.[284]
April 2016: A spill is discovered in an underground section of the pipeline in South Dakota. TransCanada estimates a 16,800 gallon spill in Hutchinson County.[285]
January 2017: President Trump signs a presidential memorandum to allow the TransCanada to construct the Keystone XL pipeline extension.[286]
Maps of Locations
[edit | edit source]Keystone XL and Keystone Pipelines
Revised Nebraska Keystone XL Route
Policy Issues
[edit | edit source]Environmental Impacts
[edit | edit source]The leading issue that caused the pipeline to get denied a Presidential Permit was due to the environmental (environmental and social) impacts that the construction of the XL pipeline would cause. The construction would not only displace individuals who owned land in the right of way of the pipeline, but also pose potential threats to wetlands, and endangered species. A particular area of concern that required TransCanada to resubmit an application for Presidential Permit was the Northern Plains aquifer system and the Sandhills aquifers. The Northern Plains aquifer system supplies 78 percent of the public water supply and 83 percent of the irrigation water in Nebraska and approximately 30 percent of water used in the U.S. for irrigation water and agriculture.[287] Considering the close proximity to the pipelines original route, any major underground oil spill could be detrimental to the aquifer system.
Over the last several years there has been a debate over nonrenewable and renewable energy resources; however, there has been more of a push for the United States to invest in cleaner energy. The concern with transporting crude oil is related to the concerns of pollution. The extraction and refining process of crude oil produce carbon dioxide emissions. Opponents argue “oil derived from tar sands can have serious impacts on climate even before it is burned – estimates show that extraction and processing of tar sands generates between 5 to 10 times more carbon dioxide emissions than conventional oil.” [288]
When looking at social environmental impacts, landowners were mostly impacted by the threat of eminent domain. Eminent domain is the process where private property may be taken from an owner for use of the public. Private property that would not be completely consumed faced impacts of having land disturbance. In Nebraska, farmers were concerned with the possibility of farming land and wells being polluted by oil spills. Landowners were concerned that if a leak were to happen the State of Nebraska would have to bear the consequences of the damage. “The worry is compounded by TransCanada’s own admission that their leak detection system only identifies leaks of more than 1 percent of flow;” such a small percentage of disrupted flow could mean 8,000 or 9,000 barrels per day could leak and go undetected, and could last for quite a while.”[289]
The environmental impacts of this project primarily led to the slowdown and ultimately permit denial under the Barack Obama Administration. The Department of State’s Environmental Impact Statement indicated that the environmental impacts would be limited and suggested that the construction be re-routed to avoid any issues related to ecological concerns. The Executive Summary stated that project would need to be implemented in accordance with applicable regulatory requirements of federal, state, or local permitting agencies.[290]
Economic & Energy Incentives
[edit | edit source]The argument for the XL pipeline revolves around economic benefits such as job growth and energy security. According to a Canadian study of future oil production from Alberta tar sands, production could grow from 1.2 million barrels per day to over 3.3 million barrels per day by 2020; these numbers make a compelling case for extending America’s use of Canadian tar sands in order to serve our continually growing energy needs.[291] This argument coincides with the argument that the Keystone XL would allow the United States to develop more energy security. The extension to the pipeline would increase the diversity of the U.S. petroleum supply. The application submitted by TransCanada argued that the pipeline would allow the U.S. to decrease its dependence on crude oil from Mexico and Venezuela, the two largest oil exporters into the U.S. Gulf Coast.[292] While some point that the pipeline would give the U.S. energy security; international events would still have an impact on prices. Proponents of the construction of the pipeline rely heavily on economic benefits rather than energy security.
The Keystone expansion would provide net economic benefits from improved efficiencies in both the transportation and processing of crude oil of $100 million-$600 million annually, in addition to an immediate boost in construction employment.[293] While numbers aren’t exact, TransCanada has noted that the majority of the job creation would steam from the construction of the pipeline. During the construction, KXL would create significant employment benefits in the form of tens of thousands of well-paying jobs and associated earnings throughout the United States.[294] While job growth may be only short term, the tax revenue generated would benefit the states impacted by the construction of the pipeline. The total estimated property tax from the proposed project in the first full year of operations would be about $55.6 million spread across 27 counties in three states.[295] Furthermore, when looking at the economic benefits at a national level, the U.S. would also be impacted positively. The construction of KXL is expected to contribute approximately $3.4 billion to the U.S. GDP.[296]
Politics and Conflicts between Congress and the President
[edit | edit source]The debate over the Keystone XL pipeline was just one example of the recent highlighted tensions between the legislative and executive branches of the federal government. Republicans in the House and Senate have long supported the Keystone XL pipeline, first as a way to promote American energy independence during an era of high oil prices, then as a method to create jobs. When Republicans took the majority of the seats in the Senate in the 114th Congress, they had control of both houses in Congress for the first time since the 109th Congress in the early 1990s. This lead to the party pursuing a number of their priorities, including Senate Bill 1 to approve the pipeline which President Obama vetoed.
Earlier in the process this conflict manifested itself when Congress set a deadline on Keystone XL approval, which caused the Administration to deny the necessary border crossing permit because it was unable to make a determination by the deadline. Eventually President Obama rejected the pipeline citing the impacts of climate change.
While environmental reasons were cited for the pipeline’s permit denial, Keystone KL also evolved into a powerful political symbol as shown by the vicious political debate that at times dwarfed the practical environmental concerns. Eventually, as the economy improved and oil prices fell, many of the practical positives of approving the permit fell away clearing the way for President Obama to make a decision based on macro level environmental and political concerns.
The Role of the Nebraska Legislature
[edit | edit source]Given the greatest area of environmental concern regarding the pipeline occurred where it crossed Nebraska, the state of Nebraska’s unicameral legislature was heavily involved in the approval process. Nebraska Governor Dave Hineman sent a letter to President Obama in September, 2011 requesting the federal government reroute the pipeline around the Sand Hills region of the state. That November, Governor Hineman called a special session of the state legislature to address the environmental concerns over the pipeline which resulted in a new pipeline sitting law that required TransCanada to apply from the state utility commission. [297] The pipeline, now revived, is still pending approval by the Nebraska Public Utility Commission, which has until November 13, 2017 to make a final decision.
Nebraskans are fiercely opposed to the pipeline based on concerns that it will impact their soil quality, hurt their property values, and endanger the Ogallala aquifer beneath the Sand Hills region. The aquifer stretches beneath most of the state, running from South Dakota to Texas, and serves as one of the world’s largest underground sources of fresh water. While there was some contention in the state of Nebraska, the state’s congressional delegation largely supported the measure.[298]
Narrative of the Case
[edit | edit source]Presidential Permitting
[edit | edit source]Executive Order 11423 grants the Secretary of State the authority to receive applications for Presidential permits for land border crossing facilities. The order states “. . . the proper conduct of the foreign relations of the United States requires that executive permission be obtained for the construction and maintenance at the borders of the United States of facilities connecting the United States with a foreign country.” This authority applies to all new border crossings and to all substantial modifications of existing crossings at the international border.[299]
The Department of State coordinates with the relevant federal agencies to evaluate proposed crossings and make a recommendation to the president whether the crossing would be in the national interest. This is known as a National Interest Determination (NID). In Keystone XL’s case this included evaluation of the potential effects the pipeline would have on energy security; environmental and cultural resources; the economy; foreign policy, and other factors. The environmental and cultural impact are determined based on the Environmental Impact Statement issued by the Environmental Protection Agency pursuant to the National Environmental Policy Act (NEPA).[300]
TransCanada initially applied for a Presidential Permit in 2008. At that time concerns were expressed regarding the pipeline’s impact on the Sand Hills region of Nebraska, which lead the state to implement new requirements that would change the pipeline’s route. Faced with a Congressionally imposed deadline to make a decision, the State Department denied the initial permit in January 2012 due to lack of information regarding the impact on the Sand Hills region.[301]
A second permit application was made by TransCanada in May, 2012 which triggered a new NEPA process and the issuance of a new Environmental Impact Statement (EIS).[302]
Environmental Impact Statement (EIS)
[edit | edit source]The National Environmental Policy Act (NEPA) requires the development of an Environmental Impact Statement (EIS) for certain actions “significantly affecting the quality of the human environment”. The role of the EIS is to provide federal agencies with detailed information concerning significant environmental impacts of federal actions.
In 2010 letter to the State Department, EPA said that the draft EIS released for public comment was not thorough enough and suggested significant revisions prior to the State Department making a National Interest Determination (NID). [303] The final EIS was released in August 2011 and said the revised pipeline with the new route avoiding the Sand Hills region would have no significant impact to most resources in the region.[304] In November, 2011 the State Department said it would postpone the NID until it could further evaluate the impact on the environment. In December, 2011 Congress passed legislation requiring President Obama to issue a decision on the pipeline within 60 days. In January, 2012 President Obama rejected the permit application saying that the deadline prevented a full assessment of the pipeline’s impact.[305]
Revised Route
[edit | edit source]In May 2012 TransCanada submitted a new permit request containing a revised route. The new route was devised in consultation with Nebraska citizens and the state legislature, as well as the company’s desire to minimize disturbance to the area. A supplemental EIS was developed and issued, which found there would be no significant impact to regions along the revised route. Attempts were made by the House of Representatives in 2013 and 2014 to force approval of the pipeline, but were rebuffed by the Democratically controlled Senate.[306] In January, 2015 the House and Senate passed a bill approving the pipeline, which President Obama vetoed in February, 2015 citing that he decision was within the purview of the executive branch. In November, 2015 President Obama rejected the pipeline’s application citing the impacts of climate change.[307]
A New Administration
[edit | edit source]On January 24, 2017, shortly after his inauguration, President Trump signed a presidential memorandum clearing the way for the Keystone XL pipeline. The memorandum invited TransCanada to re-submit their application for a presidential permit and directed the Secretary of State to issue a NID within 60 days of receiving the application. The memorandum also directed the Secretary to consider the last Supplemental EIS completed to meet the requirements of NEPA. Two days after the issuance of the memorandum, TransCanada resubmitted their application.[308]
On March 24, President Trump approved the pipeline’s application.[309] TransCanada however has not indicated whether they intend to go forward with the pipeline. Citing changing oil markets from when their initial application was submitted in 2008, the company says they plan to make a decision before the end of 2017 as to whether they will move forward with the project. Crude prices have dropped from nearly $140 a barrel at the time of the initial application to $51 a barrel today. Part of this price fall was driven by the development of domestic oil production in the United States creating a glut in the market.[310]
Discussion Questions
[edit | edit source]Engagement with state and local stakeholders was relatively limited at the beginning of the project, how would earlier external stakeholder engagement have permitted some of the difficulties Keystone XL experienced?
What role do you think the NEPA process played in the political machinations that occurred? Do you think a more streamline NEPA process would have resulted in less political battles?
Frustrated with the Executive branch, Congress tried to approve the pipeline against President Obama’s wishes and faced a veto. Should Congress have a role to play the National Interest Determination process?
References
[edit | edit source]
Privatization of Air Traffic Controllers
Summary
[edit | edit source]Air traffic control (ATC) is the ground-based system that manages air traffic. The primary role of ATC is to manage airspace, manage air traffic, and to prevent collisions between aircraft. In the United States, ATC is a government service provided by the Federal Aviation Administration (FAA) that relies on government funding. Around the world there are other models used for ATC; Germany uses a government owned corporation, the United Kingdom uses a for-profit corporation, and Canada uses a non-profit corporation. Each model has it's merits and disadvantages but the issue of privatization ultimately comes down to the funding model used.[311]
In the United States, we must consider a model that meets the needs of our large air transportation system and is able to provide stable funding and be consistently applied to all airports. Currently, funding is not completely stable as the FAA relies on federal dollars which are at risk of being lost to budget issues and politicization of budget items. It is critical that ATC has stable funding so that it may continue to work at safe and efficient levels. The other major criteria that a model must meet is being able to handle the size and volume of air transportation in the United States, currently the US ATC system handles over 16 million flights across 19,600 airports every year and that number is only going to increase.[312]
Annotated List of Actors
[edit | edit source]Actors in Favor of Privatization of Air Traffic Controllers
[edit | edit source]President Donald Trump
[edit | edit source]Announced a plan to privatize ATC on June 5, 2017
Bill Schuster
[edit | edit source]Republican Congressman from Pennsylvania presented the bill H.R. 2997, Privatizing ATC, on the House of Representative floor on June 22, 2017.
Airlines for America (A4A)
[edit | edit source]Spent 1.6 million on lobbying for privatization of ATC. They believe the slow adoption of technology is hindering air traffic efficiency. Members include: Alaska Airlines, American Airlines, Atlas Air Worldwide, FedEx, UPS, United Airlines, Hawaiian Airlines, Jet Blue, Southwest, and Air Canada.
Actors Against Privatization of Air Traffic Controllers
[edit | edit source]Federal Aviation Administration
[edit | edit source]Against privatization of air traffic controllers because the private company would lack oversight and control.
Delta Airlines
[edit | edit source]Against bill because they believe the airline companies are the problem of congestion, at or near airports in the sky and the ground, due to loading procedures. In 2017 Delta’s antiquated computer system crashed, grounding hundreds of flights.
Alliance for Aviation Across America
[edit | edit source]A nonprofit lobbying firm against privatization of ATC. They fear privatization of ATC will bring user fees which would be too high for small companies to pay. There members include: Air Care Alliance (ACA), Aircraft Electronics Association, Aircraft Owners and Pilots Association (AOPA), American Air Campers Association, American Association of State Highway and Transportation Officials (AASHTO), Angel Flight Mid-Atlantic, Arkansas Aerospace and Defense Alliance, Aviation Council of Pennsylvania, Charlie Bravo Aviation, Experimental Aviation Association (EAA), Flight School Association of North America, Granite State Airport Management Association (GSAMA), Helicopter Association International, League of Rural Voters, Management Association for Private Photogrammetric Surveyors (MAPPS), Medimpact, National Air Transportation Association (NATA), National Business Aviation Association (NBAA), National Farmers Organization (NFO), National Farmers Union, National Grange, Popular Rotorcraft Association, Small Business and Entrepreneurship Council, Society of Aviation and Flight Educators (SAFE), Texas Aviation Association, Universal Weather and Aviation, U.S. Cattlemen’s Association, Veterans Airlift Command, West Virginia Coal Association, Wheeling Area Chamber of Commerce, and Wolf Aviation Fund.
Timeline of Events
[edit | edit source]1926- Air Commerce Act- regulated aviation economics, safety, and air traffic controllers.
1936- Federal Government took over en-route air traffic control, while airports were controlled locally.
1958- Federal Aviation Agency (FAA) created in response to air traffic control radar.
1970- Airport and Airway Trust Fund (AATF) created to provide resources to the aviation through fuel and ticket taxes.
1982- Airport and Airway Improvement Act which reorganized the aviation taxes on the usage of funds.
1983- First discussion of privatization of air traffic controllers by the Reagan administration but was shot down because no model had ever been tried before.
1985- Airlines start talking about lobbying for privatization of ATC.
1986- Congress passes Aviation Safety Commission Act which looked at “how the Federal Aviation Administration may most effectively perform its responsibilities and increase aviation safety.”
1987- New Zealand becomes the first country to corporatize ATC.
1988- FAA publishes report recommending the “FAA be transferred from USDOT and be established as a user-funded authority.”
1993- Bill Clinton suggests government-owned corporation supported by user fees and governed by stakeholders.
1995- Representative Norman Mineta (D-CA) introduced H.R. 1441 which separate ATC personnel to a separate corporate entity, collecting user fees and issuing revenue bonds.
1996- National Civil Aviation Review Commission that was tasked to perform an independent assessment of FAA financial requirements.
1996- Creation of NAV CANADA as a nonprofit user co-op private corporation.
1997- The Mineta Commission Report was released and suggested “broad and sweeping changes in the ways the FAA was managed”.
2001- British became the first enter into a Private-Public Partnership (P3) for ATC.
2009- Proposal to move toward user-fee to fund the ATC but only the large commercial airlines would pay it but went nowhere.
2017- President Donald Trump proposes privatization of ATC.
2017- Bill Schuster takes bill H.R. 2997 to the House of Representative floor to privatize ATC.
Graphics
[edit | edit source][105]Map of NextGen landing path compared to conventional landing path
[106]Comparison of current ATC system with NextGen system
Policy Issues
[edit | edit source]Current Legislation
[edit | edit source]HR 2997- in June, 2017 Representative Bill Schuster (R-PA-9) introduced a bill titled "21st Century Aviation Innovation, Reform, and Reauthorization Act" (AIRR Act). The chief goal of this bill is to establish the American Air Navigation Services Corporation (AANSC), a non-profit corporation that would take over all ATC duties and equipment by October, 2020. Currently, HR 2997 has 22 cosponsors and no scheduled hearings or votes as of November, 2017.[313]
Funding
[edit | edit source]Currently funding is one of the most contentious and important issues in deciding on an ATC management model. Under the federal system the US currently employs, funding comes from the federal budget which must be approved by congress. The advantage of this funding model is that it separates funding from usage and allows the FAA to lobby for the amount of money they need to maintain critical systems. The major disadvantage of this model is that funding can be late or inconsistent depending on congress, during a government shutdown funding can be frozen and employees aren't getting paid to do their critical jobs. Funding can also be politicized, if a politician or group wants to bleed out the FAA then they can by restricting federal funding.
In a private system, funding is achieved by collecting usage fees and ticket fees. There are many ways to do this such as Nav Canada's method of collecting fees based on weight of aircraft and distance flown.[314] The advantage of usage fee based funding is that it scales with use and remains consistent as long as flight load remains consistent, while this may be an issue in some countries, it is unlikely to be an issue in the US which already handles over 88% of all air traffic.[315] However, according to a Delta Airlines report this model will not save the customers any money and may lead to a 20-29% increase in ATC fees on tickets. The same study showed that Canadian tickets saw a 59% increase in ATC fees and UK fliers saw a 30% increase.[316]
Equity
[edit | edit source]Currently, the United States has roughly 4000 airports that Bureau of Transportation Statistics classifies as rural. These airports serve small communities, have low passenger usage, and can be vital to the health of a community, especially in states like Alaska.[317] General aviation and rural flights pay less into the ATC and de facto and de jure subsidized by the FAA and federal government so that this critical access to these airports may be maintained. According to the Delta study, privatization will favor larger airports that pay more into the system. This will cause rural airports to shrink, limit landings and take offs, and eventually close forcing users to potentially drive hundreds of miles to large hubs, a solution that's not always an option in rural America. This issue of rural airports struggling has already been observed in the UK following their privatization and would only be amplified by the sheer size of the United States.[318]
Control
[edit | edit source]Control of the private ATC system is an important consideration. Currently, the ATC system is overseen by the FAA and reports to federal government oversight. In a private model, ATC will by overseen by a corporate board and under HR 2997, will be subject to government oversight. However, the downfall is that the board can be taken over and controlled by the major airlines who will be able to run ATC system in a way that is favorable to their corporation rather than be favorable to the public and to the needs of all air transportation users. From the start, there would be no competition and the ANSC would be a total monopoly, able to do whatever it wants with minimal oversight. This lack of oversight and potential market failure could leave tax payers stuck with the bill as the ATC system is inherently too big to fail.[319]
Narrative of the Case
[edit | edit source]What is NextGen?
[edit | edit source]NextGen is an incremental program planned to incorporate precision satellite navigation and surveillance, digital networked communication, and an integrated weather system. This sophisticated program is acquiring integrated air traffic control system, developing new flight procedure, and creating and maintaining new supporting infrastructure. NextGen will require airlines and others to invest in up-to-date avionics and other technologies to take advantage of NextGen benefits.[320]
Presidential Permitting
[edit | edit source]President Donald Trump is likely to announce a proposal to privatize ATC. He is expected to push for the separation of ATC operation from the FAA to move and improve the U.S airlines. The main issue that the FAA current software’s is insufficient; therefore, the change will improve the ATC system from radar and voice-based communication to a system based on satellite navigation and digital communication. The administration looks at the ATC system as technology business within the FAA. The separation of the system is meant to speed up the modernization to update the ATC system.[321]
The AIRR act will help ensure a modern, safe system that benefit passenger and the economy and will keep America competitive in a vital industry. President Trump and his advisor argued that revolving off air traffic control from the FAA would accelerate the deployment of NextGen technology while freeing the agency to fulfil its core function as a safety regulation.[322]
On the other hands, according to the Government Accountability Office (GAO), privatizing air traffic control would create problems with how the FAA and Department of Defense cooperate on air system security. Another GAO report questions about how quickly safety roles and responsibilities could be split between a privatized ATC entity and the FAA as the safety regular.[323]
Privatizing Air traffic Control and its Impact to the Rural Community
[edit | edit source]President Trump and other support the idea of privatizing air traffic control plan that would put the management of U.S airways in the hands of a private board and bring funding through taxes and fees. Airlines Company argues that the privatization would allow the antiquated air control system to upgrade and respond more quickly to changing technology. But an alliance of small airports says that privatizing would dramatically reduce service for rural areas.[324]
Nearly three-quarter of the U.S land found in a rural area. Rural industries like food production, firefighting, flight training, and disaster relief are critically dependent on smaller aircraft. This is not just an issue that affects some community; it changes all the ability to keep industries alive. Privatizing ATC can gain a lot of investment to the infrastructure in a small airport because rural areas are America lifeblood. Moreover, this type of structure airlines would have the ability to implement a host of new fees and taxes, which can decimate general aviation to rely on late user fees.[325]
Effects on Delays and Costs
[edit | edit source]The most significant contributor to delays is not air traffic control. An aviation expert Michael Baiada Saied “instead of focusing on privatization, the question Congress and the (GAO) should be asking first is what causes delays. Unfortunately, the (ATC) system is too often scapegoat for airline’s problems”. According to data from the Department of Transportation in 2015, the airlines were responsible for 323 to 454 flight delays. According to Michael Baiada, “the solution to airline delays must rest with the individual airlines and their adoption of operational excellence to drastically improve their performance, blocking, and tackling”[326]
In addition, According to senators Ed Markey and Richard Blumenthal highlighted that “the data from the Department of Transportation reveals airline problems, including technical glitches and mechanical failures, those two reasons are the leading causes of airline delays; the surpassing weather can cause delay”.[327]
Security Concerns with Privatization
[edit | edit source]According to the U.S Department of defense Policy Board on Federal Aviation, air traffic control would create problems with how the FAA and Department of Defense cooperate on air system security. Moreover, they raised questions about safety roles and responsibilities could be split between a privatized ATC entity and the FAA in safety regulation. The issue of coordination is developing and implementing new procedures and flight standards, and highly skilled staff.[328]
In addition, according to Fast Company, hackers already probe aviation systems looking for weaknesses, and security experts believe it is only a matter of time before cyber attacks occur. Therefore, privatizing ATC will enhance the security software to make sure the system will not fall.[329]
Discussion Questions
[edit | edit source]- Do you trust the big airline companies to run our nation’s air traffic control system? Why or why not?
- Can a private ATC be equitable in the United States? Why or why not?
- Does the US even need privatization?
- Are there any public solutions to the issues privatization seeks to solve?
References
[edit | edit source]Full references forthcoming following technical issues
Revenue Adequacy
Summary
[edit | edit source]As it did with most industries the heavily regulated environment era left railroad companies in a detrimental financial state. In times pre the Staggers Act of 1980, in the early 1970’s, the rail industry experienced financials hardships due to regulation. Rail companies were unable to adjust rates, merge or abandon obsolete services. Efficiency and reliability were among the major problems and some railroad companies began to go bankrupt. The first concern of “Revenue Adequacy” was first rooted in the 1976 Railroad Revitalization and Regulatory Reform Acts. The section of this act dealt with tasking the Interstate Commerce Commission (ICC) with developing “standards and procedures for the establishment of revenue levels adequate to cover total operating expenses including depreciation and obsolescence, plus a fair and economic profit or return (or both) on capital employed businesses.” The Interstate Commerce Commission in 1979 defined revenue adequacy as a rate-of-return on investment between seven and ten percent. Yet at that time only 13 of the 36 Class 1 railroads had reached those levels. The declining state of freight railroad bred concern for changes to occur. This in turn led to the passage of the Stagger Act of 1980 which was to “provide for the restoration, maintenance, and improvement of the physical facilities and financial stability of the rail system of the United States.[330]” This case study will give a comprehensive overview of concept of revenue adequacy, the cost and benefits to obtaining revenue adequacy and its impacts on the rail industry.
List of Actors
[edit | edit source]US Government
[edit | edit source]Surface Transportation Board- An independent adjudicatory and economic-regulatory agency charged by Congress with resolving railroad rate and service disputes and reviewing proposed railroad mergers. The agency has jurisdiction over railroad rate and service issues and rail restructuring transactions (mergers, line sales, line construction, and line abandonments); certain trucking company, moving van, and non-contiguous ocean shipping company rate matters; certain intercity passenger bus company structure, financial, and operational matters; and rates and services of certain pipelines not regulated by the Federal Energy Regulatory Commission. The agency has authority to investigate rail service matters of regional and national significance. STB was created on January 1, 1996 by the ICC Termination Act of 1995, the Board is the successor to the former Interstate Commerce Commission (1887-1995) and was administratively aligned with the U.S. Department of Transportation from 1996 to mid-December 2015. The STB Reauthorization Act of 2015 established the STB as a wholly independent federal agency on December 18, 2015. [331]
Major Class 1 Railroad Companies
[edit | edit source]BNSF Railway - One of the largest freight rail lines which is a product of about 390 different railroad lines acquired over a span of 160 years; with the first line, Aurora Branch Line, starting in 1849. BNSF received their new name and a look in 2005.[332] Their staff consist of over 40,000 employees, they operate over 32,000 route miles in 28 states and 3 Canadian provinces and they serve two-thirds of the US, portions of Canada and key Mexican gateways.. In 2015 they had a total operating revenue of about 21.4 billion dollars.[333]
Canadian National Railway Company - Canadian National Railways - incorporated June of 1919, is the longest railway system in North America. It has approximately 19,000 route-miles in North America. Now known as Canadian National (CN), the former Crown Corporation expanded its holdings to include marine operations, hotels, telecommunications and resource industries. However, the core of CN was still its railway system, which had its origins in the amalgamation of five financially troubled railways during the years 1917–23: the Grand Trunk and its subsidiary, the Grand Trunk Pacific; the Intercolonial; the Canadian Northern; and the National Transcontinental. In 1995, CN was sold to private investors and it serves the cities and ports of Vancouver, Prince Rupert, B.C., Montreal, Halifax, New Orleans, and Mobile, Ala., and the metropolitan areas of Toronto, Edmonton, Winnipeg, Calgary, Chicago, Memphis, Detroit, Duluth, Minn./Superior, Wis., and Jackson, Miss., with connections to all points in North America.[334] In 2015 CN employed over 23,172 workers in Canada and the US and earned 12.6 billion in revenue. CN has one of the lowest operating ratio among Class 1 railroads based on 2015 year-end results.[335]
Canadian Pacific - was founded in 1881 to physically unite Canada and Canadians from coast to coast. By 1889 that mission had been fulfilled and the railway extended from coast to coast and the enterprise had expanded to include a wide range of related and unrelated businesses. Its 14,000 mile network extends from the Port of Vancouver in the Canada's West to The Port of Montreal in Canada's East, and to the U.S. industrial centers of Chicago, Newark, Philadelphia, Washington, New York City and Buffalo.[336]
Norfolk Southern - The history of Norfolk Southern spans to nearly two centuries of American railroading and its earliest predecessor was Charters South Carolina Canal and Rail Road which dates back to 1827.[337] They were the first company to computerized operations. Norfolk Southern is and has been one of the nation’s premier transportation companies. Norfolk Southern Railway operates approximately 20,000 route miles in 22 states and the District of Columbia. They serves every major container port in the eastern United States and provides connections to other rail carriers. Norfolk Southern operates the most extensive intermodal network in the East and is a major transporter of coal, automotive, and industrial products. [338]
Union Pacific - the first transcontinental railroad dating back to 1862 and is compromised from a series of mergers throughout the years. They are: Chicago & North Western Railroad, Missouri-Kansas-Texas Railroad, Missouri Pacific Railroad, Denver & Rio Grande Western Railroad, Southern Pacific Railroad and Western Pacific Railroad.[339] The Union Pacific Railroad now connects 23 states in the western two-thirds of the country. They service includes Agricultural Products, Automotive, Chemicals, Coal, Industrial Products and Intermodal. Union Pacific serves many of the fastest-growing U.S. population centers, operates from all major West Coast and Gulf Coast ports to eastern gateways, connects with Canada's rail systems and is the only railroad serving all six major Mexico gateways. They service over 10,000 customers, operating over 32,000 route miles and with over 40,000 employees.[340]
Time Line[341]
[edit | edit source]1887
Interstate Commerce Act of 1887 was enacted by major political parties and with the assistance of pressure groups. The act had the following 6 points. 1. Mandating of "just and reasonable" rate changes. (This was the traditional language of the Anglo-American common law). 2. Prohibition of discrimination in the form of either special rates or rebates for individual shippers. 3. Prohibition of discrimination or unjustified "preference" in rates for any particular localities or shippers or products. 4.Forbidding of long-haul / short-haul discrimination. Unless an exception was allowed by the Interstate Commerce Commission, no company might charge more for a shorter than for a longer distance on the same route (and in the same direction). 5.Prohibition of pooling of traffic or markets. 6. Establishment of a five-member Interstate Commerce Commission.[342]
1974
Congress passed the Regional Rail Reorganization Act of 1974 known as the 3R Act. This legislation provided interim funding and created a rail operator known as Conrail as a government funded private company. Under the 3 R Act an organization known as the United States Railway Association (USRA) prepared a final system plan which identified all lines from the bankrupt carriers that would be transferred to a new corporation known as The Consolidated Rail Corporation (CONRAIL).
1976
Congress approved Conrail’s Final System Plan as part of the Railroad Regulatory Reform Act of 1976. This law, known as the 4R Act was signed into law on February 5, 1976. Incidentally, the 4R Act turned over the ownership of most of the North East Corridor to Amtrak. Freight operating rights over this trackage was guaranteed to Conrail however.
April 1, 1976
Conrail began operations. Its mandate was to revitalize rail service in the Northeast and Midwest and operate as a for-profit-company. However, it must be noted that Conrail as a carrier did not begin a turn around until 1980 when the Staggers was passed.
October 14, 1980
In 1980 Congress passed the Staggers Act and President Jimmy Carter signed this piece of landmark legislation in October of that year. The Staggers Act named for Representative Harley O. Staggers of West Virginia deregulated the railroad industry and created competition among railroads and allowed railroads to compete with trucking companies. The Staggers Act granted greater pricing freedom, streamlined merger timetables between parallel or formerly competing carriers, expedited the line abandonment process, allowed multi-modal ownership and permitted confidential contracts with shippers. The passage of the Staggers Act allowed the railroads to divest themselves of their unprofitable passenger business and concentrate on their core activity, which is the movement of freight. At the time of the passage of the Staggers Act only 3 American railroads still operated their own passenger service. They were the Southern, Denver Rio Grande and Western and the Rock Island. By 1983 all 3 of those freight carriers opted to turn over their private service to Amtrak or in the case of the Rock Island, to commuter authorities.
Thus here we are in the 21st Century and the gold standard for freight carriers is revenue adequacy. This is not to say that controversy within the industry and between carriers and shippers does not exist.
October 23, 2008
In a decision released by the Surface Transportation Board (STB) the STB denied a petition filed by the Association of American Railroads (AAR) to institute a rulemaking proceeding to consider the use of replacement cost methodology in the Board’s annual railroad revenue adequacy determination.
September 8, 2015
The STB finds that the following Class I rail carriers were revenue adequate in 2014. BNSF, Grand Trunk Corporation, Norfolk Southern Combined Railroad Subsidiaries and the Union Pacific Railroad Company.
September 8, 2016
The STB found that based on a determination of a 9.61% cost of capital, the Board found that BNSF Railway Company., Grand Trunk Corp. (CN), Soo Line Corp. (CP), and the Union Pacific Railroad Co. were revenue adequate for 2015. CSX, Kansas City Southern and Norfolk Southern did not make the list. According to the STB news release “A railroad is considered to be revenue –adequate to at least the current cost of capital for the railroad industry, which for 2015 the board determined to be 9.61%. Congress directed the Board to conduct such revenue adequacy determinations on an annual basis.
Maps
[edit | edit source]Policy Issues
[edit | edit source]Measurability of Revenue Adequacy Part of the conundrum of both measuring revenue adequacy and defining which railroads meet that test, is that no economist can 100% accurately predict what the cost of capital will be next year, in two years, etc., Interest rates for commercial borrowing are subject to many outside variables. There is no clear way to continually measure revenue adequacy. The percentage railroad companies need in order to be deemed revenue adequate varies from year to year. In 2014 Norfolk Southern was considered a revenue adequate company and in 2015 they were not. Therefore with no clear continual way to measure, freight companies go into their calendar year not having a target percentage to reach for. All that is available to them is an algorithm. The concept that was developed was initially done at a time when the financial wellbeing of the freight industry was in peril. [343]
Economic Regulation
STB is currently planning to enact a revenue cap on freight railroads. This can potentially place the railroads in a state pre-Staggers state. A balanced regulatory structure is what has proven to work on both sides of the spectrum, protecting rail customer against unreasonable rates but still allowing freight railroads the freedom to make adjustments as the economy change. [344]
Regulatory Oversight
Railroad profitability may be used as a trigger for determining reasonableness of rates on particular rail shipments. Constraints had relatively little practical effect when it was introduced because there was a widespread of revenue inadequacies but since then railroads are being deemed more adequate. Profits used to determine rates opposed to economy will work in favor of the customer but it can potentially harm the fright railroad companies over time. [345]
Narrative
[edit | edit source]Class l:
Over time, the definition of Class l railroads has changed. As of 2014, the Association of American Railroads (AAR) has defined Class l railroads as, “having operating revenues at, or exceeding, S475.75 million annually. Currently there are only seven railroads that are considered to be Class l, which makes up an astonishing 93 percent of the industry’s revenue. With leaving only seven percent of revenue to Class ll, known as regionals, and Class ll, known as short lines. Although Class ll and Class lll, only produce seven percent of the total railroad industry’s revenue, both classes have a total combined number of over 500 railroads. [346]
Staggers Rail Act of 1980:
“Revenue adequacy” is a term defined by Congress as the ability of privately owned freight railroads to achieve revenue levels that are adequate to cover total operating expenses, including depreciation and obsolescence, plus a reasonable return on capital employed in the business so as to attract and retain capital in amounts adequate to provide a sound transportation system.[347]
With the railroad industry struggling to survive; the current U.S. President, Jimmy Carter, along with Congress, were able to establish the Staggers Rail Act of 1980. This was enforced after multiple attempts to revive the railroad industry’s financial burden. During the signing of the approved legislation, President Jimmy Carter stated, ““In recent decades the problems of the railroad industry have become severe. Its 1979 rate of return on net investment was 2.7 percent, as compared to over ten percent for comparable industries. We have seen a number of major railroad bankruptcies and the continuing expenditure of billions of Federal dollars to keep railroads running. Service and equipment have deteriorated. A key reason for this state of affairs has been overregulation by the Federal Government. At the heart of this legislation is freeing the railroad industry and its customers from such excessive control.”
The Stagger Rail Act lead to the demise of the Interstate Commerce Commission. After 16 years of the act’s life, the ICC was removed and its authority was split between the Department of Transportation and the Surface Transportation Board. The Staggers Rail Act deregulated the federal government and limited their involvement which in turn substantially improved the industry’s financial situation. It limited ICC’s authority, which is now STB, “to regulate rates only for traffic where competition is not effective to protect shippers.” Another key point is the Staggers Act allowed railroad-shipper contracts. These contracts consist of predetermined, individualized, fixed rates for specific shippers that have been negotiated by the shipper and railroad without any interference. Today it is estimated that one-third of all railroad traffic is under a railroad-shipper contract.
Coal Companies:
Both coal producers and coal-fired utilities have an invested interest in the railroad revenue adequacy. This is mainly because the outcome of the railroad revenue adequacy has a direct effect on the rates that railroads charge. However, the outcome effects the coal producers and coal-fired utility companies in different ways. Producers are worried because the higher the railroad rates, the less competitive their coal prices will be. On the other hand, coal-fired utility companies worry because the higher the railroad rates are the less money they can make from the sale of electric energy.[348]
Problems with Attracting Investors:
Corporate investors must consider multiple factors before choosing any company to invest money into. The two major factors for investors are predicted rate of return and the risk of their principal. With that being stated, investors are more likely invest in company who have a track record of having a low risk of negative return and has a strong possibility of a high rate of return. However, the railroad industry is notoriously known for not being revenue adequate. Which means the railroad companies are not able to cover the cost of expenses, cost of operating efficiently, and the cost of giving investors a competitive return. The U.S. Surface Transportation Board (STB) now proactively determines the rate of return for investors to be competitive. But despite how proactive the STB is, it won’t go far unless the railroads can consistently be revenue adequate.[349]
Railroad Revenue Adequacy for 2015:
Just last month, September 8th, 2016, the STB announced the railroad companies that were deemed revenue adequate for the previous year (2015). The companies listed below were able to attain the rate of return on net investment which was a minimum of 9.61% for 2015 and cover all cost of their capitol. Revenue Adequacy for 2015: 1. BNSF Railway Co. 2. Grand Truck Corp. 3. Soo Line Corp. 4. Union Pacific Railroad
To view all decisions of revenue adequacy for railroads, click here:[350]
Price Regulation and Revenue Adequacy
In 1996, the STB created the RSAM Benchmark, which now limits railroads to a price that a railroad can charge for a shipment. Since then, every year the STB meets and determines these prices for every railroad. The RSAM Benchmark is determined by using three statistical data. 1. (REV>180): Total revenue with a revenue-to-variable-cost greater than 180. 2. (VC>180): Total variable cost with a revenue-to-variable-cost greater than 180. 3. (REV shortage/overage): Amount short of revenue adequacy/Amount over revenue adequacy The Board then adds REV>180 with REV shortage or overage, and divides it by VC>180; which will be the RSAM Benchmark. The STB then determines if the calculated RSAM is sufficient enough to allow the railroad to have competitive prices.[351]
Discussion Questions
[edit | edit source]Is freight rail industry deregulation, i.e. the reforms of the Staggers Act of 1980 actually working for the freight railroad industry as of the 21st Century?
Does passing policy law changes, as in the case of the Staggers Act but not supervising execution actually insure that private freight carriers remain revenue adequate?
If the evaluation tool of revenue adequacy is creating a cap on rates what are the pros and cons of this policy?
If making the cost of capital, to include maintaining a state of good repair and the ability to modernize, is the test of revenue adequacy doing its job?
Additional Readings
[edit | edit source]https://ssrn.com/abstract=2461424
https://www.stb.gov/Decisions/readingroom.nsf/(search-129.174.182.68-10602)?OpenView&Count=5000
References
[edit | edit source]
Handicapped Parking
Summary
[edit | edit source]Federal regulations surrounding handicapped parking were first introduced in 1990, when President George H.W. Bush signed the Americans with Disabilities Act (ADA) into law. The ADA prohibits unjustified discrimination based on disability, and specifically recognizes the importance of eliminating structural and architectural barriers by requiring all new or altered facilities subject to the ADA to be readily accessible to and usable by people with disabilities.
Though this federal regulation exists, handicapped parking is regulated and enforced at the state level, usually by state Departments of Motor Vehicles (DMVs) or by state Departments of Transportation (DOTs). In an effort both to facilitate compliance with all applicable laws and to mitigate the tension between federal and state enforcement processes, the ADA authorizes the Department of Justice, upon request of state or local officials, to certify that state or local accessibility laws meet or exceed the requirements of the ADA.[50] Each state sets its own criteria for "qualifying disabilities", or the disabilities that qualify for special disabled parking placards or handicapped license plates, making management difficult. There are a number of policy issues and strategies surrounding the enforcement of handicapped parking at the state and local levels, discussed in greater detail below.
Annotated List of Actors
[edit | edit source]ADA National Network: Funded by the National Institute on Disability, Independent Living, and Rehabilitation Research, the ADA National Network provides information, guidance, and training on how to implement the ADA in order to support the mission of the ADA, to "assure equality of opportunity, full participation, independent living, and economic self-sufficiency for individuals with disabilities." The network consists of ten regional ADA centers located throughout the United States, as well as an ADA Knowledge Translation Center.[352]
Disabled Persons: An individual with a disability is defined by the ADA as a person who has a physical or mental impairment that substantially limits one or more major life activities, a person who has a history or record of such an impairment, or a person who is perceived by others as having such an impairment. The ADA does not specifically name all of the impairments that are covered.[353]
State Departments of Transportation (DOT): Policy and regulation of parking for persons with disabilities.
State Departments of Motor Vehicles (DMV): Agency tasked with issuing permanent and temporary placards, placards for institutions, and license plates for people with permanent and military-related disabilities.
President George H.W. Bush: signed the Americans with Disabilities Act (ADA) into law on July 26, 1990.
The Media: Public outreach and bringing awareness to the handicapped parking issues.
The U.S. Department of Justice (DOJ): issued new regulations under the Americans with Disabilities Act (ADA) in 2010; and is responsible for the following as they pertain to the ADA:
- Technical Assistance: The ADA requires the DOJ to provide technical assistance to businesses, State and local governments, and individuals with rights or responsibilities under the law. The Department provides education and technical assistance through a variety of means to encourage voluntary compliance. Activities include providing direct technical assistance and guidance to the public through this ADA Website and the ADA Information Line, developing and disseminating technical assistance materials to the public, and undertaking outreach initiatives[354];
- Enforcement: The DOJ may file lawsuits in federal court to enforce the ADA, and courts may order compensatory damages and back pay to remedy discrimination if the Department prevails[355];
- Mediation: Through its ADA Mediation Program, the DOJ refers appropriate ADA disputes to mediators at no cost to the parties. The mediators in the Department of Justice program are professional mediators who have been trained in the legal requirements of the ADA[356];
- Regulation: The ADA requires that the Department write regulations for implementing[357]; and,
- Certification of State and Local Accessibility Requirements: The ADA specifically recognizes the importance of eliminating structural and architectural barriers by requiring all new or altered facilities subject to the ADA to be readily accessible to and usable by people with disabilities. Covered entities must comply with the Department's ADA regulations, including the ADA Standards for Accessible Design. In an effort both to facilitate compliance with all applicable laws and to mitigate the tension between federal and state enforcement processes, the ADA authorizes the Department of Justice, upon request of state or local officials, to certify that state or local accessibility laws meet or exceed the requirements of the ADA[50].
Timeline of Events[358]
[edit | edit source]1950: The earliest law providing for “handicapped” parking was Delaware’s 1955 Code 2134.
1960: Protections for handicapped citizens spawned from the Civil Rights Movement in the 1960’s. While no legislation directly concerning civil rights was passed during that decade, it laid the groundwork for future legislation because civil rights dealt with preventing discrimination and making accommodations for equal rights and access.
1968: After passage of the Architectural Barriers Act, the federal government mandated parking spaces, signage, and curb cuts. The universal access symbol, associated with physical accessibility, also debuted that year.
1973: The first handicapped parking stickers were introduced in Washington, D.C.
1988: Title VIII of the Civil Rights Act was passed in 1698, prohibiting discrimination in housing on the basis of race, religion, national origin, and gender, but it was not until 1988 that the need for legislation to protect handicapped citizens was recognized. It was then that people with disabilities were added to Title VIII.
September 1989: The Senate passes their version of the American with Disabilities Act (ADA)
May 1990: The House of Representatives pass their version of the ADA.
July 1990: President George H.W. Bush signed the ADA into law. Within the law is Section 4.6, Parking and Passenger Loading Zones. It is this section that set into motion the creation of parking spaces reserved for handicapped drivers. The law determined that the spaces needed to be on the shortest route to an entrance, which meant that they were the closest spaces to the business. It also determined that the spaces needed to be wider than regular parking spaces with an aisle next to them, that the spaces cannot be on a steep slope, and need to be designed as handicapped parking.[359]
Maps of Locations
[edit | edit source]Accessible Parking spaces Standards
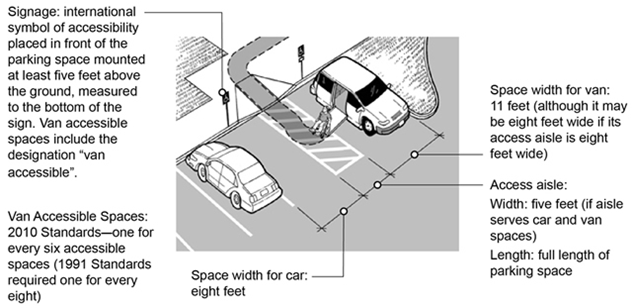
Blue Zone Parking Census Map - San Francisco
Clear Identification of Policy Issues
[edit | edit source]Policy Issues
[edit | edit source]Title III of the Americans with Disabilities Act (ADA) of 1990 (42 U.S.C. 12181-12189) prohibits the discrimination on the basis of disability by public accommodations. It requires government buildings and public and commercial facilities to be designed, constructed, and altered in compliance with the accessibility standards it has established.[360]
In 2010, the Department of Justice published revised regulations that adopted enforceable accessibility standards, called the 2010 ADA Standard for Accessible Design. These regulations set the minimum requirements for newly designed and constructed or altered state and local government facilities, public accommodations, and commercial facilities to be readily accessible for disabled people.[361] With no grandfather exception to the ADA Act (1990), Handicapped Parking is fairly easier to accommodate and typically involves striping and signage.[362]
Handicapped Parking Abuse
[edit | edit source]Handicapped parking provides accessible and proximate parking for individuals with disabilities, but it is often the case that parking privileges are abused by persons who do not meet state qualification criteria and who simply do not want to walk from a more distant spot[363].
Beginning approximately in the 1970s, many states began offering unlimited free on-street parking to holders of disabled parking permits (placards, licensed plates, and tabs), because parking meters were thought to be hard to access for disabled people, and were considered an impediment to independence and mobility.[364] Incentives such as unlimited free parking have proved to encourage widespread abuse and fraudulent behavior of handicapped parking permits. Furthermore, there is a lack of repercussions for those found to be in violation of handicapped parking, because punishment is marginal and enforcement seldom occurs. Handicapped parking abuse results in a deficiency of available handicapped parking spaces required by people with real disabilities, who rely on them to accomplish their everyday jobs. Handicapped parking abuse has two main forms:[365]
- A person who is not disabled parking in a handicapped parking space.
- A person who is not disabled but somehow managed to obtain a placard by loan or other means.
In California, 10% of all drivers carry handicapped parking placards. An estimated 30% of those may be considered cases of fraudulent use. Most state-issued handicapped parking stickers and dashboard tags don’t have expiration dates and are not attached to a specific vehicle, which encourages sharing between family members and friends. Disabled people may be unable to find appropriate parking due to placard abuse. For example, the State of California issued 2.1 million handicapped placards in 2011. In Los Angeles only, there are at least six times as many residents with disabled parking privileges as there are parking meters. In return, only 11 tickets for placard abuse were issued by the Los Angeles DOT. The citation for placard abuse can range anywhere from $250 to $1000.[366]
Enforcement Strategies
[edit | edit source]Handicapped parking abuse takes away accessible parking for disabled individuals who genuinely need it. The abuse is also responsible for loss of revenue in cities and towns across the country, and can negatively impact businesses in the area, as many states allow unlimited free on-street parking for disabled drivers.
Handicapped parking management is regulated at the state level. Listed below are common enforcement strategies:
- Elimination or limitation of the meter-fee exemption: Unlimited, free-metered parking seems to encourage abuse, sometimes by handicapped persons (who park for extended periods of time), but also by others who may borrow a placard or obtain one by fraudulent means. Another suggestion would be to grant the meter-fee exemption to specific placard holders who are physically unable to reach a parking kiosk or insert coins into a meter[367].
- Volunteers: A number of states have implemented volunteer parking enforcement training programs for citizens who are interested in ensuring that handicapped parking will remain available for those who need it. Once the proper training is complete, volunteers are empowered to issue citations to those who abuse disabled parking spaces.[368] For example, the city of Asheville, South Carolina issued approximately 900 handicapped parking citations in 2013, 80% of which were issued by volunteers.[369]
- Enforcement of Time Limits is a technique used by many city governments nationwide and has the following benefits:
- Restricts employees from using curbside parking and encourages off-street parking and other long term arrangements;
- Minimizes drivers circling around in search of a parking spot, which negatively impacts air quality, by providing convenient curbside parking spaces; and,
- Ensures the optimum use of valuable city parking and its availability for short-term parking users. [370]
- Boot Technique: The boot is a device used nationwide on illegally parked vehicles. It is designed to immobilize a vehicle without causing damage to the vehicle. In many states, a vehicle becomes boot-eligible after one delinquent citation for parking in a handicapped zone. Once booted,
- Report to State DMVs or Localities by providing license plate and placards number. This technique often comes with the challenge that not all placards holders will have a visible physical disability (see enforcement challenges, below). A number of apps and websites, such as HandicappedFraud.org, have been developed to assist with reporting improperly parked vehicles without confronting the offender.[371]
- Identify the Misuse of Placards as a Breach of Law: An increasing number of states, including Massachusetts and Washington State, are utilizing this approach.
- Educating not only healthcare providers and the public, but also offenders. Issuing warnings first, followed by tickets and steep fines for secondary offenders is thought to be effective, according to the Council on Disabilities, City of Seattle.[372] A number of websites exist to increase awareness of handicapped parking and its enforcement. [373]
Enforcement Challenges
[edit | edit source]- Privacy: Many disabilities are not physically and immediately visible, making it difficult for law enforcement officials to detect handicapped parking abuse. Questioning and investigation by law enforcement can be seen as harassment or a privacy violation.
- Prioritization of Police Priorities: Enforcing handicapped parking regulations tends not to be a high priority for law enforcement officials, who are busy responding to issues of more importance of criminal and traffic violation nature. Similarly, people may be hesitant to call 9-1-1 to report a handicapped parking violation for fear of tying up the line in case of an emergency, and because it is seen as a low-priority use of a police officer's time.
- Environmental Issues: Numerous urban planning studies show that the shortage of available parking in cities negatively impacts air quality and the environment. This is caused mainly by increased traffic from drivers looking for parking from one street to another. A study titled “The Abuse of Disability Parking Placards in Massachusetts,” conducted by the Office of the Inspector General in the Commonwealth of Massachusetts found that “drivers in Cambridge, Massachusetts spent an average of 11.5 minutes searching for parking, or a 30% share of their traffic cruising. According to the study, this results in greater congestion and increased pollution.”[374]
Narrative of the Case
[edit | edit source]History of Handicapped Parking in the United States
[edit | edit source]Protections for handicapped persons stemmed from the Civil Rights Movement in the 1960’s. Though handicapped persons were not explicitly included as a protected class of citizens under any of the major pieces of Civil Rights legislation passed during that decade, the new laws dealt with preventing discrimination and making accommodations for equal access for all people.
Title VIII of the Civil Rights Act of 1968 prohibited discrimination in housing on the basis of race, religion, national origin, and gender. In 1988, Title VIII was amended to include handicapped citizens as well. During this same year, the first version of the Americans with Disabilities Act (ADA) was introduced to Congress. A second, amended version was introduced the following year. The Senate passed their version on September 9, 1989 and the House passed its version on May 22, 1990. The two versions of the bill were reconciled into one comprehensive bill and on July 26, 1990 President George H.W. Bush signed the ADA into law. Section 4.6 of the ADA set the legal basis for the creation and maintenance of handicapped parking spaces.
Section 4.6 of the ADA, Parking and Passenger Loading Zones, states the following:
4.6.1 Minimum Number. Parking spaces required to be accessible by 4.1 shall comply with 4.6.2 through 4.6.5. Passenger loading zones required to be accessible by 4.1 shall comply with 4.6.5 and 4.6.6.
4.6.2 Location. Accessible parking spaces serving a particular building shall be located on the shortest accessible route of travel from adjacent parking to an accessible entrance. In parking facilities that do not serve a particular building, accessible parking shall be located on the shortest accessible route of travel to an accessible pedestrian entrance of the parking facility. In buildings with multiple accessible entrances with adjacent parking, accessible parking spaces shall be dispersed and located closest to the accessible entrances.
4.6.3* Parking Spaces. Accessible parking spaces shall be at least 96 in (2440 mm) wide. Parking access aisles shall be part of an accessible route to the building or facility entrance and shall comply with 4.3. Two accessible parking spaces may share a common access aisle (see Fig. 9). Parked vehicle overhangs shall not reduce the clear width of an accessible route. Parking spaces and access aisles shall be level with surface slopes not exceeding 1:50 (2%) in all directions.
4.6.4* Signage. Accessible parking spaces shall be designated as reserved by a sign showing the symbol of accessibility (see 4.30.7). Spaces complying with 4.1.2(5)(b) shall have an additional sign "Van-Accessible" mounted below the symbol of accessibility. Such signs shall be located so they cannot be obscured by a vehicle parked in the space.
4.6.5* Vertical Clearance. Provide minimum vertical clearance of 114 in (2895 mm) at accessible passenger loading zones and along at least one vehicle access route to such areas from site entrance(s) and exit(s). At parking spaces complying with 4.1.2(5)(b), provide minimum vertical clearance of 98 in (2490 mm) at the parking space and along at least one vehicle access route to such spaces from site entrance(s) and exit(s).
4.6.6 Passenger Loading Zones. Passenger loading zones shall provide an access aisle at least 60 in (1525 mm) wide and 20 ft (240 in)(6100 mm) long adjacent and parallel to the vehicle pull-up space. If there are curbs between the access aisle and the vehicle pull-up space, then a curb ramp complying with 4.7 shall be provided. Vehicle standing spaces and access aisles shall be level with surface slopes not exceeding 1:50 (2%) in all directions.[375]
Qualifying for Handicapped Parking
[edit | edit source]Each state sets its own criteria for "qualifying disabilities", or the disabilities that qualify for special disabled parking placards or handicapped license plates. Most states consider drivers disabled if they:
- Do not have full use of one or both arms;
- Cannot walk a set number of feet without stopping to rest;
- Cannot walk without using a cane, crutch, brace, prosthetic device, wheelchair, or the assistance of another person;
- Have a Class III or Class IV cardiac condition, as set by the American Heart Association;
- Must have portable oxygen to walk;
- Have a visual acuity of 20/200 or less in the better eye with correcting lenses; or,
- Have a visual acuity of 20/200 but with a limited field of vision in which the widest diameter of the visual field subtends an angle of 20 degrees or less.
Case Studies
[edit | edit source]Washington DC:
[edit | edit source]One of the greatest challenges faced by the District of Columbia is the widespread abuse of placards associated with free meter-parking. An audit conducted by the District Department of Transportation (DDOT) for a block in the Central Business District (CBD) revealed that 31 out of 34 parked cars had placards displayed, or 91% of all parked vehicles. As a result, the Red Top Meters program is being introduced to mitigate the situation. Red Top Meters are parking meters with a distinctive red top that are accessible and are reserved for the exclusive use of persons with disabilities. They offer two options for payment: at the meter by coin or credit card, or by phone using Parkmobile app, the District’s pay-by-phone service. Persons with disabilities will be allowed to pay for parking twice the time limit allocated for adjacent regular meters. The Red Top Meter Program will be implemented within the CBD in early 2017, and serve two purposes:
- Provide persons with disabilities greater access to curbside parking in the high demand, congested CBD area by setting aside reserved, accessible parking meters; and,
- Enable DDOT and the Department of Public Works to equitably manage the limited available curbside space in high demand parking areas within the CBD by encouraging parking turnover at metered spaces. [376] [377] [378]
Anyone can park at the red top meters until they are officially implemented in 2017. The program was initially launched in 2012 and faced a lot of criticism and confusion, mainly due to installation occurring before there was a statutory authority to inforce the program; the inadequate distribution of the meters installed; and accessibility issues, as some were not accessible for persons with disabilities. Both issues should have been addressed by the new program.[379]
New York State:
[edit | edit source]New York has two types of permits for citizens with disabilities, a New York State permit and New York City permit.
- The New York State parking permit is a blue plastic hang-tag. The permit is valid all over New York State where there are designated parking spaces for people with disabilities. In New York City, these spaces are all off-street, such as in parking lots for shopping malls, office buildings, or university campuses. In addiction to the permit, the state offers a metered parking waiver. The metered parking waiver allows the holder to park in a metered parking space in any city, town, or village of New York State (except New York City) without paying the meter fee.
- The New York City permit is a placard that can have several license plates associated with it. The permit holder must move the permit to whichever vehicle he or she is using at the time as there are no copies allowed. The City permit allows the driver to park along most curbsides on city streets, including in all “No Parking” zones, and at metered parking without paying, except for those marked with taxi stands.[380]
State of California:
[edit | edit source]California Vehicle Code 4461 VC prohibits the misuse of disability parking placards, and violators could be charged with a misdemeanor if convicted of illegal use of a disabled placard, and could face jail time. But despite the strict laws, the abuse is very pervasive statewide. It is fairly easy to legally obtain a placard in California. All what an individual needs is to fill out the application form and have it signed by a physician. Some claim that they could even be obtained from eBay or Craigslist. The qualifying criteria are broader and health matters like depression could grant a disabled parking placard if authorized by a physician. In 2014, the California DMV launched a unique type of enforcement called “Operation Blue Zone” in the City of San Francisco. For instance, the DMV investigators targeted perpetrators in the early stage of application and searched disability parking applications for irregularities, like having the same diagnosis or false diagnosis, or same handwriting and signature by the same physician. The investigation, which was prompted by citizen complaints, was successful in catching fraud placard applications in the area. [381] [382] [383] [384]
Discussion Questions
[edit | edit source]- Is the responsibility of issuing and enforcing handicapped parking placards and plates best left to state governments and DMVs, or would the federal government do a better job of this? What are the pros and cons of each?
- Which enforcement strategy do you feel is the most effective? Can you think of any other enforcement strategies that should be implemented?
- Could technologies such as finger printing scanners be the answer to today's challenges in managing handicapped parking?
Additional Readings
[edit | edit source]The Abuse of Disability Parking Placards in Massachusetts
References
[edit | edit source]- ↑ Adam Clark Estes, “The Cursed History of NYC MetroCards,” Gizmodo (Gizmodo, October 23, 2017), https://gizmodo.com/the-cursed-history-of-nyc-metrocards-1819774428.
- ↑ “NYC Subway History: The Story of Fares, Tokens & Cards,” Living In | CitiHabitats.com, June 6, 2018, https://livingin.citihabitats.com/nyc-subway-history-the-story-of-fares-tokens-cards/.
- ↑ Estes, “The Cursed History of NYC MetroCards,”
- ↑ Emily Nonko, “The History of the New York City MetroCard | 6sqft,” 6sqft, November 8, 2017, https://www.6sqft.com/the-history-of-the-new-york-city-metrocard/.
- ↑ Nonko, “The History of the New York City MetroCard | 6sqft,”
- ↑ Kurt Raschke, “A Brief History of Metrorail Fare Collection,” Ggwash.org, July 8, 2011, https://ggwash.org/view/9979/a-brief-history-of-metrorail-fare-collection.
- ↑ Caroline Spivack, “A Guide to OMNY, the MTA’s New MetroCard-Replacing Fare System,” Curbed NY (Curbed NY, May 22, 2019), https://ny.curbed.com/2019/5/22/18617849/nyc-subway-mta-omny-contactless-payment-system.
- ↑ Emily Nonko, “The History of the New York City MetroCard | 6sqft,” 6sqft, November 8, 2017, https://www.6sqft.com/the-history-of-the-new-york-city-metrocard/.
- ↑ “Mayors of the City of New York,” Nyc.gov, accessed November 17, 2019, https://www1.nyc.gov/site/dcas/about/green-book-mayors-of-the-city-of-new-york.page.
- ↑ “Mayors of the City of New York,” Nyc.gov
- ↑ “Mayors of the City of New York,” Nyc.gov
- ↑ “Mayors of the City of New York,” Nyc.gov
- ↑ “Mta.Info | Facts and Figures,” Mta.info, n.d., http://web.mta.info/nyct/facts/ffhist.htm.
- ↑ “Mta.Info | Facts and Figures,” Mta.info
- ↑ “Mta.Info | Facts and Figures,” Mta.info
- ↑ “Mta.Info | Facts and Figures,” Mta.info
- ↑ Brian Ormsbee, “A Historical Look at the New York City Subway - 100 Years Underground,” Cooperator.com, December 2004, https://cooperator.com/article/100-years-underground/full.
- ↑ “Mta.Info | Facts and Figures,” Mta.info
- ↑ “Www.Nycsubway.Org: Subway FAQ: Which Lines Were Former IRT, IND, BMT,” Nycsubway.org, 2012, https://www.nycsubway.org/wiki/Subway_FAQ:_Which_Lines_Were_Former_IRT,_IND,_BMT.
- ↑ Ormsbee, “A Historical Look at the New York City Subway - 100 Years Underground,”
- ↑ Ormsbee, “A Historical Look at the New York City Subway - 100 Years Underground,”
- ↑ Ormsbee, “A Historical Look at the New York City Subway - 100 Years Underground,”
- ↑ “Mta.Info | Facts and Figures,” Mta.info
- ↑ “Mta.Info | Facts and Figures,” Mta.info
- ↑ Yohana Desta, “1904 to Today: See How New York City Subway Fare Has Climbed over 111 Years,” Mashable, March 22, 2015, https://mashable.com/2015/03/22/new-york-city-subway-fare/.
- ↑ “Mta.Info | Facts and Figures,” Mta.info
- ↑ “Mta.Info | Facts and Figures,” Mta.info
- ↑ “Mta.Info | Facts and Figures,” Mta.info
- ↑ “Mta.Info | Facts and Figures,” Mta.info
- ↑ “Mta.Info | Facts and Figures,” Mta.info
- ↑ “Mta.Info | Facts and Figures,” Mta.info
- ↑ “Mta.Info | Facts and Figures,” Mta.info
- ↑ “NYC Subway History: The Story of Fares, Tokens & Cards,” Living In | CitiHabitats.com, June 6, 2018, https://livingin.citihabitats.com/nyc-subway-history-the-story-of-fares-tokens-cards/.
- ↑ “NYC Subway History: The Story of Fares, Tokens & Cards,” Living In
- ↑ “Mta.Info | Facts and Figures,” Mta.info
- ↑ “NYC Subway History: The Story of Fares, Tokens & Cards,” Living In
- ↑ “NYC Subway History: The Story of Fares, Tokens & Cards,” Living In
- ↑ “NYC Subway History: The Story of Fares, Tokens & Cards,” Living In | CitiHabitats.com, June 6, 2018, https://livingin.citihabitats.com/nyc-subway-history-the-story-of-fares-tokens-cards/.
- ↑ “NYC Subway History: The Story of Fares, Tokens & Cards,” Living In
- ↑ “NYC Subway History: The Story of Fares, Tokens & Cards,” Living In
- ↑ “NYC Subway History: The Story of Fares, Tokens & Cards,” Living In
- ↑ Emily Nonko, “The History of the New York City MetroCard | 6sqft,” 6sqft, November 8, 2017, https://www.6sqft.com/the-history-of-the-new-york-city-metrocard/.
- ↑ Kurt Raschke, “A Brief History of Metrorail Fare Collection,” Ggwash.org, July 8, 2011, https://ggwash.org/view/9979/a-brief-history-of-metrorail-fare-collection.
- ↑ Caroline Spivack, “A Guide to OMNY, the MTA’s New MetroCard-Replacing Fare System,” Curbed NY (Curbed NY, May 22, 2019), https://ny.curbed.com/2019/5/22/18617849/nyc-subway-mta-omny-contactless-payment-system.
- ↑ https://fas.org/sgp/crs/misc/R45404.pdf
- ↑ Controlling aircraft noise and sonic boom, 49 USCS § 44715 (2011)
- ↑ Hadhazy, A. (2019, October). Supersonic’s not-so-super emissions | Aerospace America. Aerospace America. Retrieved from https://aerospaceamerica.aiaa.org/features/supersonics-not-so-super-emissions/
- ↑ Elias, B. (2018). Supersonic Passenger Flights. In crsreports.gov (pp. 8). Retrieved from Congressional Research Service website: https://crsreports.congress.gov/product/pdf/R/R45404
- ↑ Elias, B. (2018). Supersonic Passenger Flights. In crsreports.gov (pp.12). Retrieved from Congressional Research Service website: https://crsreports.congress.gov/product/pdf/R/R45404
- ↑ a b c d National Aeronautics and Space Administration. (2011). NASA Armstrong Fact Sheet: Sonic Booms. Retrieved October 30, 2019, from nasa.gov website: https://www.nasa.gov/centers/armstrong/news/FactSheets/FS-016-DFRC.html Invalid
<ref>tag; name ":0" defined multiple times with different content - ↑ a b National Aeronautics and Space Administration. “Quiet Spike.” NASA, 2011, www.nasa.gov/centers/dryden/multimedia/imagegallery/Quiet_Spike/Quiet_Spike_proj_desc.html. Accessed 30 Oct. 2019.
- ↑ Levin, A. (2019, June 17). FAA Will Propose Streamlining Supersonic Flight-Test Approvals. Retrieved November 4, 2019, from Bloomberg.com website: https://www.bloomberg.com/news/articles/2019-06-17/faa-will-propose-streamlining-supersonic-flight-test-approvals
- ↑ Elias, B. (2018). Supersonic Passenger Flights. In crsreports.gov (pp.13). Retrieved from Congressional Research Service website: https://crsreports.congress.gov/product/pdf/R/R45404
- ↑ Rutherford, D., Graver, B., & Chen, C. (2019). Noise and climate impacts of an unconstrained commercial supersonic network. Retrieved from International Council on Clean Transportation website: https://theicct.org/sites/default/files/publications/Supersonic_Impact_Working_Paper_20190130.pdf
- ↑ Reid, D. (2018, September 24). Lawmakers pave the way for the return of supersonic flight. Retrieved October 30, 2019, from CNBC website: https://www.cnbc.com/2018/09/24/us-lawmakers-are-all-set-to-speed-the-return-of-supersonic-flight.html
- ↑ National Aeronautics and Space Administration. (2011a). Low-Boom Flight Demonstration: The Mission. Retrieved October 30, 2019, from nasa.gov website: https://www.nasa.gov/mission_pages/lowboom/mission
- ↑ Drake, F., & Purvis, M. (2001). The Effect of Supersonic Transports on the Global Environment: A Debate Revisited. Science, Technology & Human Values, 26(4), 508. https://doi.org/10.1177/016224390102600406
- ↑ Drake, F., & Purvis, M. (2001). The Effect of Supersonic Transports on the Global Environment: A Debate Revisited. Science, Technology & Human Values, 26(4), 508. https://doi.org/10.1177/016224390102600406
- ↑ Rutherford, D., Graver, B., & Chen, C. (2019). Noise and climate impacts of an unconstrained commercial supersonic network. Retrieved from International Council on Clean Transportation website: https://theicct.org/sites/default/files/publications/Supersonic_Impact_Working_Paper_20190130.pdf
- ↑ Crutzen, P. (1972). SST’s: A Threat to the Earth’s Ozone Shield. Ambio, 1(2), 41–51. Retrieved from http://www.jstor.org/stable/4311946
- ↑ a b The Anti-Concorde Project. (1972). Concrode - 1962-1972: Is it Already Obsolete? Retrieved from https://upload.wikimedia.org/wikipedia/commons/6/61/ACPTimes.jpg
- ↑ “The Nobel Prize in Chemistry 1995: Paul J. Crutzen.” NobelPrize.Org, The Nobel Prize, www.nobelprize.org/prizes/chemistry/1995/crutzen/facts/. Accessed 30 Oct. 2019.
- ↑ Rutherford, D., Graver, B., & Chen, C. (2019). Noise and climate impacts of an unconstrained commercial supersonic network. Retrieved from International Council on Clean Transportation website: https://theicct.org/sites/default/files/publications/Supersonic_Impact_Working_Paper_20190130.pdf
- ↑ Corsia: The UN’s plan to ‘offset’ growth in aviation emissions after 2020. (2019, February 4). Retrieved October 30, 2019, from Carbon Brief website: https://www.carbonbrief.org/corsia-un-plan-to-offset-growth-in-aviation-emissions-after-2020
- ↑ Jasper, C., & Johnson, J. (2019, June 28). The New Era of Supersonic Travel May End Before It Even Begins. Retrieved November 4, 2019, from Bloomberg.com website: https://www.bloomberg.com/news/articles/2019-06-28/the-new-era-of-supersonic-travel-may-end-before-it-even-begins
- ↑ Who Will Win the Supersonic Race?; At stake in the worldwide drive to be first with Mach 2‐plus passenger planes is national prestige. But before the jets fly, some hard questions must be answered. (1964, August 23). The New York Times. Retrieved from https://www.nytimes.com/1964/08/23/archives/who-will-win-the-supersonic-race-at-stake-in-the-worldwide-drive-to.html
- ↑ Klein, C. (2016, January 21). The Cold War Race to Build the Concorde. Retrieved October 30, 2019, from history.com website: https://www.history.com/news/the-cold-war-race-to-build-the-concorde
- ↑ Dowling, S. (2016). The American Concordes that never flew. Retrieved October 30, 2019, from Bbc.com website: https://www.bbc.com/future/article/20160321-the-american-concordes-that-never-flew
- ↑ Beresnevicius, R. (2018, December 5). The Lost Brother of Concorde: The story of Tupolev Tu-144. Retrieved October 30, 2019, from Aerotime.aero website: https://www.aerotime.aero/rytis.beresnevicius/23029-lost-brother-of-concorde-story-tupolev-tu-144
- ↑ Borsky, P. (1965). Community Reactions to Sonic Booms (National Opinion Research Center, Ed.). Retrieved from University of Chicago website: http://www.norc.org/PDFs/publications/NORCRpt_101.pdf
- ↑ Borsky, P. (1965). Community Reactions to Sonic Booms (National Opinion Research Center, Ed.). Retrieved from University of Chicago website: http://www.norc.org/PDFs/publications/NORCRpt_101.pdf
- ↑ The Anti-Concorde Project. (1972). Concrode - 1962-1972: Is it Already Obsolete? Retrieved from https://upload.wikimedia.org/wikipedia/commons/6/61/ACPTimes.jpg
- ↑ Dowling, S. (2016). The American Concordes that never flew. Retrieved October 30, 2019, from Bbc.com website: https://www.bbc.com/future/article/20160321-the-american-concordes-that-never-flew
- ↑ Conway, E. (2008). High-speed dreams : NASA and the technopolitics of supersonic transportation, 1945-1999. Baltimore, Md: Johns Hopkins Univ Press.
- ↑ Supersonic Civilian Flights Over U.S. Are Outlawed. (1973, March 28). The New York Times. Retrieved from https://www.nytimes.com/1973/03/28/archives/supersonic-civilianflights-over-us-are-outlawed.html
- ↑ Controlling aircraft noise and sonic boom, 49 USCS § 44715 (2011)
- ↑ Beresnevicius, R. (2018, December 5). The Lost Brother of Concorde: The story of Tupolev Tu-144. Retrieved October 30, 2019, from Aerotime.aero website: https://www.aerotime.aero/rytis.beresnevicius/23029-lost-brother-of-concorde-story-tupolev-tu-144
- ↑ Slotnick, D. (2019, October 7). The history of the Concorde supersonic jet - Business Insider. Retrieved October 30, 2019, from Business Insider website: https://www.businessinsider.com/concorde-supersonic-jet-history-2018-10
- ↑ Slutsken, H. (2019, March 2). What it was really like to fly on Concorde. Retrieved October 30, 2019, from CNN Travel website: https://www.cnn.com/travel/article/concorde-flying-what-was-it-like/index.html
- ↑ Bramson, D. (2015, July). The Concorde: A Supersonic Airplane Too Advanced to Survive. Retrieved October 30, 2019, from The Atlantic website: https://www.theatlantic.com/technology/archive/2015/07/supersonic-airplanes-concorde/396698/
- ↑ The Boeing Company. (1989). NASA Contractor Report 4233: High-Speed Civil Transport Study. In nasa.gov. Retrieved from National Aeronautics and Space Administration website: https://ntrs.nasa.gov/archive/nasa/casi.ntrs.nasa.gov/19890018277.pdf
- ↑ National Aeronautics and Space Administration. (2011b). NASA Armstrong Fact Sheet: Sonic Booms. Retrieved October 30, 2019, from nasa.gov website: https://www.nasa.gov/centers/armstrong/news/FactSheets/FS-016-DFRC.html
- ↑ NASA’s Supersonic X-59 QueSST Coming Together at Famed Factory. (2019). Retrieved from NASA website: https://www.nasa.gov/aero/nasa-supersonic-x59-quesst-coming-together-at-famed-factory
- ↑ Trautvetter, C. (2018, June 26). Textron To Cease Production of Cessna Citation X+. Retrieved October 30, 2019, from AIN Online website: https://www.ainonline.com/aviation-news/business-aviation/2018-06-26/textron-cease-production-cessna-citation-x
- ↑ Falcus, M. (2019, April 5). What supersonic travel means for you. Retrieved October 30, 2019, from cnn.com website: https://www.cnn.com/travel/article/supersonic-travel/index.html
- ↑ National Aeronautics and Space Administration. (2011a). Low-Boom Flight Demonstration: The Mission. Retrieved October 30, 2019, from nasa.gov website: https://www.nasa.gov/mission_pages/lowboom/mission
- ↑ Waldron, G. (2019, June 19). PARIS: Boom XB-1 schedule slips, while JAL eyes Overture. Retrieved October 30, 2019, from Flightglobal.com website: https://www.flightglobal.com/news/articles/paris-boom-xb-1-schedule-slips-while-jal-eyes-ove-459129/
- ↑ Aerotime.aero. (2019, February 4). Boom, Aerion & Spike head-to-head in supersonic jet race. Retrieved October 30, 2019, from Aerotime.aero website: https://www.aerotime.aero/aerotime.team/22308-boom-aerion-spike-head-to-head-in-supersonic-jet-race?page=2
- ↑ Federal Aviation Administration. (2019). Fact Sheet – Supersonic Flight. Retrieved September 17, 2019, from Faa.gov website: https://www.faa.gov/news/fact_sheets/news_story.cfm?newsId=22754
- ↑ Federal Aviation Administration. (2019). Fact Sheet – Supersonic Flight. Retrieved September 17, 2019, from Faa.gov website: https://www.faa.gov/news/fact_sheets/news_story.cfm?newsId=22754
- ↑ Ryall, J. (2016, July 23). Supersonic: Japan’s space agency is working on ‘son of Concorde.’ Retrieved October 30, 2019, from South China Morning Post website: https://www.scmp.com/news/asia/east-asia/article/1993690/supersonic-japans-space-agency-working-son-concorde
- ↑ Goldstein, M. (2019, June 5). Does Flight-Shaming Over Climate Change Pose An Existential Threat To Airlines? Forbes. Retrieved from https://www.forbes.com/sites/michaelgoldstein/2019/06/04/does-flight-shaming-over-climate-change-pose-an-existential-threat-to-airlines/#1d2459ea3cfc
- ↑ Aratani, L. (2019, June 25). House passes amendment to prioritize efforts to combat airplane, helicopter noise. The Washington Post. Retrieved from https://www.washingtonpost.com/transportation/2019/06/25/house-passes-amendment-prioritize-efforts-combat-airplane-helicopter-noise/
- ↑ https://www.populus.ai/micro-mobility-2018-july
- ↑ https://nacto.org/wp-content/uploads/2018/07/NACTO-Shared-Active-Transportation-Guidelines.pdf
- ↑ https://www.marketwatch.com/press-release/mobility-on-demand-market-is-expected-to-grow-at-approximately-usd-186-billion-by-2023-at-18-of-cagr-between-2018-and-2023-2018-05-24
- ↑ https://www.li.me/about-us
- ↑ https://wagner.nyu.edu/files/faculty/publications/Rudin_ScooterShare_Aug2018_0.pdf
- ↑ https://www.citylab.com/transportation/2016/07/portland-bikeshare-biketown-launch/492902/
- ↑ https://www.wired.com/story/uber-acquires-jump-bike/
- ↑ https://www.crunchbase.com/organization/bird
- ↑ https://techcrunch.com/2018/08/30/skip-and-scoot-only-companies-awarded-scooter-permits-in-san-francisco
- ↑ https://www.economist.com/christmas-specials/2017/12/19/how-bike-sharing-conquered-the-world
- ↑ https://bipartisanpolicy.org/blog/dockless-bikes-and-scooters-the-rise-of-micro-mobility
- ↑ https://www.economist.com/christmas-specials/2017/12/19/how-bike-sharing-conquered-the-world
- ↑ https://www.populus.ai/micro-mobility-2018-july
- ↑ https://ralphbu.files.wordpress.com/2018/05/dc-dockless-bikeshare_a-first-look_may_10_2018_publication.pdf
- ↑ https://ralphbu.files.wordpress.com/2018/05/dc-dockless-bikeshare_a-first-look_may_10_2018_publication.pdf
- ↑ https://www.populus.ai/micro-mobility-2018-july
- ↑ https://www.populus.ai/micro-mobility-2018-july
- ↑ https://ralphbu.files.wordpress.com/2018/05/dc-dockless-bikeshare_a-first-look_may_10_2018_publication.pdf
- ↑ https://www.washingtonpost.com/technology/2018/09/20/fatal-e-scooter-accident-emerges-just-california-legalizes-riding-without-helmet/
- ↑ https://www.washingtonpost.com/local/public-safety/emergency-workers-try-to-rescue-pedestrian-trapped-under-suv-in-dupont-circle/2018/09/21/aec71252-bdaa-11e8-be70-52bd11fe18af_story.html
- ↑ https://scholar.smu.edu/cgi/viewcontent.cgi?referer=https://www.google.com/&httpsredir=1&article=1382&context=jalc=SMU
- ↑ https://scholar.smu.edu/cgi/viewcontent.cgi?referer=https://www.google.com/&httpsredir=1&article=1382&context=jalc
- ↑ https://fas.org/sgp/crs/misc/R44791.pdf
- ↑ https://www.aci-na.org/static/entransit/Passenger%20Facility%20Charges%20Fact%20Sheet.pdf
- ↑ https://www.faa.gov/airports/pfc/monthly_reports/media/stats.pdf
- ↑ https://data.worldbank.org/indicator/IS.AIR.PSGR?end=2017&locations=US&start=1990
- ↑ https://www.aaae.org/about_aaae/
- ↑ http://airlines.org/about-us/
- ↑ https://www.faa.gov/about/
- ↑ https://www.gao.gov/assets/90/89930.pdf
- ↑ https://www.faa.gov/airports/resources/publications/federal_register_notices/media/pfc_65fr34536.pdf
- ↑ https://www.everycrsreport.com/reports/RL33920.html
- ↑ https://www.transportation.gov/content/aviation-congestion-management
- ↑ https://www.faa.gov/airports/planning_capacity/npias/reports/media/NPIAS-Report-2017-2021-Narrative.pdf
- ↑ https://www.atr.org/airports-do-not-need-pfc-increase-finance-new-investment
- ↑ file:///Users/lindseyconstantino/Downloads/2017%20ALA%20Annual%20Report.pdf
- ↑ Government Accountability Office, 2015
- ↑ https://www.usatoday.com/story/travel/2017/10/18/airlines-airports-odds-over-fee-hike-before-congress/775685001/
- ↑ https://www.enotrans.org/article/airport-privatization-future-u-s/
- ↑ https://www.cato.org/publications/tax-budget-bulletin/privatizing-us-airports
- ↑ https://www.whitehouse.gov/presidential-actions/presidential-executive-order-establishing-discipline-accountability-environmental-review-permitting-process-infrastructure/
- ↑ https://www.naco.org/blog/administration-issues-memo-improve-and-streamline-environmental-permitting-infrastructure
- ↑ https://www.gao.gov/assets/670/662543.pdf
- ↑ https://www.enotrans.org/article/white-house-directs-agencies-to-coordinate-permitting-for-more-infrastructure-projects/
- ↑ https://www.enotrans.org/article/white-house-directs-agencies-to-coordinate-permitting-for-more-infrastructure-projects/
- ↑ https://www.enotrans.org/article/white-house-directs-agencies-to-coordinate-permitting-for-more-infrastructure-projects/
- ↑ https://www.enotrans.org/article/white-house-directs-agencies-to-coordinate-permitting-for-more-infrastructure-projects/
- ↑ https://www.enotrans.org/article/white-house-directs-agencies-to-coordinate-permitting-for-more-infrastructure-projects/
- ↑ https://www.enotrans.org/article/white-house-directs-agencies-to-coordinate-permitting-for-more-infrastructure-projects/
- ↑ https://www.naco.org/blog/administration-issues-memo-improve-and-streamline-environmental-permitting-infrastructure
- ↑ https://www.whitehouse.gov/briefings-statements/president-donald-j-trumps-administration-improving-inefficient-permitting-reviews/
- ↑ https://aashtojournal.org/2018/10/26/usdot-streamlines-environmental-rules-to-improve-transportation-project-delivery/
- ↑ https://www.gao.gov/assets/670/662543.pdf
- ↑ https://www.whitehouse.gov/wp-content/uploads/2018/04/MOU-One-Federal-Decision-m-18-13-Part-2-1.pdf
- ↑ https://www.whitehouse.gov/briefings-statements/president-donald-j-trumps-administration-improving-inefficient-permitting-reviews/
- ↑ https://www.enotrans.org/article/white-house-directs-agencies-to-coordinate-permitting-for-more-infrastructure-projects/
- ↑ https://www.epa.gov/environmentaljustice/environmental-justice-and-national-environmental-policy-act
- ↑ https://www.usnews.com/opinion/op-ed/articles/2017-08-22/trump-wont-speed-up-infrastructure-projects-by-gutting-environmental-rules
- ↑ https://www.epa.gov/nepa/national-environmental-policy-act-review-process
- ↑ https://contentdev.sierraclub.org/www/texas/houston/blog/2018/08/trump-attacks-environmental-reviews-and-moves-fast-track-nepa
- ↑ https://www.gao.gov/assets/670/662543.pdf
- ↑ https://www.gao.gov/assets/670/662543.pdf
- ↑ https://www.nrdc.org/experts/scott-slesinger/we-cannot-streamline-our-way-out-lack-funding
- ↑ https://www.usnews.com/opinion/op-ed/articles/2017-08-22/trump-wont-speed-up-infrastructure-projects-by-gutting-environmental-rules
- ↑ https://www.usnews.com/opinion/op-ed/articles/2017-08-22/trump-wont-speed-up-infrastructure-projects-by-gutting-environmental-rules
- ↑ https://www.gao.gov/assets/670/662543.pdf
- ↑ https://www.gao.gov/assets/670/662543.pdf
- ↑ https://www.acec.org/default/assets/File/NEPA-Comments.pdf
- ↑ [1], Road Pricing: the case for and against.
- ↑ [2], Congestion Charges for Urban Cities : Pros and Cons.
- ↑ [3], Congestion Charges for Urban Cities : Pros and Cons.
- ↑ [4], Congestion Charges for Urban Cities : Pros and Cons.
- ↑ [5], Road Pricing: the case for and against.
- ↑ [6], Pros and Cons of a Congestion Charge.
- ↑ [7], Pros and Cons of a Congestion Charge.
- ↑ [8], Paying Our Way.
- ↑ [9], Paying Our Way.
- ↑ [10], Land Use and Transportation Planning in Response to Congestion Problems: A Review and Critique.
- ↑ [11], Paying Our Way.
- ↑ [12], Transit and Congestion Pricing.
- ↑ [13], VDOT Public Notice.
- ↑ [14], High Occupancy Vehicle (HOV) Lanes - Rules and FAQs.
- ↑ [15], Upset about the I-66 tolls? These Virginia lawmakers are with you.
- ↑ [16], Why congestion pricing might work in LA .
- ↑ [17], Electronic Road Pricing turns 20 in April: Notable milestones over the years .
- ↑ [18], Electronic Road Pricing turns 20 in April: Notable milestones over the years .
- ↑ [19], VIRGINIA'S $40 TOLL ROAD BETTER BE THE FUTURE OF DRIVING .
- ↑ [20], Crunchbase Profile.
- ↑ [21] Mercedes-Benz Vans invests in Starship Technologies, the world's leading manufacturer of delivery robots.
- ↑ [22], Dispatch company website.
- ↑ [23], Postmates and DoorDash are testing delivery by robot with Starship Technologies
- ↑ [24], Washington Post. June 24, 2016. "It's official: Drone delivery is coming to D.C. in September"
- ↑ [25], Crunchbase Profile.
- ↑ [26], Marble company website.
- ↑ [27], Virginia Commonwealth Legislative Information System.
- ↑ [28] Just Eat deliver 1,000th meal in London by robot ]
- ↑ [29], Hungry? Call your neighborhood delivery robot.
- ↑ [30], Hungry? Call your neighborhood delivery robot.
- ↑ [31], Startup Developing Autonomous Delivery Robots That Travel on Sidewalks.
- ↑ [32], Virginia is the first state to pass a law allowing robots to deliver straight to your door.
- ↑ [33], Idaho is the second state to allow unmanned robots to deliver to your front door.
- ↑ [34], Wisconsin is now the third state to allow delivery robots.
- ↑ [35], Florida is now the fourth state to permit delivery robots on sidewalks.
- ↑ [36], Ohio is now the fifth U.S. state to permit delivery robots on sidewalks.
- ↑ [37], 'Our streets are made for people': San Francisco mulls ban on delivery robots.
- ↑ [38], Delivery Robots Will Now Need Permits To Replace Us.
- ↑ [39], Postmates and DoorDash are testing delivery by robot with Starship Technologies.
- ↑ [40] Delivery robots: a revolutionary step or a sidewalk clogging nightmare?
- ↑ [41], South Korea introduces world's first 'robot tax'
- ↑ [42] Elon Musk says robots will push us to a universal basic income - here's how it would work.
- ↑ [43] Startup Developing Autonomous Delivery Robots That Travel on Sidewalks.
- ↑ [44], Delivery robots: a revolutionary step or sidewalk-clogging nightmare?
- ↑ "Appendix E: Best Practices - Catastrophic Hurricane Evacuation Plan Evaluation: A Report to Congress". Retrieved 2017-10-28.
- ↑ "The Disaster Declaration Process | FEMA.gov". Retrieved 2017-10-27.
- ↑ Stafford_ActselectHSA2016.pdf (PDF), retrieved 2017-10-24
- ↑ "The Disaster Declaration Process | FEMA.gov". Retrieved 2017-10-27.
- ↑ "The Disaster Declaration Process | FEMA.gov". Retrieved 2017-10-27.
- ↑ Template:Cite interview
- ↑ Template:Cite interview
- ↑ "About the National Hurricane Center".
- ↑ nrf_massevacuationincidentannex.pdf (PDF), retrieved 2017-10-24
- ↑ Stafford_ActselectHSA2016.pdf (PDF), retrieved 2017-10-24
- ↑ "Post-Katrina Emergency Management Reform Act". Retrieved 2017-10-28.
- ↑ "Post-Katrina Emergency Management Reform Act". Retrieved 2017-10-28.
- ↑ PLAW-109publ308.pdf (PDF), retrieved 2017-10-25
- ↑ "What Is EMAC?". Retrieved 2017-10-26.
- ↑ "U.S waives Jones Act to secure fuel for hurricane responders". Reuters. 2017-09-08. https://www.reuters.com/article/us-storm-irma-shipping/u-s-waives-jones-act-to-secure-fuel-for-responders-to-hurricanes-idUSKCN1BJ2GE. Retrieved 2017-10-28.
- ↑ "Hurricanes | Ready.gov". Retrieved 2017-10-28.
- ↑ "Hurricanes | Ready.gov". Retrieved 2017-10-28.
- ↑ "Hurricanes | Ready.gov". Retrieved 2017-10-28.
- ↑ "Hurricanes | Ready.gov". Retrieved 2017-10-28.
- ↑ "Hurricanes | Ready.gov". Retrieved 2017-10-28.
- ↑ "Hurricanes | Ready.gov". Retrieved 2017-10-28.
- ↑ "Hurricane - NOLA Ready". Retrieved 2017-10-28.
- ↑ "Hurricanes | Ready.gov". Retrieved 2017-10-28.
- ↑ "Hurricanes | Ready.gov". Retrieved 2017-10-28.
- ↑ "Hurricanes | Ready.gov". Retrieved 2017-10-28.
- ↑ Stafford_ActselectHSA2016.pdf (PDF), retrieved 2017-10-24
- ↑ EVAC_MIAMI-DADE.pdf (PDF), retrieved 2017-10-28
- ↑ "Contraflow Evacuation Maps - New Orleans, Louisiana". Retrieved 2017-10-28.
- ↑ 2017-evacuation-routes-map-small.pdf (PDF), retrieved 2017-10-28
- ↑ Carpender, S. Kay; Campbell, Paul H.; Quiram, Barbara J.; Frances, Joshua; Artzberger, Jill J. (2006). "Urban Evacuations and Rural America: Lessons Learned from Hurricane Rita". Public Health Reports (1974-). 121 (6): 775–779. ISSN 0033-3549. JSTOR 20057041. Retrieved 2017-10-28.
- ↑ nrf_massevacuationincidentannex.pdf (PDF), retrieved 2017-10-24
- ↑ Carpender, S. Kay; Campbell, Paul H.; Quiram, Barbara J.; Frances, Joshua; Artzberger, Jill J. (2006). "Urban Evacuations and Rural America: Lessons Learned from Hurricane Rita". Public Health Reports (1974-). 121 (6): 775–779. ISSN 0033-3549. JSTOR 20057041. Retrieved 2017-10-28.
- ↑ "Contraflow Evacuation Maps - New Orleans, Louisiana". Retrieved 2017-10-28.
- ↑ nrf_massevacuationincidentannex.pdf (PDF), retrieved 2017-10-24
- ↑ "How Harvey made it harder to evacuate for Irma - Vox". Retrieved 2017-10-28.
- ↑ Renne, John (2011). "Evacuation Planning for Vulnerable Populations: Lessons from the New Orleans City Assisted Evacuation Plan". Brookings Institution Press.
- ↑ Renne, John (2011). "Evacuation Planning for Vulnerable Populations: Lessons from the New Orleans City Assisted Evacuation Plan". Brookings Institution Press.
- ↑ Renne, John (2011). "Evacuation Planning for Vulnerable Populations: Lessons from the New Orleans City Assisted Evacuation Plan". Brookings Institution Press.
- ↑ Carpender, S. Kay; Campbell, Paul H.; Quiram, Barbara J.; Frances, Joshua; Artzberger, Jill J. (2006). "Urban Evacuations and Rural America: Lessons Learned from Hurricane Rita". Public Health Reports (1974-). 121 (6): 775–779. ISSN 0033-3549. JSTOR 20057041. Retrieved 2017-10-28.
- ↑ nrf_massevacuationincidentannex.pdf (PDF), retrieved 2017-10-24
- ↑ "How Harvey made it harder to evacuate for Irma - Vox". Retrieved 2017-10-28.
- ↑ "How Harvey made it harder to evacuate for Irma - Vox". Retrieved 2017-10-28.
- ↑ "U.S waives Jones Act to secure fuel for hurricane responders". Reuters. 2017-09-08. https://www.reuters.com/article/us-storm-irma-shipping/u-s-waives-jones-act-to-secure-fuel-for-responders-to-hurricanes-idUSKCN1BJ2GE. Retrieved 2017-10-28.
- ↑ Stein, Robert M.; Dueñas-Osorio, Leonardo; Subramanian, Devika (2010). "Who Evacuates When Hurricanes Approach? The Role of Risk, Information, and Location". Social Science Quarterly. 91 (3): 816–834. ISSN 0038-4941. JSTOR 42956432. Retrieved 2017-10-28.
- ↑ Congressional Research Service (2011-09-04). Federal Evacuation Policy: Issues for Congress. Retrieved 2017-10-28.
- ↑ Congressional Research Service (2011-09-04). Federal Evacuation Policy: Issues for Congress. Retrieved 2017-10-28.
- ↑ Congressional Research Service (2011-09-04). Federal Evacuation Policy: Issues for Congress. Retrieved 2017-10-28.
- ↑ Congressional Research Service (2011-09-04). Federal Evacuation Policy: Issues for Congress. Retrieved 2017-10-28.
- ↑ [45], Keystone Pipeline System – Overview.
- ↑ [46], Route Maps.
- ↑ [47], KXL Pipeline Project.
- ↑ [48], KXL Pipeline Project.
- ↑ [49], TransCanada. "TransCanada Receives Presidential Permit for Keystone XL." News release, 2017. News Release. Accessed September 15, 2017.
- ↑ [50], Keystone Pipeline System – Overview.
- ↑ [51], "Land board approves Keystone lease," Billings Gazette, December 12, 2012.
- ↑ [52], South Dakota Public Utilities Commission, "Keystone XL Clears Hurdle In South Dakota," February 19, 2010.
- ↑ [53], "Keystone XL Pipeline Project." U.S. Department of State.
- ↑ [54], National Environmental Policy Act.
- ↑ [55], Office of the Spokesman, "Keystone Pipeline Presidential Permit," U.S. Department of State Archive, March 3, 2008.
- ↑ [56], Statement by the President on the Keystone XL Pipeline https://obamawhitehouse.archives.gov/the-press-office/2015/11/06/statement-president-keystone-xl-pipeline.
- ↑ [57], The White House, Office of the Press Secretary, "Presidential Memorandum Regarding Construction of the Keystone XL Pipeline," news release, January 24, 2017.
- ↑ [58] A history of the Keystone XL pipeline project, The Press.
- ↑ [59], A history of the Keystone XL pipeline project, The Press.
- ↑ [60], A history of the Keystone XL pipeline project, The Press .
- ↑ [61], We've Accomplished a Lot in Seven Decades.
- ↑ [62], A history of the Keystone XL pipeline project, The Press.
- ↑ [www.transcanada.com/en/annoucements/2011-02-08keystones-cushing-extension-begins-deliveries-to-oklahoma/]
- ↑ [63], A history of the Keystone XL pipeline project, The Press.
- ↑ [64], A history of the Keystone XL pipeline project, The Press.
- ↑ [65], A history of the Keystone XL pipeline project, The Press.
- ↑ [66], TransCanada. "TransCanada Applies for Keystone XL Presidential Permit." News release, May 04, 2012. TransCanada Announcements.
- ↑ [www.nebraskaeasement.org/uploads/1/1/2/8/11280347/0122_pipeline_approval.pdf], "Final Evaluation Report." Dave Heineman to President Barack Obama and Secretary Hillary Rodham Clinton. January 22, 2013.
- ↑ [67], We've Accomplished a Lot in Seven Decades.
- ↑ [Keystonepipeline-xl.state.gov/documents/organization/221135.pdf],United States of America. U.S. Department of State. Bureau of Oceans and InternationalEnvironmental and Scientific Affairs. Final Supplemental Environmental Impact Statement For the KEYSTONE XL PROJECT. By Genevieve Walker. 1-44.
- ↑ [68], Ellen Rolfes, "Nebraska judge strikes down law allowing Keystone pipeline construction to move forward." PBS News Hour - The Rundown. February 20, 2014.
- ↑ [69], Alan Neuhauser, "Nebraska Supreme Court OKs Keystone XL, Overturns Lower Court ." News. January 9, 2015.
- ↑ [www.congress.gov/bill/114th-congress/senate-bill/1], Keystone XL Pipeline Approval Act, S., 114th Cong. (2015).
- ↑ [70], TransCanada, "TransCanada Commences Legal Actions Following Keystone XL Denial," news release, January 06, 2016, TransCanada Announcements.
- ↑ [71],TransCanada, "TransCanada Commences Legal Actions Following Keystone XL Denial," news release, January 06, 2016, TransCanada Announcements.
- ↑ [72], Matt Egan. "Keystone pipeline has reopened ." News. April 11, 2016.
- ↑ [73], The White House, Office of the Press Secretary, "Presidential Memorandum Regarding Construction of the Keystone XL Pipeline," news release, January 24, 2017.
- ↑ [74], Kurt Gasser, "THE TRANSCANADA KEYSTONE XL PIPELINE: THE GOOD, THE BAD, AND THE UGLY DEBATE," THE TRANSCANADA KEYSTONE XL PIPELINE: THE GOOD, THE BAD, AND THE UGLY DEBATE | Utah Environmental Law Review, 201, accessed October 06, 2017.
- ↑ [75], Kurt Gasser, "THE TRANSCANADA KEYSTONE XL PIPELINE: THE GOOD, THE BAD, AND THE UGLY DEBATE," THE TRANSCANADA KEYSTONE XL PIPELINE: THE GOOD, THE BAD, AND THE UGLY DEBATE | Utah Environmental Law Review, 201, accessed October 06, 2017.
- ↑ [76], Kurt Gasser, "THE TRANSCANADA KEYSTONE XL PIPELINE: THE GOOD, THE BAD, AND THE UGLY DEBATE," THE TRANSCANADA KEYSTONE XL PIPELINE: THE GOOD, THE BAD, AND THE UGLY DEBATE | Utah Environmental Law Review, 201, accessed October 06, 2017.
- ↑ [77], Kurt Gasser, "THE TRANSCANADA KEYSTONE XL PIPELINE: THE GOOD, THE BAD, AND THE UGLY DEBATE," THE TRANSCANADA KEYSTONE XL PIPELINE: THE GOOD, THE BAD, AND THE UGLY DEBATE | Utah Environmental Law Review, 201, accessed October 06, 2017.
- ↑ [78], Courtney Cherry, "The Keystone Pipeline: Environmentally Just," Environmental & Energy Law & Policy Journal 6, no. 1 (2011).
- ↑ [79], Courtney Cherry, "The Keystone Pipeline: Environmentally Just," Environmental & Energy Law & Policy Journal 6, no. 1 (2011).
- ↑ [80], Parfomak, P. W., Pirog, R., Luther, L., & Vann, A. (2013). Proposed Keystone XL pipeline project: Key issues. Washington, DC: Congressional Research Service.
- ↑ [81], Creating Jobs http://www.keystone-xl.com/benefits/job-creation/.
- ↑ [82], Local and National Economic Benefits http://www.keystone-xl.com/benefits/tax-revenue/.
- ↑ [83], Local and National Economic Benefits http://www.keystone-xl.com/benefits/tax-revenue/.
- ↑ [84]"Timeline: Keystone XL Pipeline". Omaha World-Herald. January 24, 2017.
- ↑ [85]Goodman, Jillian. "Can Some Nebraska Farmers Kill the Keystone XL Pipeline". Bloomberg. January 24, 2017.
- ↑ [86], Presidential Permits for Crossings. U.S. Department of State.
- ↑ [87]Parformak, Paul, Linda Luther, Richard Lattanzio, Jonathan Ramseur, Adam Vann, Robert Pirog, and Ian Fergusson. 2015. "Keystone XL Pipeline: Overview and Recent Developments." Congressional Research Service. April 1. Accessed October 1, 2017. [88].
- ↑ [89]Krauss, Clifford. "U.S., in Reversal, Issues Permit for Keystone Oil Pipeline". New York Times. March 24, 2017.
- ↑ [90]Krauss, Clifford. "U.S., in Reversal, Issues Permit for Keystone Oil Pipeline". New York Times. March 24, 2017.
- ↑ [91]Goldstien, David. "Oil Pipeline from Canada Stirring Anger in U.S.". McClatchy Newspapers. February 13, 2011.
- ↑ [92]"Keystone Poses 'No Significant Impacts' to Most Resources Along Path - US". Dow Jones Newswires.
- ↑ [93]Eilperin, Juliet; Mufson, Steven. "Obama administration rejects Keystone XL pipeline". January 18, 2012.
- ↑ [94]Cunningham, Lynn. "Congressional Roll Call Votes on the Keystone XL Pipeline". Congressional Research Service. April 4, 2017.
- ↑ [95]Davenport, Coral. "Citing Climate Change, Obama Rejects Construction of Keystone XL Oil Pipeline", The New York Times. November 6, 2015.
- ↑ [96]"Presidential Memorandum Regarding Construction of the Keystone XL Pipeline". The White House. January 24, 2017.
- ↑ [97]Dennis, Brady; Mufson, Steven. "As Trump administration grants approval for Keystone XL pipeline, an old fight is reignited". The Washington Post. March 24, 2011.
- ↑ [98]"TransCanada to Make Final Decision on Keystone XL by December". Reuters. July 28,2017."
- ↑ Rinaldi, Paul (2015). "Safety and Efficiency Must Remain the Main Mission". The Journal of Air Traffic Control. 57 (2): 21–23.
- ↑ FAA. "Air Traffic By The Numbers". Accessed October 31, 2017
- ↑ [99], Congress.gov. "H.R.2997 - 21st Century AIRR Act". Accessed October 31, 2017.
- ↑ Crichton, John (2015). "The NAV CANADA Model". The Journal of Air Traffic Control. 57 (2): 33–35.
- ↑ [100], U.S. House of Representatives Report, 2014.
- ↑ [101], Delta, "THE COSTS OF PRIVATIZING AIR TRAFFIC CONTROL AND HOW IT WILL IMPACT AIRLINE TRAVELERS".
- ↑ [102], Bureau of Transportation Statistics. "Rural Airports".
- ↑ [103], Delta. "THE COSTS OF PRIVATIZING AIR TRAFFIC CONTROL AND HOW IT WILL IMPACT AIRLINE TRAVELERS".
- ↑ [104], AOPA. "ATC PRIVATIZATION PITFALLS: POINT BY POINT", accessed September 12, 2017.
- ↑ Next Generation Air Transportation System (NextGen)
- ↑ Post, G. (2017, June 05). Trump Seeks To Privatize The Nation's Air Traffic Control System. Retrieved from https://thelibertarianrepublic.com/trump-seeks-privatize-nations-air-traffic-control-system/
- ↑ Debra Werner. (2017, May 31). Privatizing air traffic control. Aerospace America. Retrieved from https://aerospaceamerica.aiaa.org/features/privatizing-air-traffic-control/
- ↑ Debra Werner. (2017, May 31). Privatizing air traffic control. Aerospace America. Retrieved from https://aerospaceamerica.aiaa.org/features/privatizing-air-traffic-control/
- ↑ Niel Ritchie & Selena Shilad. (2017, September 13). Air traffic control privatization is an attack on rural America. The Washington Times Retrieved from. http://www.washingtontimes.com/news/2017/sep/13/air-traffic-control-privatization-is-an-attack-on-/
- ↑ Niel Ritchie & Selena Shilad. (2017, September 13). Air traffic control privatization is an attack on rural America. The Washington Times Retrieved from. http://www.washingtontimes.com/news/2017/sep/13/air-traffic-control-privatization-is-an-attack-on-/
- ↑ Creed, Kathryn. (November, 2015). ATC Privatization Unlikely to Mitigate Delays and Cancellation. Logistics & Transportation. Retrieved from. https://www.forbes.com/sites/kathryncreedy/2015/11/24/your-money-atc-privatization-unlikely-to-mitigate-delays-and-cancellations/#7e9509b85751
- ↑ Markey and Blumenthal Statement on New Data That Reveals Airline-caused Factors Biggest Cause of Flight Delays. (2016, August 24). Retrieved from https://www.markey.senate.gov/news/press-releases/markey-and-blumenthal-statement-on-new-data-that-reveals-airline-caused-factors-biggest-cause-of-flight-delay
- ↑ Joon Ian, Wong. (2017, September 28). A Major Check-in Systems Crash is Disrupting Airports Worldwide. Retrieved from. https://qz.com/1089524/amadeus-altea-system-airport-check-in-delays-in-gatwick-heathrow-changi-frankfurt-reagan-charles-de-gaulle/
- ↑ Joon Ian, Wong. (2017, September 28). A Major Check-in Systems Crash is Disrupting Airports Worldwide. Retrieved from. https://qz.com/1089524/amadeus-altea-system-airport-check-in-delays-in-gatwick-heathrow-changi-frankfurt-reagan-charles-de-gaulle/
- ↑ https://ssrn.com/abstract=2461424.
- ↑ https://www.stb.gov/stb/about/overview.html.
- ↑ http://bnsf.com/about-bnsf/our-railroad/.
- ↑ http://bnsf.com/about-bnsf/bnsf-review/2015/
- ↑ http://www.thecanadianencyclopedia.ca/en/article/canadian-national-railways/
- ↑ http://www.cn.ca/en/about-cn/who-we-are/facts-and-figures
- ↑ http://www.cpr.ca/en/about-cp/our-history
- ↑ http://nscorp.com/content/nscorp/en/the-norfolk-southern-story.html.
- ↑ http://www.nscorp.com/content/nscorp/en/about-ns/corporate-profile.html.
- ↑ http://www.up.com/aboutup/special_trains/heritage/index.htm.
- ↑ http://www.up.com/aboutup/corporate_info/uprrover/index.htm.
- ↑ https://people.hofstra.edu/geotrans/eng/ch9en/appl9en/ch9a1en.html
- ↑ http://www.let.rug.nl/usa/essays/1801-1900/the-iron-horse/the-interstate-commerce-act.php
- ↑ https://papers.ssrn.com/sol3/papers.cfm?abstract_id=2461424
- ↑ https://www.aar.org/policy/economic-regulation
- ↑ http://ntl.bts.gov/DOCS/contents/ch4d.pdf
- ↑ http://www.american-rails.com/class-i-railroads.html
- ↑ https://ssrn.com/abstract=2461424
- ↑ http://www.coalage.com/features/3452-railroad-performance-a-quick-look-at-a-few-railroad-measures.html#.WATvHjbrtYc
- ↑ https://smart-union.org/news/rail-revenue-adequacy-faces-challenge-stocks-down/
- ↑ http://www.railwayage.com/index.php/regulatory/stb.html?channel=&Itemid=492
- ↑ http://cbpp.georgetown.edu/sites/cbpp.georgetown.edu/files/Mayo-Macher-Pinkowitz-revenue-adequacy-good-bad-ugly.pdf
- ↑ http://adata.org/sites/adata.org/files/files/ADAProfile_2016.pdf
- ↑ https://www.ada.gov/cguide.htm#anchor62335
- ↑ https://www.ada.gov/taprog.htm
- ↑ https://www.ada.gov/enforce_footer.htm
- ↑ https://www.ada.gov/mediate.htm
- ↑ https://www.ada.gov/regs_footer.htm
- ↑ http://www.hilc.org/hTimeistory/
- ↑ http://www.pva.org/site/apps/nlnet/content2.aspx?c=ajIRK9NJLcJ2E&b=6350111&ct=9175473
- ↑ http://www.ecfr.gov/cgi-bin/text-idx?tpl=/ecfrbrowse/Title28/28cfr36_main_02.tpl
- ↑ https://www.ada.gov/regs2010/2010ADAStandards/2010ADAStandards.pdf
- ↑ http://adata.org/factsheet/parking
- ↑ http://chfs.ky.gov/NR/rdonlyres/0B29A6DB-200B-450B-8D06-97BA247452C1/150156/UsingVolunteersinHandicappedParkingLawEnforcement0.pdf
- ↑ . http://www.latimes.com/business/la-fi-laz-disabled-parking-meters-20141210-story.html
- ↑ http://www.parking.org/2016/01/27/tpp-2015-08-solutions-to-disabled-parking-placard-usage/
- ↑ http://www.lamag.com/driver/thirteen-facts-about-handicapped-parking-in-l-a/
- ↑ http://www.mass.gov/ig/publications/reports-and-recommendations/2016/abuse-of-disability-parking-placards-in-massachusetts-february-2016.pdf
- ↑ http://www.houstontx.gov/parking/volunteer.html
- ↑ http://www.greenvilleonline.com/story/news/local/2014/09/23/qamy-enforcing-handicapped-parking/16098007/
- ↑ http://www.houstontx.gov/parking/accessibleparking.html
- ↑ https://itunes.apple.com/us/app/parking-mobility/id337141354?mt=8
- ↑ http://www.ncd.gov/rawmedia_repository/17362824_35e8_449d_92c1_5fbbdfc79c7c.pdf
- ↑ http://www.handicappedfraud.org/index.php
- ↑ http://www.mass.gov/ig/publications/reports-and-recommendations/2016/abuse-of-disability-parking-placards-in-massachusetts-february-2016.pdf
- ↑ https://www.access-board.gov/guidelines-and-standards/buildings-and-sites/about-the-ada-standards/background/adaag#4.6
- ↑ http://ddot.dc.gov/page/red-top-meter-program-frequently-asked-questions
- ↑ http://ddot.dc.gov/page/disability-parking
- ↑ http://ddot.dc.gov/node/538322
- ↑ http://wjla.com/news/local/d-c-s-red-top-parking-meters-cause-confusion-debate-114513
- ↑ http://www.nyc.gov/html/dot/html/motorist/pppdinfo.shtml#nyspermit
- ↑ https://www.dmv.ca.gov/portal/dmv/detail/pubs/newsrel/newsrel14/2014_43
- ↑ http://www.latimes.com/local/california/la-me-pol-placards-20150730-story.html
- ↑ http://sanfrancisco.cbslocal.com/2016/05/25/california-audit-of-dmv-placards/
- ↑ http://www.shouselaw.com/disability-placards.html
Automated Trucks
Summary
[edit | edit source]Autonomous trucks have developed from a long line of trucking innovations over the last 120 years, from originally being automobile haulers to being fully automated and delivering 2,000 cases of Budweiser 120 miles. This wave of the future within the shipping and distribution industry involves a significant amount of planning at many state and local government levels in regards to many different policy issues. Technology (i.e. V2V, V2I, and V2P) being one of the key issues within this development, and sets the tone for other areas such as; safety, employment, training and licensing, environment and energy, and regulations. Automated trucks are relatively new, however, researchers suggest that the impact will be substantial within the logistics industry in regards to areas such as; fuel efficiency, human error that cause accidents (which will decrease damages to consumer products carried), and labor costs by cutting out the need for human drivers. With continuous improvement, it is safe to say that there are more lessons to be learned within the automated truck industry and Self-Driving Trucks Are Going to Hit Us Like a Human-Driven Truck.[1]
Annotated List of Actors
[edit | edit source]National Highway Traffic Safety Administration (NHTSA)
- NHTSA was established by the Highway Safety Act of 1970 and is dedicated to achieving the highest standards of excellence in motor vehicle and highway safety. It works daily to help prevent crashes and their attendant costs, both human and financial.[2]
Federal Highway Administration (FHWA)
- FHWA provides stewardship over the construction, maintenance, and preservation of the Nation's highways, bridges, and tunnels. FHWA also conducts research and provides technical assistance to state and local agencies in an effort to improve safety, mobility, and livability, and to encourage innovation.[3]
United States Department of Transportation
- The mission of the USDOT is to serve the United States by ensuring a fast, safe, efficient, accessible and convenient transportation system that meets our vital national interests and enhances the quality of life of the American people, today and into the future.[4]
- Federal Motor Carrier Safety Administration (FMCSA)
- The FMCSA was created on January 1, 2000 as part of the Motor Carrier Safety Improvement Act of 1999 under the USDOT. Its primary mission of the FMCSA is to reduce crashes, injuries and fatalities involving large trucks and buses.[5]
- Federal Motor Carrier Safety Administration (FMCSA)
American Association of Motor Vehicle Administrators (AAMVA)
- The AAMVA is a tax-exempt, nonprofit organization developing model programs in motor vehicle administration, law enforcement and highway safety. The association also serves as an information clearinghouse in these areas, and acts as the international spokesman for these interests. Founded in 1933, AAMVA represents the state and provincial officials in the United States and Canada who administer and enforce motor vehicle laws. AAMVA’s programs encourage uniformity and reciprocity among the states and provinces. The association also serves as a liaison with other levels of government and the private sector. Its development and research activities provide guidelines for more effective public service. AAMVA’s membership includes associations, organizations and businesses that share an interest in the association’s goals.[6]
Federal Trade Commission (FTC)
- The FTC filed a comment on the National Highway Traffic Safety Administration’s (NHTSA) advance notice of proposed rulemaking related to vehicle-to-vehicle communications. As the lead federal agency charged with protecting consumer privacy, the FTC in its comment expresses support for NHTSA’s deliberative, process-based approached to addressing privacy and security risks, which includes a privacy risk assessment. The comment also commends NHTSA for designing a V2V system to limit the data collected and stored to only that which serves its intended safety purpose.[7]
National Traffic Safety Board (NTSB)
- The NTSB is an independent Federal agency charged by Congress with investigating every civil aviation accident the United States and significant accidents in other modes of transportation – railroad, highway, marine and pipeline. The NTSB determines the probable cause of the accidents and issues safety recommendations aimed at preventing future accidents. In addition, the NTSB carries out special studies concerning transportation safety and coordinates the resources of the Federal Government and other organizations to provide assistance to victims and their family members impacted by major transportation disasters.[8]
State Department of Motor Vehicles (DMVs)
- (For example) The Virginia DMV's responsibilities include vehicle titling and registration, driver licensing and maintenance of driver and vehicle records. The agency also monitors the state's trucking industry and serves as the state's Highway Safety Office. In addition, the agency effectively enforces motoring and transportation-related tax laws, and efficiently collects and distributes transportation-related revenues.[9]
Law Enforcement
- Customs & Border Protection (CBP)
- CBP rules and regulations will have to address the stopping and searching of autonomous vehicles. The technology will need to be able to recognize and communicate at border crossings.
- State and Highway Patrols
- Domestic law enforcement will need to be able to communicate with autonomous vehicles if there are ever any needs for citing traffic violations (i.e. speeding, broken lights, etc.).
Developers of Automated Vehicle Technology
- Peloton Technology
- Peloton is an automated vehicle technology company working to reduce crashes and enhance fuel mileage in trucking. Their technology connects trucks using direct Vehicle to Vehicle (V2V) communications that allow the non-lead truck to react immediately to the actions of the truck in front of it. This collision mitigation system constantly deploys radar sensors to detect stopped or slowed vehicles ahead of the truck to alert the driver and apply brakes when needed.[10]
- Daimler Trucks
- Manufactured the first licensed autonomous commercial truck in May 2015 to operate on an open public highway in the United States, called the Freightliner Inspiration Truck.[11]
Teamsters
- Founded in 1903, the Teamsters mission is to organize and educate workers towards a higher standard of living. There are currently 1.4 million members under 21 Industrial Divisions that include virtually every occupation imaginable, both professional and non professional, private sector and public sector.[12]
- Teamsters - Freight Division
- The Freight Division represents the interests of more than 75,000 Teamsters members from approximately 200 local unions. Freight employees include truck drivers, dockworkers, mechanics, and office personnel. On a daily basis, the Freight Division coordinates National Grievance Panels, Regional Grievance Panels, change of operations, and negotiations of individual contracts. The Freight Division also responds to questions from members and local unions concerning worker benefits, equipment safety, grievances, change of operation, and organizing new members. The Division works closely with other departments to further the interests of freight members.[13]
- Teamsters - Freight Division
American Trucking Association (ATA)
- ATA is the largest national trade association for the trucking industry. Through a federation of 50 affiliated state trucking associations and industry-related conferences and councils.[14]
Training Programs for Truck Drivers
- Professional Truck Driver Institute (PTDI)
- Since 1986, the PTDI has been working with the carriers, truck driver training schools, insurance industry, and government to make safety a national #1 priority in the trucking industry. PTDI is the first nonprofit organization to develop uniform skill performance, curriculum, and certification standards for the trucking industry and to award course certification to entry-level truck driver training courses and motor carrier driver-finishing programs. Our goals are to advance truck driver training, proficiency, and professionalism and to put quality drivers on the roads. PTDI works with carriers and schools throughout the certification process to obtain national recognition that their programs meet these standards. PTDI has been certifying entry-level truck driver training courses since 1989.[15]
Correlated Businesses
- Truck stops, hotels, restaurants, and other services that have built up around freight traffic have a vested interest in the continuation of truck driving, and will have to integrate autonomous vehicles into their operations.
Timeline of Events
[edit | edit source]1898: Alexander Winton from Cleveland Ohio invented the Semi-Truck in 1898 calling it the "Automobile Hauler." [16]
1899: Winton Motor Carriage started the manufacturing the "Automobile Hauler" for its own use and for other automobile manufacturers. [17]
1914: August Charles Fruehauf incorporated the "Freuhauf Trailer Company" and developed the carriage semi trailer. [18]
1939: Company in Tacoma Washington called "Peterbilt" began selling its semi-trucks. [19]
1942: Industries first commercial vehicle with an all-aluminum cab debuts and is called the "shovelnose." [20]
1950: Freightliner sells the first trans-continental cab-over-engine sleeper to a company named "Hyster" that could haul a 35 ft trailer. [21]
1953: Freightliner introduced the first overhead sleeper in the model WF64 for long haul operations in order to meet federal laws and restrictions. [22]
1966: In cooperation with Cummins develops a prototype dolly in order to carry doubles and triples through the mountain passes with application of the brakes slowing down the trailer. [23]
1974: Air ride suspension was developed and patented in order to give drivers on the road a more comfortable ride and to mitigate wear and tear on tractor trailers on the roads and highways. [24]
1982: The Surface Transportation Act of 1982 is established to address many issues in the transportation industry in order to standardize truck size and weight limits bringing national consistency to regulations for the first time. [25]
2013: A coal mining company named "Rio Tinto" moved 100 million tons of coal by April. [26]
2015: Nevada grants first license to operate an autonomous truck on public roads in the United States to Daimler Trucks North America.[27]
2016: United States DOT issues Federal policy for automated vehicles, setting clear expectations for development and deployment by manufacturers and identifying Federal and State roles for regulation. [28]
2016: Otto truck (owned now by Uber after a $680 million dollar purchase) drives 2,000 cases of Budweiser beer on 120 mile journey without a driver and full automation.[29]
Maps of Locations
[edit | edit source]States with Enacted Autonomous Vehicles Legislation
U.S. Interstate Highway System
Clear Identification of Policy Issues
[edit | edit source]Technology - Development of technology includes tools that ensure safe and accurate vehicle operation. The primary considerations for technology fall into the following categories: vehicle-to-vehicle (V2V), vehicle-to-infrastructure and vehicle-to pedestrian (V2P). Comprehensively, in the United States, the communication between the vehicle and any other entity is referred to as vehicle-to-anything or V2X. Overarching concerns for V2X communication systems include the use of the wireless spectrum, device verification (see Security section for more information), real time environment capacity, system updates and the end-of-life for DSRC systems or other needed technology/equipment. The debate is ongoing whether V2X should run on its own platform due to the fear of interference and over saturation, or whether current platforms (wireless, 3G, 4G, etc.) should be used. Real-time communication is also of concern. The threshold of all systems is unknown concerning message receipt and delivery. For instance, in a congested interstate, how many vehicles can be present and communicating effectively at one time, without error? Technology updates are being considered, as well. It is difficult to predict the extent of user acceptance for implementing these updates. If updates occur automatically, it will increase the ability for systems to stay current and maintain cross-communication, however, if the vehicles need to be taken into the dealer or the infrastructure equipment needs to be replaced/manually updated, this cause risk to accuracy and effectiveness between systems. Furthermore, the life cycle of the technology being used is unknown. What will the process be when the technology needs to be replaced?[30]
- Vehicle-to-Vehicle (V2V) - V2V communications refers to a system designed to transmit basic safety information between vehicles to facilitate warning to drivers concerning impending crashes. V2V communication components include on-board sensors, cameras and radar applications. These components address crash avoidance and crashworthiness to ensure safety of the vehicle, the operator/passengers, surrounding infrastructure, other vehicles, other operators/passengers and pedestrians. On-board communications utilize dedicated short-range radio communication devices (DSRC) to transmit messages regarding vehicle speed, vehicle heading, brake status, etc. to other vehicles. In turn, through DSRC other vehicles transmit messages back with complimentary information. V2V communication is being developed by multiple companies and countries. To avoid limitations by heterogeneous technology, there is pressure to the development industry to create fused systems that have the capacity to communicate with each other and that use an identical or nearly identical messaging language. Similar to differences in spoken languages, variation in V2X communication can cause errors, in turn increasing the possibility of accidents. Additional in-vehicle components of V2V systems are memory, gps receivers, safety application electronic control units, driver-vehicle interfaces, and the vehicle's internal communications network.[31]
- Vehicle-to-Infrastructure (V2I) - V2I communications refers to a system designed to transmit information between the vehicle and infrastructure to include safety information, location information, and information regarding other vehicles, traffic congestion, etc. To support a connected vehicle core system architecture, the architecture of the system includes dynamic mobility applications to provide real-time traffic info, road weather applications, and real time information synthesis safety for machine to machine communication (Aeris). There are numerous considerations that V2I communications must encompass. Some of these considerations include: Signal priority for transit and emergency vehicles, roadway maintenance, density of pedestrian traffic, traffic signal timing, red light violation warning, curve speed warning, reduced speed zone warning, stop sign gap assist, stop sign violation warning, weather information, oversized vehicle warning, etc.[32]
- Vehicle-to-Pedestrian (V2P) - V2P communications refers to a system designed to transmit information between the vehicle and pedestrians. This includes safety information and location information. Vehicle-to-pedestrian communication is a debated development. Unlike a vehicle or the surrounding infrastructure, permanent hardware component(s) with an embedded communications system are not feasible. Some solutions to provide the vehicle, infrastructure and pedestrian with safety and location information, beyond identification through radar or cameras, include having the pedestrian utilize a wireless equipped device, such as a cellphone, to send and receive information.[33]
Environment and Energy - The impending impact on the environment and energy from the conversion of standard automobiles to highly autonomous vehicles (HAVs) is difficult to predict with complete accuracy, however, there will undoubtedly be an impact to fuel economy, traffic congestion, and carbon emissions. Seeing the full benefit to our environment and the impact on energy conservation will not be fully realized until wide-spread adoption of automated vehicles and automated trucking occurs. This is not anticipated to occur until, at least, 2035.[34]
- Fuel Economy - For automated trucks, specifically, fuel economy will improve significantly as adoption of automated trucks grows. Truck platooning is one means of improving fuel economy. This allows trucks to travel "together" with a distance of 30 feet between vehicles. Platooning minimizes shifts in gears, de/acceleration, unnecessary stopping, unnecessary idling. Depending on the experience of a non-automated truck driver, the type of transmission (manual, automatic-manual or automatic), and surrounding operators, fuel economy is greatly decreased. In addition to platooning, the incorporation of autonomous technology in heavy vehicles, like tractor-trailers, could cause a decrease in weight due to a transition to either automatic transmission or, more likely, electric trucks. Trucks and cars alike, during the autonomous transition, are expected to spur a transition to lighter, electric vehicles.[35]
- Traffic Congestion - Traffic congestion could be decreased by automated vehicles, as a whole. There is an expectation that automated vehicles will increase a desire to pursue ride sharing, decreasing the amount of vehicles on the road. However, the reduction in cost and accessibility of transportation by automated vehicles, once fully implemented, may contrarily, increase demand. This may also cause a preference for consumers to use automated vehicles through private operating or ride sharing, rather than using current transit modes (metro, bus, etc.). The demand for trucking for trade and commerce is increasing. Currently, the cost and the shortage of qualified drivers imposes limitations to this increasing demand. Once automated trucks are available nation-wide, the reduction in cost and elimination of needing a qualified operator, this demand can be fulfilled. This opportunity will cause an increase in traffic congestion by automated trucks. Exploration in constructing lanes solely for automated truck traffic is underway, but this is costly, and not guaranteed.[36]
- Carbon Emissions - Carbon emissions will be reduced through automated trucking by reducing idling time. Also, if a transition to electric trucks ensues, fuel use and carbon emissions will be further reduced.[37]
Training and Licensing - Training vehicle manufacturers, technology developers, infrastructure engineers, state DoTs/DMVs/law enforcement, key federal players (DoT, NHTSA, FHWA, etc.), drivers and pedestrians on automated technology will be an enormous learning curve for many. Today's society is becoming more and more technologically dependent and familiar. Human machine interface (HMI) concerning automated vehicles is still of great concern, despite the increased technology capacity in our society. Licensing for vehicles will evolve, or depending on an individual's perspective, digress to a state where the driver in the vehicle knows how to operate the technology, but not the vehicle itself. What will this transition look like for automated trucks, the majority of current drivers requiring a Class A Commercial Driver's License? Along with training on the technology, the industry is concerned with consumer acceptance, as well.[38]
- Training - At this time, training on automated technology is through model programs, publications, and industry and global partnerships. In order to develop systems that can interact with one another nationally and globally, communication between key players is essential. Autonomous vehicles will be safer, more reliable and more effective if there is shared communication between organizations and nations. One example of training and learning through partnership is seen in the relationship between the U.S. DoT and the European Commission. They have been working together in order to develop V2V that is cooperative between systems. Model programs for automated vehicles and automated trucks are limited to a handful of states. Nevada is one of the leading states in innovation and policy for automated trucking. It is the first state with a licensed automated, electric truck through Daimler Corporation. The lessons learned from this state's initiatives are thoroughly documented. Resulting policy and publications have been available, to some extent, for other entities to research and learn from, continuing training in V2V communication and deployment. There has also been a push for federally developed training. The DoT has established an ITS Joint Program Office (ITS-JPO) that produces curriculum in support of Professional Capacity Building (PCB). The curriculum currently available is meant to enhance professionals' and the public's understanding of V2V systems, V2I systems, system deployment, challenges, and current/future applicable issues for automated vehicles. They have ITS training modules, "Talking Technology in Transportation (T3)" webinars, conferences, workshops, web-based and classroom courses. Globally and nationally, conferences and workshops have been established. For example, the inaugural Automated Vehicles Symposium supported through the Transportation Research Board (TRB) and Association for Unmanned Vehicle Systems International (AUVSI) occurred in 2012.[39]
- Licensing - Licensing on automated trucks has not been solidified. There are several considerations to licensing an operator on a fully autonomous truck. Tractor-trailers are combination vehicles which fall under a Class A license for certification. This license is further specialized if the cargo being carried is hazardous, with a hazardous endorsement and restricted depending on the components of the vehicle (air brakes, manual v. automatic transmission, etc.) and areas of authorization (intrastate v. interstate). There is a national minimum requirement for licensing on a Class A vehicle developed by the American Association for Motor Vehicle Administrators and approved by the Federal Motor Carrier Safety Administration (FMCSA) and the DoT. Requirements include written tests (General Knowledge, Air Brakes, Combination Vehicle, Tank (if applicable), Hazardous Material (if applicable)), a practical application (vehicle inspection, basic control skills test (backing/parking), and a road test). Testing is administered through state DMVs. As society transitions to automated vehicles, the requirements for an operator will be reduced and the requirements for the vehicle and the vehicle's technology will increase.[40] Requirements have not been established yet. The DoT will need to determine: how to test the operator on the technology; if, how and to what extent the operator will be expected to maintain an understanding of the operation of the vehicle as a fail safe; if, how, and to what extent to restrict the vehicle and/or operator based on cargo type, vehicle type, interstate/intrastate transit, vehicle components. The timeline to transition the certification process is also imperative. Age consideration and operator hours/training will be evaluated too. Right now, an individual must be 21 years of age to hold a Class A license (pilot in place to allow 18 to 21 year olds operate). Because the transition to automated trucks will not be immediate, there will be a need to maintain the current certification process and new certification process until a full transition has occurred. What impacts will this have on workload? What impacts will this have on law enforcement and commerce regulation of trucking?[41]
Regulation - Key players have identified the need for national regulation to regulate automated vehicles. Like the development of previous modes of transportation (railroad, mass transit, automobiles, etc.) navigating the roles of federal government v. state government and the roles of public v. private authority is a challenge. The lanes of authority cross due to overarching issues such as public safety, public security, liability, and commerce.
- Federal v. State - The beginnings of researching and developing automated infrastructure and vehicles can be linked back to the 1990s with the introduction of the Automated Highway System (AHS) later renamed to the Intelligent Vehicle Highway System (IVHS), now known as the Intelligent Transportation System (ITS). In correlation with the 1991 Intermodal Surface Transportation Efficiency Act (ISTEA), $600 million dollars supported researching this initiative, subsequently averaging $100 million annually, in the following years. The federal government has a vested interest in autonomous vehicles and infrastructure due to public safety expectations. This interest progressed with the 1997 Intelligent Vehicle Initiative, the 2003 Vehicle Infrastructure Integrity Initiative, and the 2006 Crash Avoidance Metrics Partnership (CAMP), to name a few. For trucks, or heavy vehicles, V2V technology is expected to address 81 percent of crash causes and V2I technology is expected to address 15 percent of crash causes, averaging to 79% of causes identified by the 2009 DoT Crash Analysis Report. This could significantly reduce the amount of accidents where a truck is involved. [42]
DoT and the Federal Government are responsible for regulating motor vehicles and motor vehicle equipment. NHTSA is responsible for: setting Federal Motor Vehicle Safety Standards (FMVSS) for new motor vehicles and motor vehicle equipment; enforcing FMVSS compliance; investigating and managing the recall and remedy of non-compliance and safety-related motor vehicle defects and recalls on a nationwide basis; communicating with and educating the public about motor vehicle safety issues; and issuing guidance for vehicle and equipment manufacturers to follow. In September 2016, the U.S. DoT released the Federal Automated Vehicle Policy. This was a major step in providing regulation during the development stage of automated technology, rather than post-development. Although it does not address all concerns, or provide an answer to all challenges, it shows the initiative of the federal government to play an active and proactive role in automated vehicle deployment.[43]
States are responsible for regulating the human driver and most other aspects of motor vehicle operation. This includes: licensing (human) drivers and registering motor vehicles in their jurisdictions; enacting and enforcing traffic laws and regulations; conducting safety inspections where states choose to do so; and regulating motor vehicle insurance and liability. Once licensing applies primarily to the technology, not the operator, the federal government will set the minimum requirements for vehicles and equipment. Right of way concerning infrastructure will be overseen by the federal government, but more than likely, as with current policy, states will hold responsibility for maintenance and development in their jurisdiction. State policy for automated vehicles will be subordinate to federal regulation, however, this has not prevented states from being proactive in developing policy, as well. States like Nevada, Washington, D.C., Arizona and California have been among the first states to develop policy (2011-2015) for licensing and permitting automated vehicles.[44]
- Public v. Private - The main discussion involving authority between public and private industry is related to the automobile, technology, equipment and infrastructure manufacturers. Because the federal government will determine minimum requirements for safety and security of autonomous vehicles and technology in autonomous trucks and the manufacturers must produce and test their equipment according to these standards, there has to be a means of oversight. With current automobile production, there is oversight by the federal government. The expectation is the same for autonomous vehicles. The point of contention will lie in the privacy of proprietary information regarding the technology. All companies will be required to meet the same standard and capacity to communicate between different makes/models and equipment/communications systems. This will limit the growth of some companies in technology innovation and raise the expectation to share developments. The second area of concern lies in the ability of companies to test the new technology. Will the companies test the technology on their own or will independent test facilities need to be made? Also, concerning oversight of technology and data, will the government monitor this or will an independent, third party? There are various risks and conflicts of interest involved with either approach.[45]
Safety and Insurance - Automated trucking and automated vehicle promotion over the past two decades has been greatly fueled by its promise to increase safety on the road, and reduce deaths and injuries by vehicular accidents. According to the DoT Crash Analysis Report, automated technology is expected to address 79% of accident causes contributing to accidents where a commercial truck is involved. Despite the probability of automated trucking meeting this predicted expectation in increasing safety standards, the risk that it will not and the risk involved with trusting a new technology has caused a concern for insurance companies. Determining who will agree to provide insurance and how much the bill will cost to do so is a significant hurdle that will need to be overcome before automated trucking is widely accepted. Concerning regulation of safety concerns, requirements and system updates; the DoT in conjunction with NHTSA will be the primary developers and regulators of the safety standards. All involved in manufacturing, sale and purchase will hold a role in ensuring safety standards are met and maintained, as well.[46]
Legal and Ethical - Legal and ethical concerns with automated vehicles will affect numerous entities from insurance companies, to the car manufacturer, the seller, the driver and the software developer. The software will need to be programmed to make ethical decisions usually left to humans' discernment. For example, if an automated truck is in a scenario where it will either collide with another vehicle or be forced off an on ramp, what will the software program the vehicle to do? There is continued argument whether this ethical choice should be determined at the federal level or by the actual manufacturer of the software.[47]
Privacy and Security - Privacy and security of this new technology is essential. For automated trucks, carrying cargo, and being of significant size to cause a robust amount of damage, if privacy or security are compromised, the effects could be devastating. Already written into policy is the prevention of individual or vehicle data tracking using the technology, by companies, the government, states, authorities, etc. Also, privacy intrusion through this technology is prohibited. The details of regulating privacy and security have not been solidified, nor have the repercussions for occurrences. The complex technology also generates several characteristics that translate into a vulnerability: powerful capacity (data rate capabilities/computation/storage), high mobility (difficult nodes prediction), dynamic network topology (data can join and leave the system quickly), time sensitivity/latency (to ensure safety, the data needs to be received in a timely manner), sufficient energy (resource rich devices with complex algorithms), physical protection required, wireless communication, heterogenous technologies, heterogeneous operating environments. These characteristics are researched and utilized advantageously by attackers.[48] Attackers fall into three general categories:
- Active v. Passive - Active attackers seek to harm the system nodes directly. Typically, these attackers are insiders, who have internal access to the system. Passive attackers seek information acquisition between the system nodes, typically to prepare for an attack through research and pattern identification. Passive attackers are usually outsiders, external to the system.[49]
- External v. Internal - External attackers do not have authorization or authentication to access the system. Internal attackers have authorization and/or authentication to enter the system.[50]
- Malicious v. Rational - Malicious attackers do not have a specific target. Rational attackers have a specific target.[51]
ITS attacks could include attacks on availability, identification and authenticity, confidentiality and privacy, integrity and data trust and non-repudiation and accountability. Examples of availability attacks on ITS are: denial of service, jamming, broadcast tampering, black hole, malware, spamming, etc. Examples of identification and authenticity attacks include: man in the middle attack, replay, GPS spoofing, position faking, masquerading, key/certification replication, etc. Examples of confidentiality and privacy attacks include: eavesdropping, traffic analysis, information gathering, etc. Examples of integrity and data trust include: message tampering, message suppression and alteration, etc. Examples of non-repudiation and accountability attacks include: loss of event traceability, wormhole, etc.[52]
In order to combat all attackers to automated trucks, V2X needs to incorporate: user, source, and location authentication; traceability and revocation authority; data integrity; privacy and anonymity for the user and the vehicle; availability and real time capabilities of data; non-repudiation or unique association of an ITS entity; robustness versus external attackers. Security mechanisms to meet the intent of these requirements include: encryption on sensitive messages; randomizing traffic patters; message signatures; trusted hardware modules; active detection systems; message signature and other integrity metrics for content delivery; certificate accompanying message signature; check mechanisms; pseudo-random frequency hopping; unsinkability ID-based systems for user privacy.[53]
Employment - The current trucking industry driver workforce is decreasing. It is an aging industry. By 2022, it is predicted that the U.S. will be short around 240,000 truck drivers. At the same time, the American Trucking Association estimates that there are approximately 3.5 million truckers currently working. Automated trucks, once wide-spread, will eliminate the need for commercial drivers to operate the vehicle. This will assist in mitigating the anticipated driver shortage, increasing the ability to meet the growing shipping demand. It will also leave millions without jobs, or with a significant decrease in salary. It will be some time before there is no human behind the wheel of a tractor-trailer. This is, in part, attributed to public acceptance. Reasonably so, most individuals are not prepared to see a tractor-trailer traveling on the interstate without a human being in the vehicle. Also, companies who are shipping their product will need reassurance on its security before buying into this technology, despite the potential cost savings and increased throughput. Additionally, there is argument for always having an individual behind the wheel for cargo security, technology monitoring, and maintenance issues, etc. The "driver" wage is expected to decrease, along with the minimum age requirement, with transition to automated technology. Employment supporting infrastructure and technology for automated trucks will increase, but the majority of current truck drivers do not have an engineering or information technology background. Again, truck drivers are an aging workforce. Widespread implementation of automated trucks is not expected until 2035. A significant portion of older drivers will have aged out of the system at this point. Arguably, it may add value to train today's younger generation of truck drivers to support the industry through IT/customer service opportunities.[54]
Trade - Nearly 70% of all freight tonnage moved in the U.S. trucking is transported by trucks according to the American Trucking Association. Automated trucking can ameliorate barriers in fulfilling the industry's freight throughput to include: strict hours of service regulations placed on truck drivers; fuel deficiency; speed deficiency; need for safety; and the increasing driver shortage. Alleviating these barriers hold the potential for improving commerce. At the same time, considerations regarding insurance for the commodities being shipped; the process of documentation; obtaining signatures for ownership; safeguarding the freight; etc. need to be made.[55]
Narrative of the Case
[edit | edit source]Over the past decade, if not longer, automakers and tech companies have spent billions of dollars in an attempt to bring autonomous vehicles to the United States’ roads. Several states have introduced legislation to allow testing on their roads [citation], and Ford has promised to deliver a mass-produced, fully-autonomous vehicle for ride-sharing service by 2021[5]. Perhaps one of the first proposed applications of autonomous vehicles was to the trucking industry. As with any issue, there are positives and negatives to automated trucking, and advocates have emerged on both sides.
An analysis by the American Transportation Research Institute (ARTI) in 2013 found that the driver-based costs of trucking accounted for about one-third of all marginal costs for motor carriers[3]. Other estimates may vary, but it is clear that there are significant savings to be had for carriers if trucks become driverless. There could also be savings for carriers in the form of time. Currently, the Federal Motor Carrier Safety Administration mandates that drivers of property-carrying vehicles can only drive for 14 consecutive hours, and only after 10 consecutive hours off-duty[6]. Driverless trucks would not be forced to take mandatory rest periods, and could drive for many more hours. The ARTI study also found fuel costs to be a significant portion of marginal costs for carriers, at around 38%[3]. This figure may have been reduced in recent years, as the average price of diesel fuel dropped over a dollar per gallon from 2013 to 2015[4]. However, there remains potential for carriers to realize savings, as driverless trucks unencumbered by limits on hours can travel at slower, more fuel-efficient speeds. Finally, perhaps the most important advantage of automation in trucking would be improved safety. In 2014, there were 3660 fatalities in crashes involving large trucks, 16% of which were the occupants of the trucks themselves[1]. Obviously, if a truck does not have a driver, a driver cannot be killed in a crash. Further, an automated truck that works as designed would never be involved in a crash at all.
However, progress in automation does not come without drawbacks, the most obvious of which is job loss. As of May 2015, there were over 1.6 million truck drivers in the United States[2], and it is the most common job in more than half of the 50 states [citation needed]. Not only that, but many other industries benefit from trucking, such as gas stations, diners, and motels. These types of establishments will suffer without the business of truck drivers who need to make stops on their long-haul drives.
Lessons Learned
[edit | edit source]Proactive policy vs. reactive policy
- Link to release of US DOT policy from September 2016
Lack of a pilot location (complete testing environment)
- Without an isolated pilot location with a complete environment for testing, the technology can’t be evaluated comprehensively
- California passed bill in September 2016 to use for testing
Lessons to be learned (areas policy may fail to address in a timely manner)
- Spending
- Maintenance
- Privacy (sharing of data between vehicles)
Discussion Questions
[edit | edit source]How do you program ethics into automated technology? And who should make that decision?
If an automated truck is going to collide with another non-automated vehicle, does the truck minimize damage to itself and its occupant(s), or does it minimize damage to the non-automated vehicle and its occupant(s)?
What will the role of the truck driver be once trucks are automated? What training will be required?
How will automation in trucking affect the economy (e.g. loss of jobs)?
How will we ensure that an automated truck (or any automated vehicle) will not be utilized by terrorists?
How will automated trucks be maintained while in service?
Will an automated truck be programmed to pull over to the side of the road when it gets a flat tire?
Further Reading
[edit | edit source]- IEEE Xplore Document - Driver Model Based Automated Driving of Long Vehicle Combinations in Emulated Highway Traffic - http://ieeexplore.ieee.org/document/7313160/
- Electronic Systems Safety | National Highway Traffic Safety Administration (NHTSA) -http://www.nhtsa.gov/Research/Crash%20Avoidance/Electronic-Systems-Safety
- Automated Vehicles | National Highway Traffic Safety Administration (NHTSA) - http://www.nhtsa.gov/Research/Crash-Avoidance/Automated-Vehicles
- Intelligent Transportation Systems - Automated Vehicle Research - http://www.its.dot.gov/automated_vehicle/avr_plan.htm
- ATA Questions DOT Federal Autonomous Vehicle Policy - Canadian Trucking Alliance - http://cantruck.ca/ata-questions-dot-federal-autonomous-vehicle-policy/
- ATA: Self-Driving Trucks Are “Close To Inevitable” - TruckersReport.com - http://www.thetruckersreport.com/ata-self-driving-trucks-are-close-to-inevitable/
- Intelligent and Connected – ProQuest - http://search.proquest.com/docview/1146500355
- Transition pathways to fully automated driving and its implications for the sociotechnical system of automobility – ProQuest - http://search.proquest.com/docview/1774952127 • Disruptive technologies: Advances that will transform life, business, and the global economy - Driverless Transportation - http://www.driverlesstransportation.com/disruptive-technologies-advances-that-will-transform-life-business-and-the-global-economy-2645
- Automated trucks, warehouses seen transforming distribution - http://www.joc.com/trucking-logistics/trucking-equipment/automated-trucks-warehouses-seen-transforming-distribution_20160914.html
- Self-Driving Trucks Could Revolutionize The Industry - NASDAQ.com - http://www.nasdaq.com/article/selfdriving-trucks-could-revolutionize-the-industry-cm629509
References
[edit | edit source]
Disability Transport & TNO's
| This page or section is an undeveloped draft or outline. You can help to develop the work, or you can ask for assistance in the project room. |
Summary
[edit | edit source]Disability transport seems to be an ongoing issue in transportation. The disabled population relies heavily on public transportation and Transportation Network Operators (TNOs). Although para transit services have improved over the recent years, those with extreme mobility limitations are still unable to receive equitable service. Routine tasks that require minimal or no planning from an able bodied individual, become a hardship for people with limited mobility. According to FTA regulations, taxi companies are required to outfit their company owned fleets to be wheelchair accessible. However, Transportation Network Companies (TNCs) such as Uber and Lyft, are exempt from this regulation due to the fact that vehicles used for service are not company owned.
List of Actors
[edit | edit source]Uber
[edit | edit source]An innovative ride-sharing service that allows for customers to request a “taxi-like” service from the push of a button on their personal phones.
Lyft
[edit | edit source]A ride sharing application offering rides in minutes.
Persons with disabilities
[edit | edit source]People with disabilities, physical or mental, who request rides using taxis, Lyft or Uber platforms.
District of Columbia Taxicab Commission Accessibility Advisory Committee
[edit | edit source]Advises the DC Taxi Cab Commission on how to make taxicab service in the District more accessible for individuals with disabilities. Under the DC Taxi Act, the Committee was tasked with producing a comprehensive report and making recommendations to the Mayor and to the Council on issues regarding accessible taxi service.[56]
U.S. Access Board
[edit | edit source]A federal agency that promotes equality for people with disabilities through leadership in accessible design and the development of accessibility guidelines and standards for the built environment, transportation, communication, medical diagnostic equipment, and information technology.[57]
Yellow Cab Company of DC
[edit | edit source]Yellow Cab Company of D.C. is a family owned and operated business serving the Washington Metropolitan area since 1931 and provides Wheelchair Accessible taxicab services.[58]
Royal Taxi of DC
[edit | edit source]Pioneered Wheelchair Accessible Taxi service in Washington DC; starting with the Roll DC pilot program which began January 2010. Royal Cab was awarded new ramp-equipped taxi vehicles as part of the pilot project. All vehicles are now available for service.[59]
Blue Top Cab of Arlington, VA
[edit | edit source]Specializes in transporting special-needs passengers. Their accounts include the Virginia Department of Medical Assistance Services, the Virginia Department of Rehabilitative Services, the Virginia Department for the Visually Handicapped, the Arlington County Community Services Board, the Arlington County Department of Human Services and the Arlington Chapter of the American Red Cross.[60]
Friendly Cab of Arlington, VA
[edit | edit source]Provides 24 hours a day, 7 days a week, 365 days a year at your service. Serving in this area for last 70 years.[61]
Red Top Cab of Arlington, VA
[edit | edit source]Provides local and airport transportation 24 hours a day, 7 days a week. Red Top offers wheelchair accessible taxicabs.[62]
City of Alexandria's DOT Paratransit Program
[edit | edit source]The City of Alexandria's specialized transportation service for residents of the City of Alexandria and visitors who cannot use regular transit buses or rail due to their disability.[63]
Specialized Transit for Arlington Residents (STAR)
[edit | edit source]A shared ride paratransit service intended to provide a comparable level of transportation as provided by ART, Metrobus and Metrorail.[64]
TransportDC
[edit | edit source]A program in Washington, DC which allows MetroAccess users to use participating taxicabs for a fee of $5 with only a half-hour notice needed. The program has recently been downsized to only allow unlimited rides during the first half of each month. [65] [66]
Washington Metropolitan Area Transit Authority (WMATA)
[edit | edit source]Top provider of Washington, DC public transportation. Operator of the MetroAccess program for disabled persons in the Washington, DC metro area. [67]
Timeline of Events
[edit | edit source]July 1964 - Civil Rights Act of 1964 [68]
July 1990 – Americans with Disabilities Act of 1990 [69]
June 2010 – Uber launched in San Francisco as a black car service [70]
December 2011 – Uber expansion into the DC, Maryland, and Northern Virginia area [71]
April 2012 – UberX, Uber’s most popular and cheaper option launched [72]
June 2012-Lyft is launched in San Francisco [73]
August 2014 – UberWAV piloted in some areas, DC not included [74][75]
October 2014-Lyft allowed to operate in D.C.[76]
February 2015 – National Federation for the Blind v. Uber Technologies [77]
February 2015-Legislation legally allows Lyft to operate in VA [78]
July 2015-Lyft approved to operate in NYC [79]
December 2015 – UberTAXI with Wheelchair option launched in DC [80]
June 2016 – WMATA begins SafeTrack program [81]
July 2016 – TransportDC runs low on funding for FY16 [82]
October 2016 – TransportDC relaunches with new restrictions [83]
Maps of Locations
[edit | edit source]Policy Issues
[edit | edit source]Federal Laws & Regulations
[edit | edit source]Americans with Disabilities Act (ADA)
[edit | edit source]Title III (28 U.S.C. §36.201)
[edit | edit source]“No individual shall be discriminated against on the basis of disability in the full and equal enjoyment of the goods, services, facilities, privileges, advantages, or accommodations of any place of public accommodation by any person who owns, leases (or leases to), or operates a place of public accommodation.” [84]
Transportation Services for individuals with disabilities (ADA, Section 37.5 regarding discrimination) [85]
[edit | edit source]National Federation for the Blind v. Uber Technologies
[edit | edit source]National Federation for the Blind v. Uber Technologies stated that Uber violated Title III of the ADA. Uber, for federal purposes, was now considered a public transportation accommodation.[86]
FTA Regulations
[edit | edit source]Federal Transit Administration governing laws regarding public vehicles offering rides to the public. Section 37.77. This states that if a vehicle is used to provide transportation services, then the vehicle must be readily accessible to and usable by individuals with disabilities including those in wheelchairs. [87]
State & Local Laws
[edit | edit source]Virginia, Maryland, and the District of Columbia all consider Uber separate from the taxicab industry and more of a technology company that provides transportation services [88]. The Commonwealth of Virginia does not permit local governments to regulate Transportation Network Companies (TNCs). [89]
Taxis
[edit | edit source]Accessible Taxis
[edit | edit source]Although taxi services for the disabled population has improved over the last 10 years, accessibility issues remain in the Washington DC metro areas that prevent this demographic from enjoying the freedom of movement that others do. According to David Capozzi Executive, Director of the U.S. Access Board, as much as 10 percent of the customer base for taxi service consists of people with a disability affecting mobility, hearing, vision, thinking and other physical and mental processes.[90] Disabled customers are two times more likely to not have available taxi service than non-disabled. There simply are not enough wheelchair accessible vehicles (WAVs) available. According to the District of Columbia Taxicab Commission Accessibility Advisory Committee, 2015 Annual Report, in Washington DC, the number of wheelchair accessible vehicles (WAVs) in the past year has increased from 20 to a little over 100 (roughly 1.5% of the accessible taxi fleet). This is a significant increase, but there is still work to be done. The District is not alone, according to the National Council on Disability, “the lack of wheelchair-accessible taxi service is one of the most important transportation issues for people with disabilities in the United States."[91] There is availability of WAV taxis however trips must be planned and coordinated in advance and they do not accommodate the vast range of disabilities. For example, most WAVs cannot transport large wheelchairs with peripheral equipment attached. Additionally, taxicabs that are sedans are not required to be wheelchair accessible. Government recognizes the need for more WAV taxis and has developed policy to address it. Under the DC Taxi Act of 2012, each taxi company with 20 or more taxicabs in its fleet as of July 1, 2012, will be required to dedicate a portion of its fleet to wheelchair accessible taxis: 6 percent by December 31, 2014; 12 percent by December 31, 2016; and 20 percent by December 31, 2018.[92] The following information provides WAV options in the Washington DC, Arlington and Alexandria city areas.
Washington D.C. Wheelchair-Accessible Taxis:
[edit | edit source]Requesting an Accessible Taxicab:
According to Washington DC's City office, there are two taxicab companies in the District - Royal Cab and Yellow Cab - that have wheelchair accessible taxicabs as part of its fleet. The limited number of D.C. accessible taxicabs are ADA-compliant and designed for standard-sized power wheelchairs and standard-sized scooters.[93] Learn more about how to request an accessible taxicab, or to read frequently asked questions about the accessible taxicabs.
To reserve a trip on a wheelchair accessible taxi vehicle, you have the following options:
- Call one of the two taxi companies that offer accessible taxis in DC:
- Royal Taxi: 202-398-0500
- Yellow Paratransit: 202-544-1213
- Reserve a taxi online at:
- Royal Taxi: http://www.dctaxionline.com/ (Note: Be sure to select "Wheelchair accessible")
- Yellow Paratransit: http://www.orderyellowcab.com/ (Note: request a wheelchair accessible cab by selecting the Add Special Options drop down menu)
The cities of Alexandria and Arlington Virginia offer similar accessible WAV services as Washington DC. They are utilizing a combination of federal funds, tax credits, incentives, and governmental requirements to support and increase the number of accessible public VFHs.
Alexandria and Arlington, Virginia Wheelchair-Accessible Taxis:
[edit | edit source]Taxicab companies serving Arlington have wheelchair-accessible vehicles.[94] Passengers are encouraged to call ahead whenever possible; cabs may be requested in advance. The fare is set at the meter rate. Call the individual cab company for information or to arrange for service. Companies other than the ones listed below may also have accessible cabs.
- Blue Top Cab: 703-243-8294
- Friendly Cab: 703-892-4144
- Red Top Cab: 703-522-3333, 703-522-3331 (TTY)
Specialized Transit for Arlington Residents (STAR) is the paratransit component of Arlington Transit – ART. ART provides public fixed route bus services in Arlington County.[95] STAR serves Arlington residents who have difficulty using public fixed route transit due to the effects of age or disability.
STAR Business and scheduling office (Call Center): 703-892-TRIP (703-892-8747)
- Press “1” for reservation, cancellations, and trip information.
- Press “2” for administration dept.
TDD (Virginia Relay Center): 711
Web: www.ArlingtonSTAR.com
Alexandria's DOT offers transportation service for residents of the City of Alexandria and visitors who are disabled. Contact the Paratransit Coordinator at 703-746-4079 to arrange complementary paratransit service. Trips are provided by taxicabs and wheelchair accessible vans. DOT provides service throughout the City of Alexandria, City of Falls Church, Arlington County, Fairfax County and Fairfax City.
Alexandria DOT Service Operates seven days a week during the following times:
- Monday - Thursday: 5:30 a.m. to Midnight
- Friday - 5:30am to 3:00am
- Saturday - 6:30am to 3:00am
- Sunday - 7:00am to Midnight
Arlington, Virginia Taxicab Discounts for Disabled customers:
Companies other than the ones listed below may have discounts available.
- Blue Top Cab: offers a discount to passengers 55+ who request the discount from the driver at the time of the trip.
- Red Top Cab: sells coupon books at a 10% discount.
- Arlington Yellow Cab: sells coupon books at a 10% discount.
One of the most convenient means for passengers to arrange for a WAV is using a smartphone application.
Report Taxicab Discrimination
[edit | edit source]Examples of discrimination include refusal of service to:[96]
- An individual with a service animal;
- An individual with a collapsible wheelchair that fits into a car trunk;
- A passenger because of the requested destination within the District;
- Potential passengers because of their race or national origin; and
- Potential passengers because of their sexual orientation or gender identity.
To report discrimination of a Washington DC Taxi visit: http://dcforms.dc.gov/webform/dc-taxi-and-vehicle-hire-complaint-form
To report discrimination of an Alexandria or Arlington, Virginia Taxi you must file a Consumer Complaint at:[97]
- Alexandria - https://apps.alexandriava.gov/IntakeQuestionnaire/Default.aspx
- Arlington - https://topics.arlingtonva.us/human-rights/complaints/ada-grievance-form/
Complaints can also be submitted using one of the following options
By Mail:
Department of Motor Vehicles
Motor Carrier Services (TNC)
P.O. Box 27412
Richmond, Virginia 23269-0001
Via Fax:
804-367-1003
By Email:
mcsonline@dmv.virginia.gov
Over the Telephone:
804-249-5130
Uber
[edit | edit source]Overview
[edit | edit source]Over the past few years, paratransit services in the DC region have had service issues due to increased usage in the area. At the same time, new Transportation Network Companies, such as Uber, have emerged on the market. While these systems are being used for taxi services, they do not consider themselves taxi companies [98]. Therefore, typical regulations that involve taxicabs do not apply. This especially affected people with disabilities since these TNCs did not feel like they needed to comply with the Americans with Disabilities Act (ADA). [99]
Before TNCs in DC
[edit | edit source]In the past, disabled persons in the Washington, DC metropolitan region were mainly constrained by WMATA services (MetroRail, MetroBus, and MetroAccess) or local public transit (Fairfax Connecter, DASH, CUE, etc.) along with the limited service times. With regards to the regular public transportation options, if an individual did not live near the current fixed route, there was no way for them to utilize these options. MetroAccess was able to complement this system by allowing those who live within .75 miles of a fixed-service operated by WMATA to have door-to-door service. [100] Still those outside of the service-region are unable to receive ample transportation service without using a taxicab company. Leaving most disabled persons with a large bill for transportation.
TransportDC
[edit | edit source]In order to compensate for the limitations by public transit services, the District of Columbia Department of For-Hire Vehicles in cooperation with Capital Cab and Yellow Cab, created the TransportDC program. [101] This program allows for MetroAccess users to use taxicab services for a fee of only $5 one-way. The major benefit of the TransportDC program is that it allows for MetroAccess users to request transport without 24 hour notice and the service is available all hours of the day. [102] Due to the increase in popularity, funding for TransportDC began to run out in the 2016 fiscal year. [103] [104] In order to reduce the chance for future funding issues, new restrictions were put on the Transport DC program:
“As of October 1, 2016 Transport DC offers customers transportation to and from any location in the District with no restrictions during the first half of the month ending on the 15th of the month. For the second half of the month, booking requests would be granted solely based on availability and rides would be limited to medical and employment destinations.” [105]
These new restrictions once again make it hard for people with disabilities to get around the city.
The Uber Innovation
[edit | edit source]With options continuing to dwindle for disabled persons, many look to TNCs to fill the void. The problem that arose with this was that Uber drivers were not trained on how to help those who are disabled and some even were not in compliance with the ADA laws. Since the company viewed itself as a technology company, Uber considered itself exempt from having to comply with ADA laws. [106]This changed in 2015 when a federal court case in California ruled that Uber is a public accommodation, therefore subject to the ADA. [107] In order to comply with ADA laws and after much criticism from the public, Uber expressed that they will have trained drivers that understand the ADA and all drivers will accept service dogs as well as collapsible wheelchairs. [108] Uber also now offers users the possibility to ask for wheelchair accessible vehicles. This offer comes in the form of two options, UberWAV and UberTAXI Wheelchair. UberWAV is a program launched in some areas in the country and allows for users will accessibility needs to order a wheelchair accessible vehicle at a cost comparable to the inexpensive UberX rate. [109] UberTAXI is an option where Uber has contracted out UberWAV-like service to a local taxicab company. [110] This is not as cheap as the UberWAV program since the individual is paying the taxi company rate as well as a booking fee charged by Uber.
Issues Still Remain
[edit | edit source]For those in Washington, DC, UberWAV is still not an option since the city is not included in the current program. Therefore, those who would like to request an Uber and require a wheelchair accessible vehicle, need to pay the higher cost through UberTAXI. Not only is this extremely high priced, but wait times have the possibility of exceeding 20 minutes. For those outside of Washington, DC, such as Northern Virginia and Maryland, wheelchair accessible vehicles are not even an option through UberTAXI. Therefore, if you are traveling into Washington, DC, you must rely on the current systems in place. Recently, with WMATA’s SafeTrack program, this has become even more of a problem, as MetroRail service has become unreliable and further affecting people with disabilities.
Lyft
[edit | edit source]Overview
[edit | edit source]The technology of Lyft is considered to be technologically advanced, by offering rides with a push of a button. However, the ability to provide rides to the disabled is not as accessible as rides to the non disabled population. Although federal and state regulations mandate public transportation companies to provide wheelchair accessible vehicles, Lyft, as a company, does not own their cars, so they are able to bypass these laws and regulations.
Wheelchairs
[edit | edit source]The ride share phone application, Lyft, states they provide rides in minutes, wherever you’re headed. [111] However, what about providing rides to people with disabilities? Are they offered rides in minutes, or can their ride become more complicated and time consuming? Looking at Lyft’s current internal disability policies will help determine if all people with disabilities are able to be serviced. The first disability policy mentioned on Lyft’s website regards wheelchairs, and the steps a Lyft driver must take when picking up a person in a wheelchair. Directly from the Lyft website’s anti-discrimination section, the following procedure must be executed: “It is Lyft’s policy that passengers who use wheelchairs (that can safely and securely fit in the car’s trunk or backseat without obstructing the driver’s view) should be reasonably accommodated by drivers on the Lyft platform. You, as a driver, should make every reasonable effort to transport the passenger and their wheelchair.” [112] The section continues to state that a driver who refuses to transport passengers with lightweight wheelchairs, are at risk for being removed from the company. The words “reasonable effort” can be very subjective. Termination from the company is noted above if reasonable effort is not put forth, but there is no clear cut definition of what reasonable effort entails. What if a Lyft driver encounters a customer with a wheelchair that cannot fit properly in the trunk, or the customer is bound to an electric wheelchair?
Referring again, to the Lyft website regarding the policy for passengers with large wheelchairs that cannot be loaded securely in the car, the driver must make a reasonable effort, and if the passenger cannot be accommodated, the driver must cancel the trip, and call a number in which a Lyft customer service agent will reach out to the passenger with transportation resources in their area. [113] The accessible resources in the Metropolitan area include: in Maryland, contacts in the Baltimore area: MTA Paratransit Program, and Action Taxi. In the District: Metro Access, Washington Flyer, and Yellow Cab Company. In Virginia, contacts in Virginia Beach that include: to register with the ADA, to schedule HRT, and Black and White Cabs. [114] If a customer in a wheelchair cannot be accommodated by Lyft and the trip has to be cancelled, after the Lyft representative reaches out to the customer with other options, the customer is responsible for contacting these alternative transportation services on their own.
Non Discrimination
[edit | edit source]The Americans with Disabilities Act, ADA, was signed into effect in 1990, to ensure anybody with a disability will not be discriminated against, and have the same opportunities as those without disabilities. [115] With the introduction of the ADA all people, including disabled persons, are legally required to be treated equally.
In an article published by Fortune regarding the discrimination Lyft and Uber shows disabled people, an allegation claims that Uber and Lyft are being sued by disabled people. One woman in the article claims a Lyft driver left her on the curb, because her wheelchair wouldn’t fit in the car, and the driver did not provide her alternate transportation. [116] This as noted above, is violation of the Lyft policy regarding wheelchairs. The Lyft driver who responded to this client did not have a vehicle outfitted for wheelchair use.
Service Animals
[edit | edit source]What about customers with service animals/guide dogs? Unlike certain wheelchairs, guide dogs/service animals cannot be folded and placed in the trunk of a car. The policy from the Lyft website states that a driver must comply with local, federal and state laws regarding service animals. Additionally, denying a ride due to the service animal will result in the suspension from Lyft. [117] The Lyft policy continues to state that if a driver picks up a person with a service animal, and current client(s) in the car feel uncomfortable, or are allergic to animals, they must cancel their trip and request another Lyft driver. [118]
“According to the ADA, a service animal is defined as a dog to perform work or tasks for individual people." [119] The ADA also states the following, ”Allergies and fear of dogs are not valid reasons for denying access or refusing service to people using service animals.” [120] When using Lyft, a "pool" can be requested to minimize costs, and share the car with other passengers who are heading in the same direction. If a Lyft driver encounters a client with a service animal, and a current client in the car is allergic or has a fear of animals, the Lyft driver must cancel the trip for the client with the service animal. This is not in violation of the ADA if the Lyft driver requests another Lyft car to pick up the passenger with the service animal. Other than a "pool" situation, the Lyft driver would normally not have customers already in the car when picking up customers.
Looking to the Future
[edit | edit source]In an article written by Roland Renzik, with Smart Chair, a wheelchair company for children, Roland points out the fact that Uber and Lyft are taking steps to assist those in wheelchairs by offering handicapped accessible vehicles. [121] The article continues to state that clients who need wheelchair accessible vehicles, are urged to call Lyft 24 hours in advance. Furthermore, the article outlines cities where wheelchair accessible rides are possible. In Virginia, the only city where this service is offered is Virginia Beach. Wheelchair accessible vehicles are offered in the District of Columbia, and Baltimore, Maryland. Although these cities are limited, Lyft is taking strides to offer more handicapped accessible vehicles.
Continuing Issues
[edit | edit source]Although transportation for the disabled seems to be getting more recognition, not all Lyft cars are outfitted to accommodate persons in wheelchairs. People who are not in wheelchairs do not need to make arrangements with Lyft 24 hours in advance, and many people in wheelchairs feel this is unfair and unjust. Outfitting more Lyft vehicles with handicapped and wheelchair accessibility, will enable more disabled people to be offered services at just the push of a button.
Discussion Questions
[edit | edit source]- When you have used Taxi, Uber, or Lyft, have you ever been in a handicap accessible vehicle?
- When you have used Taxi, Uber, or Lyft, have you stopped to pick up another rider that is disabled?
- Have you ever not used Taxi, Uber, or Lyft based on the fact that you have been with a disabled person?
- Have you ever seen a person not able to use Taxi, Uber, or Lyft, due to a disability?
- Do you believe that TNCs (Uber & Lyft) would be able to have their own fleet of WAVs without employing local Taxi companies?
- With Taxi companies losing market share to TNCs, how will those who are disabled be able to get to the places they need to go without the use of Taxis?
References
[edit | edit source]- ↑ Jump up↑ Santens, Scott. "Self-Driving Trucks Are Going to Hit Us Like a Human-Driven Truck." Medium, May 14, 2015 https://medium.com/basic-income/self-driving-trucks-are-going-to-hit-us-like-a-human-driven-truck-b8507d9c5961#.3t9voqysf.
- ↑ http://www.nhtsa.gov/About
- ↑ https://www.fhwa.dot.gov/
- ↑ https://www.transportation.gov/about
- ↑ https://www.fmcsa.dot.gov/mission/about-us
- ↑ http://www.aamva.org/about-aamva/
- ↑ https://www.ftc.gov/policy/policy-actions/advocacy-filings/2014/10/federal-trade-commission-comment-national-highway
- ↑ http://www.ntsb.gov/about/Pages/default.aspx
- ↑ https://www.dmv.virginia.gov/about/#about_dmv.asp
- ↑ http://peloton-tech.com/
- ↑ https://www.daimler-trucksnorthamerica.com/
- ↑ https://teamster.org/
- ↑ https://teamster.org/divisions/freight
- ↑ http://www.trucking.org/About.aspx
- ↑ http://www.ptdi.org/
- ↑ The History of Semi-Trailer Trucks. Great Western Transportation. http://www.gwtrans.com/the-history-of-semi-trailer-trucks/ (Retrieved October 16, 2016)
- ↑ Ibid
- ↑ Ibid
- ↑ Ibid
- ↑ 1. Jump up ↑ Freightliner. "Freightliner Trucks: 70 Years of Innovation." Accessed October 16, 2016. https://freightliner.com/Timeline/#the_1940s
- ↑ Ibid 1950's
- ↑ Ibid 1950s
- ↑ Ibid 1960s
- ↑ Frasier Sr, Van L. 1974. "Air Ride Suspension For Trucks". United States. https://docs.google.com/viewer?url=patentimages.storage.googleapis.com/pdfs/US3784221.pdf. Accessed October 16, 2016
- ↑ United States Congress. Surface Transportation Act of 1982. Washington D.C.: https://www.congress.gov/bill/97th-congress/house-bill/7360 (Accessed October, 16 2016)
- ↑ Murphy Rebecca. Rio Tinto improves productivity through the world's largest fleet of owned and operated autonomous trucks. http://www.riotinto.com/media/media-releases-237_10603.aspx (Accessed October 16, 2016)
- ↑ Giroux, David. Freightliner Inspiration Truck Receives Autonomous Vehicle Licensing from Nevada DMV. https://www.daimler-trucksnorthamerica.com/influence/press-releases/#tfreightliner-inspiration-truck-receives-autonomous-vehicle-2015-05-05. (Accessed October 16, 2016)
- ↑ Ibid
- ↑ Ohnsman, Alan. This Bud's For The Robot: Otto, Anheuser-Busch Claim First Automated Truck Shipment. http://www.forbes.com/sites/alanohnsman/2016/10/25/this-buds-for-the-robot-otto-anheuser-busch-claim-first-automated-truck-shipment/#6aa2978065de. (Accessed October 16, 2016)
- ↑ Harding, J., Powell, G., R., Yoon, R., Fikentscher, J., Doyle, C., Sade, D., Lukuc, M., Simons, J., & Wang, J. (2014, August). Vehicle-to-vehicle communications: Readiness of V2V technology for application. (Report No. DOT HS 812 014). Washington, DC: National Highway Traf c Safety Administration.
- ↑ Ibid.
- ↑ Ibid.
- ↑ Ibid.
- ↑ Bob Tita, and Mike Ramsey, "Truckers Gain Automated Assist", (August 2015). Wall Street Journal. Accused on November 1, 2016 at http://www.wsj.com/articles/truckers-gain-an-automated-assist-1438939801.
- ↑ Thomopoulos, N., & Givoni, M. (2015). The autonomous car--a blessing or a curse for the future of low carbon mobility? an exploration of likely vs. desirable outcomes. European Journal of Futures Research, 3(1), 1-14. doi:http://dx.doi.org/10.1007/s40309-015-0071-z.
- ↑ Carbon War Room, "Unlocking Fuel Saving Technologies on Trucking and Fleets", (November 2012). Accessed on November 1, 2016 athttps://carbonwarroom.com/what-we-do/research-publications.
- ↑ Thomopoulos, N., & Givoni, M. (2015). The autonomous car--a blessing or a curse for the future of low carbon mobility? an exploration of likely vs. desirable outcomes. European Journal of Futures Research, 3(1), 1-14. doi:http://dx.doi.org/10.1007/s40309-015-0071-z.
- ↑ Anita Kim, David Perlman, Dan Bogard and Ryan Harrington, "Review of Federal Motor Vehicle Safety Standards (FMVSS) for Automated Vehicles", Department of Transportation. (March 2015). Accessed on November 15, 2016 at http://ntl.bts.gov/lib/57000/57000/57076/Review_FMVSS_AV_Scan.pdf.
- ↑ Leonard, K. M., Smith, Egan, PE,P.T.O.E., P.T.P., & Gay, K. (2016). Developing the workforce for a connected vehicle future: USDOT's intelligent transportation systems training opportunities for today and tomorrow. Institute of Transportation Engineers.ITE Journal, 86(6), 39-42. Retrieved from http://search.proquest.com/docview/1820988849
- ↑ American Association for Motor Vehicle Administrators, "Commercial Driver's License Manual", (May 2015).
- ↑ Anita Kim, David Perlman, Dan Bogard and Ryan Harrington, "Review of Federal Motor Vehicle Safety Standards (FMVSS) for Automated Vehicles", Department of Transportation. (March 2015). Accessed on November 15, 2016 at http://ntl.bts.gov/lib/57000/57000/57076/Review_FMVSS_AV_Scan.pdf.
- ↑ Automated Vehicles Policy. (September 2016). Department of Transportation and NHTSA. Accessed on November 16, 2016 at https://www.transportation.gov/sites/dot.gov/files/docs/AV%20policy%20guidance%20PDF.pdf.
- ↑ Ibid.
- ↑ Ibid.
- ↑ Ibid.
- ↑ Pedro M. d'Orey, Amin Hosseini, José Azevedo, Frank Diermeyer, Michel Ferreira, Markus Lienkamp, "Hail-a-Drone: Enabling teleoperated taxi fleets", Intelligent Vehicles Symposium (IV) 2016 IEEE, pp. 774-781, 2016.
- ↑ Noor, A. K., & Beiker, S. A. (2012). Intelligent and connected. Mechanical Engineering, 134(11), 32-37. Retrieved from http://search.proquest.com/docview/1146500355
- ↑ Lutin, Jerome M, PHD,P.E., A.I.C.P., Kornhauser, A. L., P.H.D., & Lerner-Lam, E. (2013). The revolutionary development of self-driving vehicles and implications for the transportation engineering profession. Institute of Transportation Engineers.ITE Journal, 83(7), 28-32. Retrieved from http://search.proquest.com/docview/1417586906
- ↑ Ibid.
- ↑ Ibid.
- ↑ Ibid.
- ↑ Ibid.
- ↑ Ibid.
- ↑ James Manyika, Michael Chui, Jaques Bughin, Richard Dobbs, Peter Bisson and Alex Marrs. "Disruptive technologies: Advances that will transform life, business and the global economy",(May 2013). Accessed on November 16, 2016 at http://www.mckinsey.com/business-functions/digital-mckinsey/our-insights/disruptive-technologies
- ↑ Ibid.
- ↑ District of Columbia Taxicab Commission Disability Advisory Committee, February 20, 2014, accessed 31 Oct, 2016 at: http://dfhv.dc.gov/sites/default/files/dc/sites/dc%20taxi/page_content/attachments/DC%20Taxicab%20Comission%20Disability%20Advisory%20Committee%20Comprehensive%20Report%20022014%20FINAL%20w%20Addendum.pdf"
- ↑ United States Access Board, 2016, accessed on 1 Nov, 2016 at: https://www.access-board.gov/
- ↑ Yellow Cab Company of DC, 2016, accessed on 1 Nov, 2016 at: http://dcyellowcab.com/about-us/
- ↑ Taxi Transportation Service, 2016, accessed on 1 Nov, 2016 at: http://dctaxionline.com/
- ↑ Arlington Blue Top Cabs, 2016, accessed on 1 Nov, 2016 at: https://www.bluetop.com/about-blue-top/
- ↑ Friendly Cab of Arlington, 2016, accessed on 1 Nov, 2016 at: http://www.arlingtonfriendlycab.com
- ↑ Red Top Cab of Arlington, 2015, accessed on 1 Nov, 2016 at: http://www.redtopcab.com/
- ↑ City of Alexandria, DOT Paratransit Program, Oct 20, 2015, accessed on 1 Nov, 2016 at: https://www.alexandriava.gov/tes/info/default.aspx?id=6538
- ↑ Arlington County Transit, STAR, 2016, accessed on 1 Nov, 2016 at: http://www.arlingtontransit.com/pages/star/
- ↑ Di Caro, Martin. “Transport DC is Back – With Tweaks TO Test Paratransit’s Financial Viability.” WAMU 88.5: American University Radio (October 3, 2016). https://wamu.org/news/16/10/03/on_demand_taxi_service_for_people_with_disabilities_is_back_as_long_as_funding_holds_up
- ↑ “Transport DC.” DC.gov: Department of For-Hire Vehicles. Last modified October 1, 2016. http://dfhv.dc.gov/page/transport-dc
- ↑ “MetroAccess Frequently Asked Questions.” Washington Metro Area Transit Authority. Accessed October 13, 2016. http://www.wmata.com/accessibility/faq.cfm
- ↑ Congress, Library of. n.d. The Civil Rights Act of 1964: A Long Struggle for Freedom. Accessed October 2016. https://www.loc.gov/exhibits/civil-rights-act/civil-rights-act-of-1964.html.
- ↑ ADA.gov. n.d. Information and Technical Assistance on the Americans with Disabilities Act . Accessed October 2016. https://www.ada.gov/ada_intro.htm.
- ↑ Johnson, Charles. “Timeline: History of Uber.” Chicago Tribune (March 11, 2015). http://www.chicagotribune.com/bluesky/technology/chi-timeline-ubers-controversial-rise-20150205-htmlstory.html
- ↑ Eldon, Eric. “How Uber Is Launching In Its Newest City, Washington, DC.” TechCrunch (December 15, 2011). https://techcrunch.com/2011/12/15/uberdc/
- ↑ Johnson, “Timeline: History of Uber”
- ↑ Crunch, The. 2012. With A San Francisco Launch Imminent, Lyft is Doubling Its Fleet of Drivers And Readying An Android App. August 25. Accessed October 2016. https://techcrunch.com/2012/08/25/lyft-san-francisco-launch/.
- ↑ Mikaela. “Wheelchair Accessible Rides with uberWAV.” Uber Newsroom (August 7, 2014). https://newsroom.uber.com/us-new-york/wheelchair-accessible-rides-with-uberwav/
- ↑ Jake. “Your Wheelchair-Accessible Vehicle Has Arrived.” Uber Newsroom (September 22, 2014). https://newsroom.uber.com/us-pennsylvania/your-wheelchair-accessible-vehicle-has-arrived/
- ↑ Aratani, Lori. 2014. D.C. Council okays bill to legalize Lyft, Sidecar, uber-X type services in the District. October 28. Accessed November 2016. https://www.washingtonpost.com/news/dr-gridlock/wp/2014/10/28/d-c-council-okays-bill-to-legalize-lyft-sidecar-uberx-type-services-in-the-district/.
- ↑ “Statement of Interest of the United States of America: National Federation of the Blind of California, Michael Kelly, Michael Hingson, and Michael Pederson v. Uber Technologies, Inc., Rasier, LLC, and Rasier-CA, LLC.” United States District Court for the Northern District of California – San Francisco Division (February 5, 2015). https://www.ada.gov/briefs/uber_soi.pdf
- ↑ Lazo, Luz. 2015. Uber and Lyft are now legal in Virginia. February 15. Accessed October 2016. https://www.washingtonpost.com/news/dr-gridlock/wp/2015/02/18/uber-and-lyft-are-now-legal-in-virginia/.
- ↑ Joshi, Meera, and Allan Fromberg. 2014. "TLC Approves Lyft's Purchase of Black Car Base Atlas Travel & Limousine, Inc." Taxi & Limousine Commission. July 25. Accessed November 2016. http://www.nyc.gov/html/tlc/downloads/pdf/industry_notice_14_32.pdf.
- ↑ Ann, “Wheelchair Accessible Taxis”
- ↑ “SafeTrack.” Washington Metro Area Transit Authority. Accessed October 13, 2016. http://www.wmata.com/rail/safetrack.cfm
- ↑ Di Caro, “Transport DC is Back”
- ↑ Di Caro, “Transport DC is Back”
- ↑ Nondiscrimination On the Basis of Disability by Public Accommodations and in Commercial Facilities, 28 U.S.C. §36.201 (2016).
- ↑ Office, GPO U.S. Government Publishing. 2016. Electronic Code of Federal Regulation. November 7. Accessed November 2016. http://www.ecfr.gov/cgi-bin/text-idx?c=ecfr&SID=d315855e2f2c9f940970f4c191349c12&rgn=div5&view=text&node=49:1.0.1.1.27&idno=49#se49.1.37_15.
- ↑ ”Statement of Interest”
- ↑ Office, U.S. Government Publishing. n.d. Electronic Code of Federal Regulation. Accessed November 2016. http://www.ecfr.gov/cgi-bin/text-idx?c=ecfr&SID=d315855e2f2c9f940970f4c191349c12&rgn=div5&view=text&node=49:1.0.1.1.27&idno=49#_top.
- ↑ Lazo, Luz. “New Regulations for Uber and Lyft open the door for expansion.” Washington Post (February 21, 2015). https://www.washingtonpost.com/local/trafficandcommuting/new-regulations-for-uber-and-lyft-open-the-door-for-expansion/2015/02/21/8445149a-b83e-11e4-a200-c008a01a6692_story.html
- ↑ “Taxicab Regulation.” Arlingtonva.us:Transportation. Accessed October 15, 2016. https://transportation.arlingtonva.us/taxis/
- ↑ Capozzi, David M, Executive Director, U.S. Access Board, Testimony to U.S. Senate Committee on Health, Education, Labor and Pensions, The Americans with Disabilities Act and Accessible Transportation: Challenges and Opportunities, November 17, 2011
- ↑ DC.gov, Office of Human Rights, Washington D.C., 2016, found at: http://ohr.dc.gov/taxis/request
- ↑ District of Columbia Taxicab Commission Accessibility Advisory Committee, Annual Report on Accessible For-Hire Vehicle Service, October 1, 2014, accessed on 1 Nov, 2016 at: http://odr.dc.gov/sites/default/files/dc/sites/odr/page_content/attachments/DCTC%20Accessibility%20Advisory%20Committee%202014%20Annual%20Report%20100114%20FINAL.pdf
- ↑ DC.gov, Office of Human Rights, Washington D.C., 2016, accessed October 2016 at: http://ohr.dc.gov/taxis/request
- ↑ Arlington County Government, Aging and Disability, 2016, accessed October 2016 at: https://aging-disability.arlingtonva.us/resources/transportation/
- ↑ Arlington Transit, Specialized Transit for Arlington Residents (STAR), 2016, accessed October, 2016 at: http://www.arlingtontransit.com/pages/star/
- ↑ DC.gov, Office of Human Rights, Washington D.C., 2016, accessed October, 2016 at: http://ohr.dc.gov/service/file-discrimination-complaint
- ↑ City of Alexandria and Arlington Office of Human Rights, 2016, accessed Oct, 2016 at: https://topics.arlingtonva.us/human-rights/complaints/ada-grievance-form/ and https://apps.alexandriava.gov/IntakeQuestionnaire/Default.aspx
- ↑ Murphy, David. "Uber Tries to Wriggle Out of ADA Lawsuits." PCmag.Com (May 22, 2015).
- ↑ Murphy, “Uber Tries to Wriggle”
- ↑ “MetroAccess Frequently Asked Questions”
- ↑ ”Transport DC” DC.gov: Department of For-Hire Vehicles
- ↑ Di Caro, “Transport DC is Back”
- ↑ Di Caro, “Transport DC is Back”
- ↑ Lazo, Luz. “Transport DC became so popular that the city is now downsizing it.” Washington Post (July 21, 2016). https://www.washingtonpost.com/news/dr-gridlock/wp/2016/07/21/transport-dc-a-deal-that-turned-out-to-be-too-good-for-its-own-good/
- ↑ ”Transport DC” DC.gov: Department of For-Hire Vehicles
- ↑ Murphy, “Uber Tries to Wriggle”
- ↑ ”Statement of Interest”
- ↑ Zara. “Serving our users with Accessibility Needs.” Uber Newsroom. (July 9, 2015). https://newsroom.uber.com/serving-our-users/
- ↑ Jake, “Your Wheelchair Accessible Vehicle”
- ↑ Ann, “Wheelchair Accessible Taxis”
- ↑ —. 2016. Lyft.com. Accessed October 2016. https://www.lyft.com/
- ↑ —. 2016. Help Center. Accessed October 2016. https://help.lyft.com/hc/en-us/articles/214218527-Wheelchair-Policy#!
- ↑ —. 2016. Help Center. Accessed October 2016. https://help.lyft.com/hc/en-us/articles/214218527-Wheelchair-Policy#!
- ↑ Lyft, Inc. 206. Accessible Vehicle Dispatch. Accessed October 2016. https://help.lyft.com/hc/en-us/articles/213584508.
- ↑ ADA.gov. n.d. Information and Technical Assistance on the Americans with Disabilities Act . Accessed October 2016. https://www.ada.gov/ada_intro.htm.
- ↑ Wieczner, Jen. 2015. Why the disabled are suing Uber and Lyft. May 22. Accessed October 2016. http://fortune.com/2015/05/22/uber-lyft-disabled/.
- ↑ —. 2016. Anti-Discrimination Policies. Accessed October 2016. https://help.lyft.com/hc/en-us/articles/214218517.
- ↑ —. 2016. Anti-Discrimination Policies. Accessed October 2016. https://help.lyft.com/hc/en-us/articles/214218517.
- ↑ Justice, US Department of. 2011. "Service Animals." www.ada.gov. July 12. Accessed October 2016. https://www.ada.gov/service_animals_2010.htm.
- ↑ Justice, US Department of. 2011. "Service Animals." www.ada.gov. July 12. Accessed October 2016. https://www.ada.gov/service_animals_2010.htm.
- ↑ Reznik, Roland. 2015. Accessible Transportation with Uber and Lyft for Wheelchair Users. June 27. Accessed October 2016. http://kdsmartchair.com/blogs/news/43644419-accessible-transportation-with-uber-and-lyft-for-wheelchair-users.
Additional Readings
[edit | edit source]1. Vock, Daniel C., September 2, 2015, Governing the States and Localities, Disabled in DC: How Taxis and Uber Might Be Worsening the Paratransit Problem. Found here
2. District of Columbia Taxicab Commission Accessibility Advisory Committee, Annual Report on Accessible Vehicle for Hire Service, September 30, 2015. Found here
3. Accessible Transportation Options, Washington Metropolitan Area Transit. 2011. WMATA.COM. July. Accessed October 2016. Found here
4. Virginia, Fairfax County. 2016. Transportation Guide to Northern Virginia for People with Disabilities . Accessed October 2016. Found here
5. Government, Arlington County. n.d. Aging and Disability. Accessed October 2016. Found here
Commercial Space Flight
Summary
[edit | edit source]Commercial spaceflight is the movement of cargo, satellites, scientific payloads, and passengers beginning in Low-Earth Orbit (LEO) 62 miles above the earth’s sea level by way of privately owned spacecraft and rockets. Commercial is defined as operations run by the private sector with vehicles, spacecraft, or services they own.[1] The industry functions as a public-private partnership whereby commercially operated companies design and produce the transport vehicles NASA charters for their space missions. These companies are also able to pursue their own non-governmental commercial interests such as space tourism. Commercial spaceflight is opening up new opportunities for space exploration, scientific discovery, and commercial enterprise. With these opportunities comes a host of policy developments and issues that have national and international impacts.
Annotated List of Actors
[edit | edit source]National Aeronautics and Space Administration (NASA)
[edit | edit source]NASA’s Commercial Crew Program (CCP) facilitates strong public-private partnerships with the private space industry to encourage innovation for development of the commercial space transportation program, which is carried out by using spacecraft that is owned and operated by private companies or organizations for profit. [2]
Federal Aviation Administration (FAA)
[edit | edit source]FAA’s Office of Commercial Space Transportation (AST) was formed in 1995 and is responsible to oversee, authorize and regulate both commercial launches and reentry activities to ensure protection of the public, property, national security and foreign policy interests of the U.S., and encourages, facilitates and promotes commercial space transportation. [3]
American Commercial Space Industry
[edit | edit source]Private American companies that are designing and developing transportation capabilities to and from low-earth orbit and the International Space Station (ISS) to be selected by NASA’s CCP Program. NASA has selected Boeing and SpaceX to build and operate systems to transport astronauts to and from the International Space Station, and Sierra Nevada Corporation’s spacecraft to ferry equipment and cargo to the Space Station. Additionally, SpaceX and Orbital ATK received contracts with NASA to transport cargo to the ISS. Other private companies are developing spacecraft to compete for the emerging market of commercial passenger flight to low-earth orbit for tourism to include Virgin Galactic and Blue Origin.[4]
U.S. Space Subcommittee
[edit | edit source]U.S. House of Representatives Subcommittee on Space has legislative jurisdiction, general oversight and investigative authority on all matters relating to space research and development, including commercial space activity.[5]
Department of Commerce
[edit | edit source]Office of Space Commerce is responsible for space transportation commerce policy activities and its mission to foster the conditions for the economic growth and technological advancement of the U.S. commercial space industry.[6]
Commercial Space Transportation Advisory Committee (COMSTAC)
[edit | edit source]Advisory committee composed of industry, government, academia, and advocacy that provides information, advice and recommendations to the FAA on matters concerning the U.S. commercial space transportation industry.[7]
Commercial Spaceflight Federation (CSF)
[edit | edit source]American aerospace industry committee, whose mission is to promote the development of commercial human spaceflight, pursue higher levels of safety and share best practices and expertise throughout the industry.[8]
Timeline of Events
[edit | edit source]1962 - Communications Satellite Act
Provided expanded telecommunications service and established a commercial communications satellite system responsive to public needs and national objectives. United States participation would take the form of a private corporations subject to government regulation.[9]
1967 - United Nations “Five Space Treaties” developed under the United Nations Office for Outer Space (UNOOSA)
- Outer Space Treaty (1967)
- The Rescue Agreement (1968)
- The Liability Convention (1972)
- The Registration Convention (1976)
- The Moon Agreement (1984) [10]
Outer Space Treaty (1967), most important of the five and the second of the so-called "non-armament" treaties; it sought to prevent “a new form of colonial competition” and the possible damage that self-seeking exploitation might cause. This article restricts activities in two ways:
First, it contains an undertaking not to place in orbit around the Earth, install on the moon or any other celestial body, or otherwise station in outer space, nuclear or any other weapons of mass destruction.
Second, it limits the use of the moon and other celestial bodies exclusively to peaceful purposes and expressly prohibits their use for establishing military bases, installation, or fortifications; testing weapons of any kind; or conducting military maneuvers.[11]
The five space treaties, enabled space programs to follow an internationally agreed upon set of standards, and fostered cooperative engagement that ultimately led to nations allowing private commercial organizations to take over some of the functions of space programs. Without early engagement by governmental organizations like UNOOSA, organizations like the Commercial Spaceflight Federation (CSF) would not be possible today.[12]
1984 - Commercial Space Flight Act
Law that regulates and promotes the private spaceflight industry in the US. The law is responsible for issuing launch licenses to private companies and U.S. citizens.[13]
1990 - National Aeronautics and Space Administration Multiyear Authorization Act
Title I: National Aeronautics and Space Administration Authorizations:
- Established within Department of Commerce an Office of Space Commerce to coordinate space-related issues, programs, and initiatives and authorized appropriations.
- Amended the Commercial Space Launch Act to authorize appropriations to carry out the Act.
- Commerce Secretary responsible for facilitating private sector involvement in commercial space transportation activity, and promoting public-private partnerships.[14]
Title II: Launch Services Purchase Act of 1990:
- Requires NASA to purchase launch services for its primary payloads from commercial providers.
- Allows launch vehicles to be acquired or owned by NASA, except for historical displays, only as required by such exceptions or for conducting research, development, and testing of launch technology.
- Requires contracts to provide launch services to NASA to be awarded on the basis of full, fair, and open competition.
- Requires NASA to limit its requirements for submission of cost or pricing data in support of a bid or proposal.
- Requires performance specifications, not detailed Government design or construction specifications, to be used.[15]
1998 - Commercial Space Act
Requires the federal government to procure commercial space transportation services from US companies to promote commercial space opportunities for the private sector. The Act implemented many of the provisions of the Launch Services Purchases Act of 1990 eight years earlier. [16]
2004 - Commercial Space Launch Amendments Act
Allowed for more private investment to develop commercial launch vehicles capable of carrying humans into space.[17] The Act gave the Federal Aviation Administration (FAA) authority to regulate human space flight. It also established the regulatory framework, and passenger protocol rules for carrying passengers into space.[18]
2004 - SpaceShipOne
First non-governmental manned spacecraft that reached low-Earth orbit. The spacecraft successfully completed two more flights the same year leading to the first privately developed reusable spacecraft.[19]
2010 - National Space Policy of the United States
“In support of its critical domestic aerospace industry, the U.S. government will use commercial space products and services in fulfilling governmental needs, invest in new and advanced technologies and concepts, and use a broad array of partnerships with industry to promote innovation. The U.S. government will actively promote the purchase and use of U.S. commercial space goods and services within international cooperative agreements.” [20]
2013 - National Space Transportation Policy
The goal of this policy is for the United States to encourage and facilitate the US commercial space transportation industry by promoting innovation-driven entrepreneurship, and international competitiveness that benefits the US economy. The policy supports human space transportation initiatives to low-Earth orbit to and from the International Space Station, and deep-space exploration. The policy also strengthened the development of US commercial spaceflight for the private human spaceflight market.[21]
2015 - Commercial Space Launch Competitiveness Act of 2015
Extends the “learning period” regulation to 2023 so the FAA cannot enact any safety regulation for commercial human spaceflight, and extends indemnification (Space Launch Liability) to 2025 for US launch providers for failed launches resulting in third-party loss.[22]
Narrative of the Case
[edit | edit source]What compelled lawmakers to support commercial space transport?
Commercial space flight was predicated on the belief that NASA should not have a monopoly on space flight when private industry had so much to offer in terms of talent, resources, and innovative ways to meet a growing demand for information and services in the digital age. Government had retained a monopoly on space flight in the U.S. until President Reagan signed the Commercial Space Launch Act in 1984. Commercial satellite launches had been prohibited prior to this, but even with the Act’s passage commercial launches proved difficult due to regulation and burdensome processes. The space shuttle Challenger disaster just two years later forced NASA and the federal government to suspend shuttle flights, and reevaluate the viability of allowing commercial spaceflight to provide these types of services. The passage of the Launch Services Purchase Act as part of the National Aeronautics and Space Administration Multiyear Authorization Act of 1990 effectively ended NASA’s monopoly. For the first time it required NASA to purchase launch services for its primary payloads from commercial providers with minimal exceptions. It also required NASA to give required specifications for what it needed accomplished, and not direct specific construction requirements or designs, thus enabling commercial invention and innovation to find the best solution to the problem.
NASA’s Dependence on Russia
After the US retired the Space Shuttle Program in 2004, Russia has been shuttling American astronauts to the ISS in the interim as Boeing and SpaceX develop a shuttle through their Commercial Crew Program (CCP) to transport astronauts to the ISS. The target date was set for 2015 for NASA to begin an independent shuttle service but between 2011-2015, Congress cut $1 billion from the CCP. The launch date was subsequently pushed back to 2017. [23] As a result, NASA was forced to renew their contract with Russia. In 2015, NASA Administrator Charles Bolden wrote a letter to Congress informing members of the renewal.
“I am writing to inform you that NASA, once again, has modified its current contract with the Russian government to meet America’s requirements for crew transportation services. Under this contract modification, the cost of these services to the U.S. taxpayers will be approximately $490 million. I am asking that we put past disagreements behind us and focus our collective efforts on support for American industry - the Boeing Corporation and SpaceX - to complete construction and certification of their crew vehicles so that we can begin launching our crews from the Space Coast of Florida in 2017.” [24]
The United States’ reliance on a foreign nation and former rival to execute its space mission has given urgency to commercial space transportation development efforts. A handful of companies have emerged as early leaders in this arena and are leading the way in research and development. Their activity has centered around resupply services and space tourism, two areas that carry significant potential both for government and private interests.
Commercial Space Industry Advancement
Since 2005, $10 billion in private capital has been invested in space related industries.[25] In 2015 alone, $1.8 billion was invested in commercial spaceflight companies by venture capitalists. This sum represented more investment in spaceflight companies than the previous 15 years combined.[26] It demonstrates a willingness on the part of investors to commit to commercial spaceflight in ways they had never considered previously, and it also shows that investors believe the rewards far outweigh the risks for commercial spaceflight. With so many different companies in the market, and the competition so vigorous, the level of progress moves forward at leaps and bounds. Each success or failure paves the way to build upon shared experience within the industry. SpaceX and Orbital ATK are two such companies that have developed and launched the first commercial spacecraft carrying resupply cargo to the ISS. SpaceX also provides services to launch satellites for commercial communications companies worldwide. Blue Origin is currently developing spacecraft for orbital human space flight that will carry astronauts to the ISS. These companies are currently developing and testing spacecraft that will provide commercial travel vehicles for passengers. These trips would begin in low-earth orbit and progress to Mid-Earth Orbit (MEO) and orbital flights, again building on lessons learned. The long term goal for both companies is outer space flights with trips to the moon and Mars, with the potential to establish long-term colonies on both.
Commercial Resupply Services (CRS)
In 2004, NASA announced it would end its Space Shuttle Program in 2011 and retire its three active space shuttles (Discovery, Atlantis, and Endeavor) that routinely resupplied the International Space Station (ISS). NASA ended the program to allocate additional resources to technology development, scientific research, and exploration missions beyond low-earth orbit to places like Mars. Following the announcement, NASA launched The Commercial Orbital Transportation Services (COTS) program that would allow private companies to take over operations in LEO, and conduct resupply missions to the ISS. The public to private transition began 2008 when SpaceX and Orbital ATK won commercial resupply contracts that provide cargo launch services to the ISS.[27]
In 2012, the free-flying spacecraft Dragon designed and built by SpaceX became the first commercial spacecraft to deliver cargo to the ISS.[28] In September 2013, Orbital ATK spacecraft Cygnus completed a COTS demonstration mission to the ISS. Directly following this successful demo mission, Cygnus completed its first CRS mission in January 2014.[29]
Space Tourism
The Commercial Space Launch Amendments Act of 2004 allowed the space tourism industry to grow and companies such as Virgin Galactic and Blue Origin are spearheading the space tourism industry. Virgin Galactic's human spaceflight vehicles are the WhiteKnightTwo and SpaceShipTwo, both of which offer civilians a chance to experience the weightlessness of space in low-earth orbit.[30] SpaceX’s Dragon craft was originally designed to carry humans but is only licensed to carry cargo to the ISS. [31] Currently, there are no U.S. commercial companies using their spacecraft for tourism. SpaceX is conducting manned test flights to ensure all spacecraft are safe and licensed by the FAA before they can carry humans into space.
Where are we now?
With NASA's inability to facilitate all the launches needed by both government and private industry, the door has been opened for the rapid expansion of commercial ventures and innovative entrepreneurship. The shift in government policy from one where NASA was the only producer of spacecraft to one where commercial companies provide a multitude of options to NASA as the customer has brought about great change. Now the commercial space transportation industry can bring to bear their considerable innovative solutions and resources to solve complex problems for the government. There are still many policy debates and technical problems to be solved but if government remains flexible when enacting future policy and regulation, the industry will continue to build upon its successes and move the entire space industry forward.
Clear Identification of Policy Issues
[edit | edit source]Policy Issues
The policy issues surrounding commercial spaceflight are a product of it being such a new industry as well the public-private partnership which is molding it. The government and private companies hold distinct interests in exploiting the opportunities a robust commercial space transport sector offers. Questions remain as to extent of the government’s authority over and responsibility to these private companies. Some of the most pressing of these issues are considered below.
When and How to Regulate Space Crew Safety
The CLSA, in order to promote the growth and development of the commercial space industry, prohibited the FAA from regulating crew and spaceflight participant safety until 2012. [32] This prohibition has since been extended to 2023. [33] The prohibition has created ongoing uncertainty as to what role the government should play regarding space crew safety and how to do so. There is disagreement among government and private industry participants as to how long the prohibition should be in place.
A 2015 report by the Government Accountability Office (GAO) found that “six of nine commercial space launch companies...three experts, the Chairman of the Commercial Space Transportation Advisory Committee, and the President of the Commercial Spaceflight Federation all recommended that the regulatory moratorium” on crew and spaceflight participant safety be extended.[34] Chief among their reasons for doing so were to allow space tourism the opportunity it needs to continue developing effectively and to allow the industry to figure out the appropriate standards to insure safety. The FAA, in the same report, said it supported allowing the prohibition to expire but had no plans of issuing any regulations regarding space crew safety upon its expiration.
The agency stated that it would prefer to see the commercial space transport companies develop their own industry standards for safety. However, the FAA argues that with a seemingly indefinite rule barring the government from regulating commercial space crew safety, there is little practical incentive for the companies to do so. Removing the prohibition would allow the agency to develop regulations were a systemic issued identified. Under the current rules, they can create regulations only following an accident and the regulation would be limited to whichever design feature, if any, were identified as the cause of the accident.
In 2013, the FAA released a draft guidelines document titled, “Established Practices for Human Space Flight Occupant Safety.”[35]The document borrowed from NASA’s Commercial Crew Program requirements. Under the NASA program, NASA specifies a set of requirements and standards for occupant safety that the private developers of space launch vehicles must meet in order to be used in NASA missions. One of the challenges of this arrangement is striking the right balance between making the vehicles safe enough for NASA users yet affordable enough that they can be used for other commercial purposes.[36]
FAA Licensing
The FAA is responsible for the licensing of commercial space launches as well as NASA’s Commercial Crew Program launches (NASA certifies the launch vehicles). Given that the commercial space transportation sector is a relatively new industry in its early stages, the agency has had to grapple with obtaining adequate resources and developing the expertise needed to issue licenses effectively. The amount of launches has steadily risen from year to year. According to the GAO, “in fiscal year 2015, the FAA licensed and permitted 14 launches and reentries” compared to only seven nearly ten years earlier.[37]That number could increase substantially once NASA’s Commercial Crew Program becomes operational and companies begin launching small satellites into orbit.
The increase in launches has naturally increased the FAA’s workload by requiring the agency conduct more inspections. The inspections include safety checks for pre-launch and reentry activities as well as launch site operations. They conducted 216 commercial launch inspections in fiscal year 2015 compared to only 27 in fiscal year 2006 and an average of 90 inspections between 2006 and 2015.[38] In addition, the FAA is dealing with licensing new types of space launch vehicles. Systems like the SpaceShipTwo blend features of both aircraft and rocket-powered technology and have flight termination systems that do not require human operation.[39] These new systems require more time, resources, and personnel dedicated to not only inspecting the vehicles but gaining the knowledge necessary to understand how the systems will work in real-life situations and anticipating potential hazards they may present.
As with the space launch vehicles, the FAA is also responsible for licensing an increasing number of launch sites.[40] The complexity of these launch sites have increased from the traditional coastal area federal launch facilities. Commercial companies are submitting applications to launch from their own nonfederal sites. Launches from inland raise the risk of interfering with other air traffic and obstructions. The increase in commercial space launches, reentries, and launch sites will increase the government’s exposure to third-party liability claims and federal indemnification.[41] This increased exposure highlights the need for FAA licensing requirements to be thorough enough to insure the safe operation of commercial space launch operations in all its phases.
Currently, the FAA licenses the launch and reentry of commercial space launch vehicles. It does not license their activity when they are operating “in space.” Article IV of the Outer Space Treaty and Section 108 of the Commercial Space Launch Competitiveness Act (CSLCA) each require the US government to monitor and insure the safety of commercial space activities occurring in space. [42]The agency has yet to release detailed plans as to how it will fulfill this responsibility.
Congestion of airspace and orbital debris
The United States’ National Space Transportation Policy states that the Department of Transportation has “exclusive authority... to address orbital debris mitigation practices for U.S.-licensed commercial launches, to include launch vehicle components such as upper stages, through its licensing procedures.”[43] Orbital debris presents an obvious danger not only to the operation of space launch vehicles and their passengers, but also for inhabitants on Earth following a vehicle’s reentry below low Earth orbit (LEO). Currently, there are few regulations regarding how to mitigate orbital debris. Commercial space launch participants must avoid intentional creation of debris, collision of components of the launch system, and “to passivate the launch vehicle by depleting propellants, pressurant gases, and stored energy in batteries.” [44] There are multiple methods launch companies may consider to passivate the launch vehicle, including passive or augmented passive disposal, controlled deorbit, or using a separate deployer bus.[45]
Besides mitigation, government and commercial space launch companies will need to consider orbital debris remediation. Debris remediation is the prevention of collisions between massive derelict objects. [46] Active debris removal (ADR), the primary means of debris remediation, calls for the removal of orbital debris.[47] According to NASA’s Orbital Debris Program Office, reducing the risk to the current fleet of spacecraft will require the removal of small debris. Long term, however, ADR must focus on large debris such as, “ intact rocket bodies and non-functional satellites.”[48] Collisions of these larger objects present the greatest hazards in the long-term growth of orbital debris and studies show that removing as little as five of the largest objects can stabilize the growth of orbital debris. Government and private companies throughout the world are still in the early stages of developing technology that will reliably detect and prevent the collision of such debris.
As with orbital debris, significant attention has been placed on developing technology to detect the proximity space launch vehicles have to one another and with aircraft below orbit within the United States’ commercial airspace. The Space Data Integrator (SDI) system is the FAA’s primary technology in that effort. It has designed to monitor the movement of commercial space launch vehicles to insure they do not interfere with air traffic, anyone or anything on the ground, or any objects and activities between the ground and space.[49]Specifically, the SDI will “support current and upcoming operational scenarios, including those associated with NASA’s Commercial Crew Program, fly back boosters, inland reentries from orbit, and other complex mission designs.” [50]The specific objectives of this system are to automate situational awareness, monitor launches transiting through the National Airspace System (NAS), and detect and respond to abnormal events. The FAA plans to use the SDI in tandem with some of its other air traffic control systems but there are limitations that the agency is still determining whether to resolve or find ways to work around.
National Security Policy
The U.S. today is more reliant than ever on space programs for U.S. National Security, combined with the international community is playing a larger role in space. Space assets provide capabilities that are critical to U.S. National Security and commercial space assets account for many of these capabilities. Defense-industrial initiatives report states, “U.S. Policy needs to be strengthened to address assured access to space for key commercial payloads.” Commercial satellite launch customers report challenges with obtaining and scheduling launches.[51]
Space capabilities that are key elements of U.S. National Security include satellite capabilities that provide command and control, communications, intelligence gathering and weapons targeting. Space systems are increasingly important for monitoring potential threats, managing military forces and carrying out combat operations. Space is also an essential dimension of the U.S. economy such as stock market data, telecommunications, automated teller machines, and is now an integral part of the daily lives of millions of U.S. residents.[52]
National Security Presidential Directive (NSPD) 40, U.S. Space Transportation Policy recognizes the importance of a healthy commercial space launch industry in supporting U.S. National Security interests. Sustaining U.S. technological superiority in space is a U.S. National Security interest and building and maintaining a strong U.S. industrial base is an important element of developing superiority, which it is stated would be unrealistic while relying primarily on foreign capabilities.[53]
Export Control Policy
The U.S. export control policy ensures control over certain technologies and commodities that are being sold to foreign countries and industry to ensure national security. Export control policy is a licensing program that controls items regulated under the International Traffic in Arms (ITAR) and Export Administration Regulations (EAR). The U.S. Departments of State, Defense, and Trade administer the ITAR program, which controls munitions items listed on the United States Munitions List (USML). EAR regulations control items listed on the Commerce Control List (CCL) which have both commercial and military applications. [54]
Many U.S. organizations report that the control of space related commodities under the ITAR puts U.S. companies at a competitive disadvantage in the international space market. [55] Opposition to the policy are in favor of export control falling under the Export Administration Regulations (EAR) and the President’s 2009 Export Control Policy Reform Initiative. [56] Survey respondents to the 2014 U.S. Department of Commerce’s export control policy survey, estimate lost sales opportunities between approximately $988 million and $2 billion from 2009 to 2012 due to the export control policy.[57]
Commercial space transportation advisory committee finds the licensing process under EARS would be quicker, offer more flexibility to the industry and that ITAR carries a stigma within the international space community. [58] Department of Defense raises a national security concern that the export control program under the EAR regulations could provide technologies and systems that have anti-satellite (ASAT) capability to foreign entities. [59] Critics of the current policy say that more exports would allow U.S. companies to expand markets and increase sales, and with the uncertainty of the U.S. government budget environment organizations may seek additional opportunities to sell the products and services outside of the U.S. to remain profitable and competitive.[60]
Lessons Learned
[edit | edit source]- The US government is known for enacting reactive legislation when disaster strikes. However, this is not the case for the commercial space industry. With the FAA extending the “learning period” to 2023, commercial companies can operate at their own risk and develop innovative systems that will help future human space flights. The decision to integrate private companies with government oversight led to the development of a new and more trusting culture that fully supported public-private collaboration.
- A balanced government policy approach is critical to creating the right environment for venture capitalist entrepreneurship and commercial success. Too much regulation restricts innovation and restrains competition. Too little oversight can lead to lax standards and issues with interoperability of systems.
- Some traits common to spacecraft disasters are management failures and pressures to keep up with unrealistic launch schedules coupled with budget constraints. The commercial space industry is new and complex, and in a perfect world disasters could be avoided. When accidents do occur, the industry must vigorously investigate all possible causes in order to prevent them in the future. Building on previous successes and failures enables each subsequent commercial space flight to get cheaper, more reliable, and improves efficiency at an exponential rate.
Discussion Questions
[edit | edit source]- What determines the location of a launch site?
- Should Congress set an official date to regulate commercial human spaceflight? Or it be based on other criteria?
- Would you and your family pay to fly into space? How much??
- Who should be responsible for the safety and success of commercial space transportation?
- Do you think the new administration of President-elect Trump will continue to support the growth of the commercial space industry?
- What role should the United Nations or other nations have in determining U.S. commercial space policy?
Maps of Locations
[edit | edit source]U.S. Map of Launch Sites and Space Ports - FAA
U.S. Space Transportation Industry Sites and Locations - FAA
3D Map of Space and Satellites - Stuffin.space
Satellite Tracker Map - Space.com
Additional Reading
[edit | edit source]- The World's Top 10 Most Innovative Companies in Space - FastCompany
- 2015 An Epic Year for the Space Industry - Space Angel Network
- Five things to know about the new FAA drone rules - USA Today
- What SpaceX's rocket landing means for commercial space travel - The Washington Post
- Commercial space industry seeks regulatory reforms in the Trump administration - SpaceNews
- National Space Society Blog
References
[edit | edit source]- ↑ https://www.faa.gov/about/office_org/headquarters_offices/ast/programs/international_affairs/media/Exploration-CST-opportunites_Nield_paper_IAA_SEC_Dec_2013.pdf
- ↑ https://www.faa.gov/about/office_org/headquarters_offices/ast/industry/
- ↑ https://www.faa.gov/about/office_org/headquarters_offices/ast/
- ↑ https://www.nasa.gov/feature/building-a-new-american-capability-with-commercial-crew
- ↑ https://science.house.gov/subcommittees/subcommittee-space-114th-congress
- ↑ http://www.space.commerce.gov/about/mission/
- ↑ https://www.faa.gov/about/office_org/headquarters_offices/ast/advisory_committee/
- ↑ http://www.commercialspaceflight.org/about-us/
- ↑ https://www.gpo.gov/fdsys/pkg/STATUTE-76/pdf/STATUTE-76-Pg419.pdf
- ↑ https://www.gpo.gov/fdsys/pkg/STATUTE-76/pdf/STATUTE-76-Pg419.pdf
- ↑ https://www.state.gov/www/global/arms/treaties/space1.html
- ↑ http://www.unoosa.org/oosa/en/ourwork/spacelaw/treaties.html
- ↑ https://www.faa.gov/news/fact_sheets/news_story.cfm?newsId=11559
- ↑ https://www.congress.gov/bill/101st-congress/senate-bill/916
- ↑ https://www.congress.gov/bill/101st-congress/senate-bill/916
- ↑ https://www.congress.gov/bill/114th-congress/house-bill/2262
- ↑ http://www.thespacereview.com/article/2166/1
- ↑ https://www.faa.gov/news/fact_sheets/news_story.cfm?newsId=11559
- ↑ https://airandspace.si.edu/collection-objects/spaceshipone
- ↑ https://www.whitehouse.gov/sites/default/files/national_space_policy_6-28-10.pdf
- ↑ https://www.whitehouse.gov/sites/default/files/microsites/ostp/national_space_transportation_policy_11212013.pdf
- ↑ https://www.congress.gov/bill/114th-congress/house-bill/2262
- ↑ https://www.nasa.gov/sites/default/files/atoms/files/soyuz_seat_modification_letter.pdf
- ↑ https://www.nasa.gov/sites/default/files/atoms/files/soyuz_seat_modification_letter.pdf
- ↑ http://www.ibtimes.com/space-advocate-makes-business-case-private-company-exploration-extraterrestrial-2134171
- ↑ http://fortune.com/2016/02/22/vcs-invested-more-in-space-startups-last-year/
- ↑ https://www.nasa.gov/content/nasa-releases-cots-final-report
- ↑ http://www.spacex.com/dragon
- ↑ http://www.orbitalatk.com/flight-systems/space-launch-vehicles/antares/docs/AntaresMissionHistory.pdf
- ↑ http://www.virgingalactic.com/human-spaceflight/our-vehicles/
- ↑ http://www.spacex.com/dragon
- ↑ http://www.spacesafetymagazine.com/news/statement-george-nield-hearing-faa-oversight-commercial-space-transportation/
- ↑ http://www.gao.gov/products/GAO-16-765T
- ↑ http://www.gao.gov/products/GAO-15-706
- ↑ http://www.faa.gov/about/office_org/headquarters_offices/ast/media/Recommended_Practices_for_HSF_Occupant_Safety-Version_1-TC14-0037.pdf
- ↑ http://www.spacepolicyonline.com/commercial
- ↑ http://www.gao.gov/products/GAO-16-765T
- ↑ http://www.gao.gov/products/GAO-16-765T
- ↑ http://www.gao.gov/products/GAO-16-765T
- ↑ http://www.gao.gov/products/GAO-16-765T
- ↑ http://dx.doi.org/10.2202/1944-4079.1012
- ↑ http://www.spacesafetymagazine.com/news/statement-george-nield-hearing-faa-oversight-commercial-space-transportation/
- ↑ https://www.whitehouse.gov/sites/default/files/microsites/ostp/national_space_transportation_policy_11212013.pdf
- ↑ http://www.commercialspace.pbworks.com/w/file/fetch/87182005/Schilling%202013.pdf
- ↑ http://www.commercialspace.pbworks.com/w/file/fetch/87182005/Schilling%202013.pdf
- ↑ http://www.spacenews.com/op-ed-orbital-debris-remediation-a-risk-management-problem/
- ↑ http://www.nasaspaceflight.com/2011/01/project-adr-removal-large-orbital-debris-nasa-study/
- ↑ http://www.orbitaldebris.jsc.nasa.gov/remediation/
- ↑ http://www.wsj.com/articles/faa-seeks-new-tools-to-track-spacecraft-1470130381
- ↑ https://www.faa.gov/about/office_org/headquarters_offices/ast/reports_studies/library/media/NAS_Integration_Mazzotta.pdf
- ↑ https://csis-prod.s3.amazonaws.com/s3fs-public/legacy_files/files/publication/100714_Berteau_CommercialSpace_Web.pdf
- ↑ https://csis-prod.s3.amazonaws.com/s3fs-public/legacy_files/files/publication/100714_Berteau_CommercialSpace_Web.pdf
- ↑ https://csis-prod.s3.amazonaws.com/s3fs-public/legacy_files/files/publication/100714_Berteau_CommercialSpace_Web.pdf
- ↑ https://www.bis.doc.gov/index.php/forms-documents/technology-evaluation/898-space-export-control-report/file
- ↑ https://www.bis.doc.gov/index.php/forms-documents/technology-evaluation/898-space-export-control-report/file
- ↑ http://www.commercialspaceflight.org/issues/
- ↑ https://www.bis.doc.gov/index.php/forms-documents/technology-evaluation/898-space-export-control-report/file
- ↑ https://www.faa.gov/about/office_org/headquarters_offices/ast/advisory_committee/meeting_news/media/COMSTAC%20ISPWG%20OFRs%20Outbrief.pdf
- ↑ https://www.faa.gov/about/office_org/headquarters_offices/ast/advisory_committee/meeting_news/media/COMSTAC%20ISPWG%20OFRs%20Outbrief.pdf
- ↑ https://www.bis.doc.gov/index.php/forms-documents/technology-evaluation/898-space-export-control-report/file
Gulf carriers vs. U.S. big three carriers and open skies
Summary
[edit | edit source]The top three U.S. Airlines; American, United, and Delta have accused the Gulf Carriers, Etihad, Emirates, Qatar Airlines of unfair competition by utilizing state subsidies to take business from lucrative routes traditionally held by the top three U.S. carriers. The U.S. carriers have asked the U.S. Departments of Transportation, Commerce, and State to open talks under the Open Skies Agreement with the governments who own or fund the airlines, and to cap the service in the U.S. at the current level while discussions are underway.[1] We present the case study to examine the dispute and analyze whether it is a case of unfair competition or an attempt at protectionism.
List of Main Actors
[edit | edit source]U.S. Big Three: The three largest American flight carriers: American Airlines, United Airlines, and Delta Airlines, who claimed that the following three Gulf carriers benefitted from over 40 billion dollars in subsidies over the past two decades. [2], violating the Open Skies agreement. [3]
Gulf Carriers: State-owned flight carriers Emirates Airline, Etihad Airways, and Qatar Airways, accused of receiving over 40 billion dollars in subsidies by their governments. [4]
U.S. Government Agencies: The United States Departments of Commerce, Transportation and State, with the support of the American Congress, [5] who are reviewing the complaints made by the Big Three [6] toward the gulf carriers.
Qatar: Government that fully owns Qatar Airways. [7]
United Arab Emirates: Middle-eastern government that owns Emirates Airline [8] and Etihad Airways [9]
Stakeholders: American companies Fedex, UPS, Boeing, and American airline companies Jet Blue Airways, Atlas Air Worldwide, and Hawaiian Airlines, who did not support the claims raised by U.S. Big Three. [10]
ICAO: The International Civil Aviation Organization, which is part of the UN, regulates air transit, and can be called in to arbitrate disputes between two countries.
Timeline of Key Events
[edit | edit source]Jan-Feb, 2015: The U.S. Big Three, formed by American Airlines, Delta Airlines, and United Airlines, made their claim to the Obama administration, expressing their wish to revisit the open skies agreement, due to unfair competition created by over 40 billion in subsidies. [11] [12]
April 10, 2015: The Departments of State, Commerce and Transportation announced that they had started reviewing the claims that the three middle-eastern state-owned carriers were being subsidized. [13]
April 30, 2015: The U.S. Congress issued a letter to the Department of State and the Department of Transportation, asking for action to be taken and information to be gathered about the claims made by the U.S. Big Three [14]
May 5, 2015" The Department of Commerce issued a notice to all stakeholders, and set a submission deadline for August 3rd, 2015, to gather information and opinions about the claims made by the U.S. Big Three. The Department created three dockets for the submission of information, which can be accessed by the public at www.regulations.gov: • DOT-OST-2015-0082 • DOS-2015-0016 • DOC-2015-0001. (On the search line, insert the code of each docket to see information.)
June 2, 2015: Etihad Airways published their rebuttal to the claims of subsidies. [15]
June 29, 2015: Emirates Airline published their rebuttal to the claims of subsidies. [16]
July 30, 2015: Qatar Airways published their rebuttal to the claims of subsidies. [17]
August 3, 2015 The CEOs from Fedex, Atlas Air Worldwide, JetBlue Airways and Hawaiian Airlines publish their rebuttal to The Departments of Commerce, State and Transportation. [18] [19]
August 3, 2015: Deadline for submissions to the Department of Commerce dockets. [20]
August 24, 2015 Deadline for submission of additional materials commenting on information to the dockets. [21]
Maps
[edit | edit source]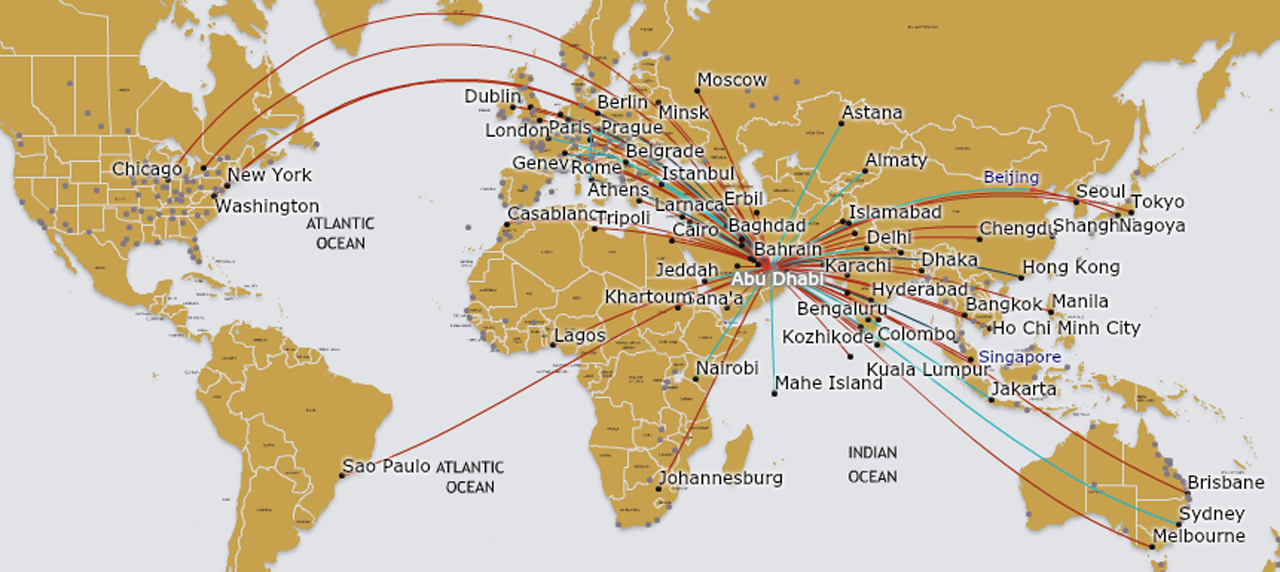
American Airlines and Emirates Airline routes map
Delta Airlines and Emirates Airline routes map
United Airlines and Emirates Airline routes map
Policy Issues
[edit | edit source]The Chicago Convention on International Civil Aviation (ICAO). The ICAO, part of the United Nations, has 191 signatory parties and is the international body that regulates international air transport. Beginning with the first convention in 1944 and continuing until today the ICAO puts out standards and rules that are to be followed by members states. The convention establishes open travel in member’s air space, designated flight paths, rights to use of public airports, and so on .[22].
Open Skies Agreements Further policies regarding international air travel are set up in bilateral open skies agreements between countries. A policy of open air transport between countries is the dominant trend in global aviation today. The United States currently has over one hundred such bilateral agreements. Furthermore, the United States has a multilateral agreement with the European Union regarding air travel. .[23]The United States has Open Skies Agreements with Qatar and the United Arab Emirates, signed in 2001 and 2002 respectively. Given the current dispute between the US Big Three and Gulf Carriers, there are few particularly relevant terms of the agreement that are important to the discussion.
Article 3 Designation and Authorization “Each Party shall have the right to designate as many airlines as it wishes to conduct international air transport…” . [24] Article 3 gives the signatory states the right to allow or deny the establishment of an airline in their country. There is no limit to the amount of airlines that can be designated by a country. Given the amount of physical capital needed to operate an airline, the number of companies are limited due to economies of scale.
Article 11 Fair Competition “Each Party shall allow each designated airline to determine the frequency and capacity of the international air transportation it offers based upon commercial consideration in the marketplace.” [25] This allows airlines to make decisions about their business based on what is best for their company. This removes the role of the government in being able to limit the amount of flights and passengers coming into a given airport. In essence this creates a global free market on air transportation. Choice is given to the airlines to decide where to set up their hubs and which airports they will provide service to. Frequency and capacity are determined by the demand for service between two points.
Article 12 Pricing Section 1: “Each Party shall allow prices for air transportation to be established by each designated airline based upon commercial considerations in the marketplace. Intervention of Parties is limited to: a. prevention of unreasonably discriminatory prices or practices b. protection of customers from prices that are unreasonably high or restrictive due to abuse of a dominant position; and c. protection of airlines from prices that are artificially low do to direct or indirect government subsidy or support. [26] Article 12 establishes a free market economy where prices are determined by supply and demand. It removes any right by the government to set price floors or ceilings. Furthermore, part c. prohibits the government from interfering to protect airlines that are based in their country by providing direct or indirect support. The American Big Three claim that the United Arab Emirates and Qatar are providing subsidies to airlines in their country. As a result the gulf carriers are able to provide better service at a lower price. When put in a global context government interference on behalf of an airline would give that airline and unfair advantage relative to other airlines.
Article 14 Settlement of Disputes This section allows for a tribunal of three arbitrators to be established in order to hear complaints between the two parties. Each Party is allowed the selection of one arbitrator, the third being selected by the two appointed arbitrators. The decision of the tribunal must be given full effect once a decision is made. [27]
Article 15 Termination Either Party may terminate the agreement at any time. [28]
The termination allows for the government that is Party to the agreement take action to end the agreement if the situation proves necessary. Disputes have been accounted for in open skies agreements and measures have been put in place to allow for a resolution to be reached without the involvement of government. Open Skies Agreements have been put in place to reduce the amount of government regulation and interference in the operations of air transport service. The agreements allow for decision to be made by the air transportation providers. Also, they simplify a complicated process of international traffic by providing a common framework to operate within. Open Skies has led to market liberalization and has had positive benefits to the market.
Liberalization of the Air Transport Market The effect of Open Skies Agreements are the liberalization of the air transportation market. Numerous studies have been conducted over the past 20 years to analyze the effect of an open air transport market. Liberalization of air travel between countries has proven to increase the amount of flights offered, decrease that cost per passenger, and increase jobs. Air travel is big business with 52% of tourist traveling by air, in 2014 airlines transported and estimated 3 billion passengers [29] . One of the fastest emerging markets is the Middle East which has positioned itself as a global passenger and cargo hub. The Air Transport Action Group estimates that the Middle East market will have the most regional air traffic growth over the next 20 years. Growth is projected at 6.3% annually compared to 3% annual growth for North America. [30] To put that into a larger context the Middle East currently accounts for 4.8% of global passenger traffic comparted to 27.1% accounted for by North America..[31] A report published by InterVistas in June of 2015 found a 16% increase of air traffic due to market liberalization. This 2015 report was an update to a report published in 2006 which came to the same conclusion, 16% increase in traffic. .[32]The report also indicates that numerous other studies conducted between 1990 and 2015 have come to a similar conclusion, 18-75% increase in air traffic, varying based on time and place. Studies conducted during that time also indicate that market liberalization results in a 10 - 40% reduction in airfares for passengers. [33]
Narrative of the case
[edit | edit source]During the past decade flights from the U.S. to UAE and Dubai went from one flight a day to 25 non-stop flights to the Middle East operated by Emirates, Qatar and Etihad.[34] The Gulf carriers say that their growth is fueled by demand and offering a better product. However, the U.S. airlines say that the Gulf carriers are receiving funding from their governments and are engaging in unfair competition and are flooding the markets with a product which is only possible with government funding. The U.S. airlines are seeking federal government intervention.
Law
The U.S. has entered agreements with over 100 countries called Open Skies Agreements which are designed to increase market access and eliminate governmental interference in market decisions such as pricing, capacity and routes.[35] The agreement provides that “each Party shall allow a fair and equal opportunity for the airlines of both Parties to compete in providing the international air transportation.”[36]
Routes
The Gulf Carriers are linking passengers from the U.S., Europe, and South America with parts of the world such the Gulf region, Asia, Australia, New Zealand and Africa.
Gulf Carriers Expansion
Since 2008 the Gulf carriers have significantly increased flights and their share of the passenger bookings for many popular international routes such as Dallas to India, Boston to Nepal, Chicago to South Africa and India, and Washington to Bangkok. The largest increase or market share is on the Dallas to India route with an increase from 11.3% in 2008 to 86.9% in 2014.[37] Likewise, as the Gulf carriers market share increases it is causing a resulting decrease in market share for the U.S. carriers. The market share for the Gulf carriers is expected to have annual growth of 11% through 2020, while the U.S. carriers are expected to have only 2% annual growth.
Product
According to a recent study the Gulf carriers entry into the U.S. markets has resulted in gains for consumers by pushing fares down.[38] But the Gulf carriers don’t just offer a cheaper product, they also offer a better product if it is measured in new planes and updated interiors. The Gulf carriers offer new planes and luxury services such Boeing 787 Dreamliners, Airbus A380s with first class suites with showers, and many other luxury accommodations.[39] However, the Gulf carriers have also won passengers with excellent service and polite workers.
Discussion
[edit | edit source]Open Skies
[edit | edit source]Open Skies Agreements are the basis for liberalized air transportation. They have been carefully negotiated between the United States and other Parties. The resolution of this complaint may have repercussions on other agreements.
Discussion Questions:
[edit | edit source]How will a drawn out fight affect Open Skies Agreements between the United States and other countries?
[edit | edit source]Competition
[edit | edit source]The question to be addressed is whether the accusations against Gulf carriers of unfair competition are accurate or whether the U.S. airlines are engaging in protectionism? According to Rob Britton an airline industry expert with Georgetown University, “the Gulf carriers are not growing the market-they are diverting traffic from U.S. airlines and their European allies by violating Open Skies policies.”[40] However, according to an article in the Washington Post the Gulf carriers deny this and take the position that “…passengers had benefited from more competition, better service and lower fares. They denied receiving unfair subsidies and said attempts to review the agreements amounted to protectionist measures by United States carriers.”
Discussion Questions:
[edit | edit source]If an airline offers a luxury seat at an affordable rate, is that unfair competition or good business risk taking?
[edit | edit source]If the public wants to fly in modern airliners with more room and better service, why should the U.S. government intervene to prevent the public from having access to that product?
[edit | edit source]If the airlines do receive government subsidies, which result in unfair competition, what would be the solution?
[edit | edit source]How has the change in market share with the Gulf carriers impacted the airline labor unions?
[edit | edit source]Protectionism
[edit | edit source]Allegations of unfair competition toward the three gulf carriers Etihad, Emirates and Qatar are not uncommon. In Europe, protectionist measures have been taken due to an "unleveled playing field." However, the main cause for that is the location of the Gulf carrier's home bases that enable them to develop long-haul hourglass hubs and to benefit from technological economies of scale of a modern long-haul wide-body fleet. [41] The main argument used by American companies other than the Big Three is that the involvement of American government will not look good in the eyes of foreign governments and companies. Messing with the Open Skies agreements will cause more problems than solve them, and protectionism from the American government is not the answer, according, for example, to Fedex, Hawaiian, JetBlue, and Atlas Air [42]
Discussion Questions:
[edit | edit source]Is protectionism much different than subsidies?
[edit | edit source]What can be learned from Fedex, Hawaiian, JetBLue and Atlas Air's conjunct statement?
[edit | edit source]References
[edit | edit source]- ↑ Link text, Forbes; Big Three vs Gulf Carriers.
- ↑ Link text, U.S. Congress.
- ↑ Link text, Department of Commerce.
- ↑ Link text, Department of Commerce.
- ↑ Link text, Letter from Congress.
- ↑ Link text, Department of Commerce.
- ↑ Link text, Reuters.
- ↑ Link text, Emirates Airline.
- ↑ Link text, Etihad Airways.
- ↑ Link text, The Dallas Morning News.
- ↑ Link text, New York Times.
- ↑ Link text, additional text.
- ↑ Link text, U.S. Department of State.
- ↑ Link text, U.S. Congress.
- ↑ Link text, Etihad Rebuttal.
- ↑ Link text, Emirates Airline Rebuttal.
- ↑ Link text, Qatar Airways Rebuttal.
- ↑ Link text, Fedex Rebuttal.
- ↑ Link text, Dallas Morning News.
- ↑ Link text, Department of Commerce.
- ↑ Link text, Department of Commerce.
- ↑ Link text, Convention on International Civil Aviation 9th edition.
- ↑ Link text, US State Department Webpage: Open Skies Agreements.
- ↑ Link text, US_UAE Air Transportation Agreement .
- ↑ Link text, US_UAE Air Transportation Agreement .
- ↑ Link text, US_UAE Air Transportation Agreement .
- ↑ Link text, US_UAE Air Transportation Agreement .
- ↑ Link text, US_UAE Air Transportation Agreement .
- ↑ Link text, Aviation: Benefits Beyond Boarders.
- ↑ Link text, Aviation: Benefits Beyond Boarders.
- ↑ Link text, Aviation: Benefits Beyond Boarders.
- ↑ Link text, InterVistasReport.
- ↑ Link text, InterVistasReport.
- ↑ Link text, Forbes; Big Three vs Gulf Carriers.
- ↑ Link text, Open Skies Agreements.
- ↑ Link text, Current Model OSA Text.
- ↑ Link text, Forbes; Big Three vs Gulf Carriers.
- ↑ Link text, Dresner; Impact Gulf Carrier Competition.
- ↑ Link text, USA Today; Gulf Airlines Lure Fliers.
- ↑ Link text, Forbes; Big Three vs Gulf Carriers.
- ↑ Link text, Protectionism.
- ↑ Link text, Fedex Rebuttal.
Conclusions
[edit | edit source]After strong pressure from the U.S. Big Three, the American government took measures to become knowledgeable about stakeholders opinions on the case. Taking action without understanding all the facts and opinions from the different parties involved could have led to disastrous effects on the economy and on international transportation. Open Skies Agreements are the foundation for market liberalization in air transport. Since market liberalization, the industry has witnessed increased traffic, cheaper flights for the consumer, and more jobs being created, directly related to the airline industry. The reviewing of the submissions by the stakeholders to the Department of Commerce will dictate as to what public policy the American government will pursue. The decision is still pending, and is one that can deeply affect the international aviation industry.
Additional Readings
[edit | edit source]Big 3 vs Gulf carriers - Forbes
Clash: Gulf carriers vs US carriers - Gulf Business
Major US Airlines push back against expansion of Gulf carriers
The Economic Impacts of Air Liberalization
Governance of street space and best practices
Summary
[edit | edit source]This Case Study provides a glimpse of Arlington County's street governance practices. The study looks at streets from three perspectives (below-grade, at-grade, and above-grade) to gain a full impression of the regulation, planning, design, and construction of the street space. As a county that lacks municipal governments, instead relying on its County Board to govern, Arlington County's governance and planning provide examples of best practices based on a variety of factors, but most specifically, based on its citizenry. Local government emphasizes the importance of citizen input to optimize resources and address issues throughout the entire county, often serving in voluntary committees tasked with setting long range plans. Additionally, Arlington County envisions and regulates streets as places that should be equally amenable to all forms of transportation, from walking to biking, driving to public transit, able-bodied and disabled, a vision that they call Complete Streets.
Case Study Selection: Arlington County
[edit | edit source]
Arlington County provides an excellent case study of Street Governance. The County has both a strong commitment to including its citizens in the transportation planning process and a strategic vision of providing an interconnected system of "Complete Streets" that allows local members of the community various affordable transportation options.
Commitment to Public Involvement
[edit | edit source]Arlington County actively engages local citizens to participate in the transportation planning process. The Arlington County website provides opportunities for members of the public to report transportation-related issues, provide feedback on transportation and transit facilities, and utilize online tools to plan trips given existing facilities. Specifically, citizens can report a pothole, a street light outage, a broken or missing traffic sign, or a sidewalk problem. Additionally, citizens may submit requests for new sidewalks, handicap ramps, or new pavement markings.[1] This type of interactive planning is helpful to Arlington County staff because they can use this crowd-sourced information to identify critical areas, or hotspots, where transportation-related improvements are most needed. Additionally, it helps citizens by providing a direct means for feedback, so they know that their concerns are considered by county staff.
Further, the “Arlington Way” is a methodology for gathering citizen input through Citizen Advisory Groups. These groups interact with county staff, the County Board, public officials, civic associations/organizations/groups, and residents in the county. Citizen Advisory Groups vary based on the development or community changes suggested. The main goal of these Groups is to identify the development option that generates the most overall community support. Therefore, the purpose of the “Arlington Way” is to ensure that all stakeholders in a development of community have the ability to provide comment and input.[2] Consistent with this engagement is the provision of information to the public through a multitude of county-run websites and social media outlets, managed explicitly by the county's social media policy and overseen by the County Manager's office.[3][4] Consistent with these rules for public information, the county has published a set of "Key Performance Measures" online, among them "Performance Measures for Mobility", by which the public may measure how effective the county is in governing.[5] Additionally, the details of all projects and plans, including strategic visions for future transportation demands, are publicly available in near real-time through the county's website.[6] Arlington County’s commitment to this all-inclusive community engagement forum is unique and laudable, as it ensures all citizens have a voice in the transportation planning process.
Vision of Complete Streets
[edit | edit source]
Arlington County has a Complete Streets program intended to support local projects that "improve safety and access for pedestrians, transit riders and bikers on noncommercial arterial streets, as well as improve street aesthetics, stormwater management and bioretention."[7] The County also supports the Neighborhood Complete Streets Committee (NCSC) that assists in identifying these improvements in coordination with the county's Master Transportation Plan and individual neighborhood needs.[8] A planning staff member from Arlington County noted that the agency took interest in the concept of complete streets in the early stages of its popularity. Arlington County focuses on multi-modalism: planning facilities that can work for everyone.[9]
Arlington's progress toward achieving this Complete Streets vision is evident in its national walkability and bikability rankings. Arlington County received Gold-Level recognition from the organization Walk Friendly Communities, a group sponsored by the US Federal Highway Administration and FedEx.[10] Arlington also received a Silver-Level rating from the Bicycle Friendly Community program, sponsored by the League of American bicyclists.[11] Additionally, Arlington offers a wide variety of public transit options including the Arlington Transit (ART) bus system, the Washington Metropolitan Area Transit Authority (WMATA) Metrobus system, the WMATA Metrorail system, and Virginia Railway Express (VRE) heavy rail system, which encourages the concept of complete streets by encouraging non-single occupancy vehicle transportation.[12]
Arlington County Staff acknowledged that its ability to integrate complete streets concepts onto County roads relates directly to the County's Transportation Demand Management (TDM) strategies.[9][13][14] By working with the public (residents, businesses, employees, etc.) to identify the best strategies and policies to get commuters and travelers out of their cars and on to alternatives, Arlington County creates a solid framework for the use of complete streets infrastructure. Encouraging alternatives to driving helps make the County's transportation system work better because there are fewer cars on the road.[9]
Methodology
[edit | edit source]To gain a comprehensive understanding of Street Governance in Arlington County, this research included assessment of Arlington County codes[15] and general transportation planning strategies. To better understand how these regulations relate to the overall planning process, the research team conducted interviews with Arlington County government managers and planning staff.[9][13][14]
The research team divided Street Governance into three areas of consideration:
- Below-Grade: Codes and planning strategies related to underground street utilities and infrastructure.
- At-Grade: Codes and planning strategies related to surface street space including parking, bike lanes, pavement, sidewalks, traffic calming, etc.
- Above-Grade: Codes and planning strategies related to above-ground street facilities including signage, signalization, overhead utilities, lighting, etc.
The discussion of best practices will consider each of these three areas of consideration.
Timeline
[edit | edit source]

| From the Arlington Historical Society:[16] | |
| 1722 | Iroquois cede to colonial Virginia the lands encompassing present-day Arlington County |
| 1720s onward | Settlement of Falls Church and Alexandria |
| 1791 | U.S. government assigns lands to the District of Columbia, including present-day Arlington County |
| 1797 | First bridge across the Potomac River; opening of Leesburg Turnpike |
| 1801 | Creation of Alexandria County |
| 1808 | Opening of Chain Bridge across the Potomac River |
| 1833-1843 | Construction of the Alexandria Canal to link to the Chesapeake and Ohio Canal |
| 1847 | County of Alexandria ceded from District of Columbia to Virginia, in part to assist funding of the Alexandria Canal |
| 1870 | Town of Alexandria became an independent city, separate from present-day Arlington County |
| 1920 | Alexandria County renamed Arlington County |
| 1932 | County and municipal governments combined as a County Board under Code of Virginia (first County Manager in the United States) |
| 1940s | Arlington expanded existing trolley lines to support rapid increase in wartime and postwar military and civilian workers and families |
| 1950 | First county-wide planning process for capital improvements in public infrastructure |
| 1957 | Creation of the "Code of the County of Arlington, Virginia"[15] |
| 1959 | County Board issued fiscal and capital improvement projections |
| 1960s | Development of County master plan for development; birth of the "Arlington Way" |
| From other sources: | |
| 2012 | Formalization of the Arlington Way as PLACE[17] |
| 2013 | Transition of all at-grade and below-grade commercial project planning to an online electronic system[14][18] |
| 2016 | Projected expansion of electronic plans review process to residential projects[14] |
Maps
[edit | edit source]Google Map of Arlington County
Arlington County uses online resources to inform citizens of street-level activity and infrastructure. The following maps are available on the websites of Arlington County's affiliate organizations:
Arlington County Bike Map published by Bike Arlington to show where bike lanes exist throughout the County.
Arlington County Bike Comfort Level Map published by Bike Arlington to illustrate the skill-level of each bike lane in the County.
Arlington County Traffic Camera Interactive Map live-streamed by Arlington County at specific traffic camera locations throughout the County to help drivers identify traffic issues before driving.
Arlington County Interactive Transit Map published by Arlington County to help transit-users easily identify apporpriate bus routes and transfer locations to plan their trips.
Arlington County Bikeshare Transit Development Plan Map Set published by Bike Arlington to not only show bikeshare locations, but also provide a picture of Arlington County's bikeshare and demographic trends.
Red Light Camera Locations in 2010 published by Arlington County points out four intersections with red light cameras.
Red Light Camera Locations in 2015 published by Arlington County points out five intersections with red light cameras.
Actors
[edit | edit source]The following stakeholders are involved in the development, maintenance, and regulatory oversight of the streets and roads in Arlington County.

Local Government
[edit | edit source]The county government offices listed here provide direct governance of the streets in Arlington County. They are responsible for implementing and enforcing all federal, state, and county laws, regulations, and codes. Other county agencies may play supporting roles in governance as needed.
- Arlington County Board: Includes five members who serve Arlington County through legislative jurisdiction; transportation policy development and decision-making; land use/zoning development and decision-making; taxation policy development and implementation; nominations for advisory committees; acknowledgement/response to community complaints; and other policy-related tasks.[19]
- County Manager's Office: Involved in general operations and services.
- Department of Community Planning, Housing & Development: Involved in zoning and strategic planning.
- Department of Environmental Services: Involved with streams, stormwater, ecology-realted matters, and energy-related matters.
- Division of Facilities and Engineering - formerly "Public Works": Involved with public utilities and above-grade development.
- Division of Transportation: Involved in right of way development and coordination of environmental policy compliance with the State Department of Transportation and federal agencies.
- Department of Parks & Recreation: Works in "green space" development and maintenance.
- Police Department: Enforces all traffic laws and misdemeanor infractions of site permits or interference with county agency site inspections.
- County Manager's Office: Involved in general operations and services.
- Judiciary: The legal bodies that concern both enforcement and regulation of transportation policies.
- Circuit Court – 17th Judicial Circuit: Involved in judicial hearings for damages
- General District Court: Involved in misdemeanor cases; preliminary hearings for possible felonies; claims for damages not greater than $25,000; and processes records such as criminal warrants, civil cases, and traffic summonses.
Private Entities
[edit | edit source]Although not directly responsible for governance, due to Arlington County's investment in civic engagement, the following private parties help shape the governance of the county's streets and roads:
- Land Developers: Companies that drive land use patterns and, thus, affect infrastructure needs in the transportation system.
- Business Owners: The type of street on which a business is located may yield an impact on the business by either attracting or deterring customers via pedestrian, bicycle, transit, auto traffic, or parking facilities. Local business owners have a strong stake in the design of their neighborhood roads. For example, a recent study by the New York City Department of Transportation (NYCDOT) found that "improved accessibility and a more welcoming street environment" increased local retail sales.[20] As one of the final phases for any project that affects the rights of way along the business fronts, county officials, project applicants, and the affected business owners meet to discuss details of the project; business owners have the opportunity to reject site plans or traffic management plans.[14] They may also submit their own plans for approval.[14]
- Property Owners: Street design also impacts property value. For example, the NYCDOT study also found that "simply improving street design can have a major impact on market values." [21]
- Private School Boards: Like business owners, private school boards also sit on plan approval meetings for projects affect the rights of way along their properties. They can submit development plans for approval.
Public Entities
[edit | edit source]Much as with private entities, the following members of the public advise and help shape the governance of the county's streets and roads:
- Members of the Public: Pedestrians, bicyclists, drivers, transit-users, and citizens affected by neighborhood streets, etc.
- Community Organizations: Groups registered with the County Board that provide input to county agencies on all rights of way development projects.
- Advisory Groups and Commissions: Approximately 50 advisory groups advise the County Board on development projects and budgets.[22]
- Condo, Homeowner & Tenant Associations and Citizen & Civic Associations: Sit on meetings with county agencies and developers during the final phases of project approvals.
- Public Interest Groups: Activists supporting specific causes related to transportation or the development of transportation infrastructure including environmentalists, non-motorized transportation advocates, ADA accessibility supporters, environmental justice advocates, and other special interst supporters.
- Public School Boards: Fulfill the same role as Private School Boards.
Policy Issues
[edit | edit source]Civic Engagement within a Commonwealth
[edit | edit source]Virginia is a commonwealth, a term that is defined popularly as a "government based on the common consent of the people."[23] Section 2 of Article I of the Constitution of Virginia, entitled "People the source of power," states "that all power is vested in, and consequently derived from, the people, that magistrates are their trustees and servants, and at all times amenable to them."[24] These notions form the foundation of Arlington County government's dedication to citizen engagement in all areas of government. This engagement, known colloquially to this day as the "Arlington Way," was formalized as a government initiative in 2012 as PLACE ("Participation, Leadership and Civic Engagement") and forms the bedrock of Arlington County agencies' rules for managing projects.[2][17] The PLACE initiative challenges county agencies and local communities to work together on all projects, from local ordinance creation and amendment to determining what civic improvements may occur. As noted in the most recent PLACE progress report published in 2012:
Arlington’s civic infrastructure is rooted in the belief that good ideas can come from anywhere; that collaboration among residents, businesses, civic organizations and County government typically leads to better results than any one working alone; and that strategic decisions are more likely to stand the test of time when developed through robust, creative, respectful civic conversations.[25]
PLACE represents a key management principle among the county agency managers interviewed for this article.[9][13][14] As one county manager said, "The greater good is always the rule."[13] PLACE requires community outreach for all right of way projects and stipulates that no project may proceed until the members of the community, the project designers, and the associated offices within the county government agree on the project's details.[2][17][25][14] To facilitate this, for instance, public meetings form the later stages of any building project proposal along the county's rights of way.[14][26] Prior to 2012, these meetings occurred within a less codified system that relied heavily on individual relationships among stakeholders, which, according to a 2000 report on community perceptions, sometimes led to project delays and "system chaos" among stakeholders with differing perceptions of authority and procedures.[27] Steady improvement since the 2000 report has led to the current system, which leverages social networking and collaborative online systems designed to provide concurrent, not serial, approval of development projects among stakeholders. According to one county agency manager, the online system for property site development plans review has reduced county government approval times from between 9 and 12 months down to less than 60 days.[14]
No Chartered Cities or Towns in Arlington County: Central Governance of All Streets and Roads
[edit | edit source]Arlington County uses the county board form of government defined in Chapter 4 of Title 15.2 in the Code of Virginia, meaning that none of its communities, towns, or cities are chartered ("incorporated") separately from the county government.[28] Consequently, the governance of all streets and roads resides with the county government, one of only two counties in the state which do so.[14] For state and federal roads in the county, county agencies form the primary government oversight contacts and coordinate with the appropriate state and federal authorities on behalf of county residents.[14] This consolidates all project management and funding within the county under a single set of agencies and rules. Historically, although this simplified applications for permits and oversight of projects overall, since there were only a handful of offices involved, limited staffing and information technology constraints often meant that applicants for projects would have to anticipate that county agencies could take as long as 9 to 12 months to approve plans.[14] As mentioned above, since the transition to project management using an electronic system, this time-frame has significantly decreased.[14] Although there may be residual complications with residential projects away from the town center, the research team did not identify any complaints directed at county government through popular media and a complete review of county documents through a Freedom of Information Act request was beyond the scope of this research.
Wealth, the Tools It Affords, and the Commitment It Requires
[edit | edit source]As illustrated in the table below, according to the United States Census Bureau, between 2009 and 2013 the median household income of Arlington County residents was roughly twice that of the national average and 61% higher than the statewide figure. Compared to national and statewide figures, Arlington county has a lower percentage of unemployment (by a factor of 3 to the national figure), fewer people not in the labor force, and fewer family households. Virginia's statewide figures closely match national figures.
| Arlington County | Virginia | United States | |
|---|---|---|---|
| Median household income (2009-2013) | $103,208 | $63,907 | $53,046 |
| Family households as percent of population | 46.1% | 67.4% | 66.4% |
| Median family household income | $139,244 | $76,745 | $64,719 |
| Percent of population aged 25 to 54 (2013) | 56.4% | 42.3% | 40.8% |
| Percent Unemployed (2013) | 3.9% | 7.2% | 9.7% |
| Aged 16 and over, not in labor force (2013) | 20.8% | 33.3% | 35.7% |
| High school graduate or higher, percent of persons age 25+ (2009-2013) | 93.7% | 87.5% | 86.0% |
| Bachelor's degree or higher, percent of persons age 25+ (2009-2013) | 71.7% | 35.2% | 28.8% |
These figures indicate that Arlington County is wealthier and more educated than state and national averages, with fewer unemployed. In 2013, the online newspaper ArlNow reported that U.S. Census data drawn from the same source as the above table positioned Arlington County as the "richest in the nation" by family household income.[33] As noted by county officials, this wealth provides the resources to engage with the community through social media, extensive website outreach, and numerous public meetings. It also ensures adequate staffing at county agencies and allows project management agencies to host and mandate the use of an electronic computer aided design application for all site development projects.[13][14] According to the county agency managers interviewed, with these resources also comes the cultural understanding within the government that higher levels of public service are necessary, especially in the form of public outreach.[9][13][14]
Best Practices
[edit | edit source]Below-Grade
[edit | edit source]Stormwater Management and Street Drainage: Since 1992, Arlington County has implemented stringent municipal stormwater management policies consistent with the Virginia Chesapeake Bay Preservation Act of 1988[34] and U.S. federal standards under Section 402 of the Clean Water Act of 1972.[35] In 2013, Arlington County was the first county in Virginia to adopt "next generation" stormwater management practices beyond current nationwide standards, consistent with the U.S Environmental Protection Agency's (EPA) "Phase III Rules" under the Clean Water Act.[14][36][37] The EPA published a case study about Arlington County entitled "Innovative Stormwater Management Standards and Mitigation," to serve as an example of municipal stormwater management practices for other municipalities attempting to implement Phases I and II of the Clean Water Act.[38] This dedication to environmental protection extends to control of stormwater runoff for all development projects along and under the County's streets. Each project of 2,500 square feet or greater must submit "a plan of development that includes a landscape conservation plan, a stormwater management plan, and an erosion and sediment control plan."[38] According to the County's Chief of the Development Services Bureau, this oversight includes the state's rights of way as well as the county's, since the state's jurisdiction for their streets that run through the county do not extend below the surface or beyond the street pavement.[14] The county enforces all issued permits through on-site inspections and roving patrols throughout the county.[14] In June 2010, the Arlington County Board set new levels of civil penalties ranging from $25 to $32,500 per day for violations of stormwater permits.[39][40] These penalties do not include associated costs to businesses or citizens incurred as a result of county inspectors issuing requirements for the immediate halt of all work when noting such violations.[14] In cases where violators do not heed the instructions of the county inspectors or obstruct the county inspectors in the course of their duties, inspectors may call for the assistance of the police.[14]
Underground Utilities: Arlington County incorporates into its county code all state and federal regulations governing the installation and maintenance of electrical services, sewage and public water, and underground residential gas distribution.[41] County websites provide user-friendly checklists for the installation, modification, or removal of services along and under county, state, and federal rights of way.[41] Plan reviewers within multiple offices concurrently review any plans and meet with permit applicants and affected residents throughout the review process.[14] County inspectors ensure compliance with all permits from the beginning to the end of any project through a mixture of site visits, formal and informal letters, and telephone calls.[13][14] Inspectors also patrol the county to confirm that unpermitted projects are not occurring.[14] The system of fines noted for stormwater management also apply here, as well as a number of penalties for any failure to comply with electrical systems requirements, fire prevention procedures, and utilities regulations.[15]
At-Grade
[edit | edit source]Pavements: Arlington County has a pavement rating system based on County-collected pavement condition data. This database is the primary method of prioritizing streets for repavement. As the County compiles this list based on the data, staff adjust the list to also consider citizen complaints or future utility work (i.e., the County will time a repavement in conjunction with water main installations, etc.). For example, Arlington County staff acknowledged the need to repave a section of Wilson Blvd. west of the Ballston area, but also recognized community interest in "road diet" strategies. Therefore, the County delayed the repavement effort to design a plan to add bike lanes and widen sidewalks during the repavement.[9]
Arlington County published official Pavement Marking Specifications in 2014. These specifications guide the marking plan, materials, dimensions, and design. Types of marking include crosswalks, cross sections, speed humps, speed tables, lane sections, bike lanes, bike/sharrow directions, bus stops, no-stopping areas, and combinations of these features. Arlington County upkeeps the pavements based on these specifications and welcomes citizen input for additional marking suggestions.[42]
.jpg)
Bicycle Facilities: Arlington County staff combines in-house prioritization strategies with public involvement when identifying new bicycle facilities and improvements. Arlington County's Master Transportation Plan (MTP) Bicycle Element includes a "Bikeway Facility Project List" that lists proposed bicycle improvements ranked by priority.[43] This project prioritization is not set in stone, however, as opportunities may arise that make a proposed project more or less feasible than at the time of the MTP's development. (For example, a staff member at Arlington County noted that the best time to improve or add new bicycle lanes is when the County is repaving a street space. The repavement construction process allows designers at the County to allocate the street space differently to create more right-of-way for bicycle facilities.) The County has educated and engaged staff members who monitor needed improvements based on existing conditions and crash data. In addition, as part of the Arlington Way, advisory committees combine with members of the community to identify support for specific new facilities.[9]
Arlington County introduced separated bike lanes in 2014 on Hayes Street. Separated bike lanes make bicycling safer, as they provide a barrier between the bicycle lane and car lanes, adding a layer of protection for the biker. Arlington intends to add more of these facilities, most of which will occur when coupled with repaving projects, as described above. For example, the Rosslyn Sector Plan adopted in July 2015 includes four street improvements (Fort Myer Dr. and Lynn St. will become two-way streets) that will provide space for new separated bike lanes.[44]
Traffic Calming Mechanisms: Arlington County started its Neighborhood Traffic Calming program about 15 years ago. This program originally involved residents in the community submitting their streets for evaluation for traffic calming improvements. For each submission to the program, Arlington County staff would collect speed data along the neighborhood street and assess the need for traffic calming infrastructure. In most cases, the response was the addition of speed bumps on the street. Arlington County recently "wound down" the program because staff found that the speed bumps may not be the best method of reducing local speeds.[9]
Arlington County now focuses traffic calming work on adding curb extensions. This tactic involves narrowing streets to build or expand sidewalks. Curb extensions improve visibility for both pedestrians and drivers along major arterial roadways, as curb extensions prevent parked cars from blocking pedestrian line of slight. Curb extensions also reduce the time and length of the street crossing. To implement these strategies, County staff looks at public feedback, existing conditions, and opportunities based on repavement schedules. For example, if a street is already wide, a curb extension and ADA curb ramps may be an easy, cost-effective addition during a repavement effort.

On-Street Parking: Arlington County only maintains parking spaces on the street. The County manages metered parking, as well as the residential parking permit program. To reduce excessive parking in neighborhoods nearby major destinations (shopping centers, hospitals, etc.), the County restricts parking at certain hours so only residents of that district can utilize on the on-street space. Changes in parking structure often couple with major roadway projects or repavements. The County attempts to keep as many parking spaces as possible, but also weighs the benefits of having a parking spot versus utilizing the space for a bikeshare station or other facilities.[9]
The County is also in the process of developing a Parklet program, in which former parking spaces transition into miniature park/green spaces. Parklets serve two main purposes: (1) to encourage transportation alternatives to the automobile and (2) to increase public greenspace in urban areas. The Rosslyn Business Improvement District (BID) reached out to the County during the development of the Rosslyn Sector Plan to request a parklet in a specific location. Arlington County staff investigated Virginia State Law and worked with the County Attorney to determine whether this suggestion was feasible. The County reviewed the regulations behind other areas in the state that built parklets and is in the process of finalizing the permit for the parklet was feasible for Rosslyn.[9]
 |
 |
Transit Infrastructure: ART (Arlington Transit) is maintained under the jurisdiction of the County. Arlington County therefore includes staff members who plan the bus stops and transit stations that contribute to Arlington's Complete Streets. Any project where there is a transit route on the street involves transit planners to review existing street space. The following bullets show some innovative techniques employed for transit integration into the streetscape:[9]
- Transit planners utilize curb extensions on commercial arterial streets for transit stops to prevent the need for the bus to pull into the curb and pull back into traffic. Using this practice, the bus can stop in the lane, allow passengers to board quickly, and continue along the route.
- Future improvements to Columbia Pike include raised curbs to meet the bus door for easy passenger boarding and alighting.
- In areas where there are high volumes of traffic, Arlington County plans to extend bus stations to two bus lengths to allow for multiple buses to load simultaneously, thus reducing dwell time.
- Arlington County prefers to locate bus stops at the far side of an intersection to allow the bus to pass through the green light and load on the opposite side of the intersection so the buses do not get caught at lights after riders board.
Above-Grade
[edit | edit source]Streetlights: In order to maintain consistency, structural/electrical integrity, and general safety, Arlington County has a detailed list of specifications required for streetlight installation. Arlington County released the most most recent set of guidelines in May 2014. These include specifications addressing contractors and developers regarding streetlight materials, electricity components, installation, inspection, design, and drawing.[45]
Arlington County requires that streetlight design begin early on in the development process to ensure proper time for review of the lighting plan. [46] For example, Arlington County requires that streetlights utilize LED lights to conserve energy through these specifications. The county also requires "light level calculations" to ensure that the amount of light shed by the infrastructure creates a safe environment for street-level activity.[47]

Traffic Signals: Arlington County also sets specifications for traffic signal requirements, construction, improvements, cabling, communication systems, materials, and design in the document released in May 2014.[45] Arlington County's specifications involve the entire traffic signalization design process from roadway work permits to fiber-optic cables, emergency signal preemption and the materials of the signal poles. By covering all of these bases in the specifications, Arlington County ensures quality and safety by design. Some exemplary work in the County Traffic Signal standards include: energy-saving LED signal materials, pedestrian buttons at each corner of an intersection, emergency vehicle preemption capability, video camera surveillance, and standard "Traffic Signal Plan Sheets" submitted to the County when a developer proposes a new traffic signal.[48]

Signage: Arlington County's Traffic Signs Program includes a variety of signs for regulation, safety, way-finding, parking, construction, and other mode-specific features for pedestrian, cyclist, and drivers. The signage program entails all public sign installation, replacement, maintenance, and removal in the County. Arlington County distinguished regulatory signs with a white backdrop and easily-legible text. Signs for safety purposes have yellow backdrops and often an image or symbol of the warning feature. Directional signs have green backdrops and often provide text that includes the location, mileage to the location, and potentially an arrow with the direction or an exit number. Signage related to the Capital Improvement Program have blue backgrounds and provide details on the project in progress. Arlington County is responsible for placing the signs based on their local knowledge of the streets. The County welcomes public involvement in the street sign program by providing both telephone and online contact information for signage suggestions.[49]
Traffic Cameras: Arlington County has a red light camera program entitled PhotoRED. The benefits of these red light cameras is twofold: they enforce prompt observance of the traffic signals and, thus, increase safety at intersections. The County’s red light cameras capture vehicles that “enter the intersection after the light has turned red for one-half of a second.” These cameras not only take three photos, but also record a short video of the violation. Intersections with PhotoRED infrastructure have signs 500-feet in advance of the intersection warning drivers about the upcoming traffic signal. Arlington County mails the violation notices to drivers and generally request a fee of $50. (Note: The infraction does not result in driver’s license points or notice of insurance.)[50]
Virginia State Code allows Arlington County to utilize camera-monitoring systems at a rate of one camera for every 10,000 residents. The current nine intersections selected for the program were recommended via Arlington County’s Traffic Accident Reduction Program due to high number of incidents and citizen complaints.[50]
The first-generation red light cameras installed in 2010 yielded a noticeable impact on each intersection, as they no longer place as high in rankings of crash location. Further, an Arlington County staff member recognized that about 97 percent of offenders do not have repeat violations. This statistic indicates that once a citizen obtains violates from a PhotoRED camera, they are unlikely to run a red light again. The staff member lauded PhotoRED for “changing the behavior of drivers,” forcing them to slow down and be more attentive while driving. The staff member also noted that the program does not rely on tax dollars, as the revenue from violators funds the infrastructure. [51]
Noise Control: Arlington County sets stringent requirements in its county code for the prevention of noise pollution.[52] These include restrictions of specific noises to "daytime," which the county defines as "the local time of day between the hours of 7:00 a.m. and 9:00 p.m. on weekdays and between the hours of 10:00 a.m. and 9:00 p.m. on a Saturday, Sunday, legal holiday."[52] Inspectors measure noise using the following criteria:
Any noise measurements made ... shall be taken from any built street at its curb or on the edge of the pavement or from any location on the property that receives the noise, unless the property that receives the noise is located in a multi-unit structure, in which case the measurements ... shall be taken from a common area within or outside the structure, or from any other unit within the respective multi-unit structure when the owner or tenant of the unit from which the measurement is to be taken consents to measurement from his, her or its unit.[52]
Among the restricted noises are construction sounds, certain levels of vehicle noise, "loud outcry" for public selling, and noise exceeding specified decibel levels. Additionally, certain noises are prohibited at whatever decibel levels, among them vehicle horns (except as emergency warning signals), loud music or video audio, and "running a commercial motor vehicle" for more than 10 minutes when the vehicle is parked or stopped (other than for traffic or maintenance).[52] The police and county officials are responsible for the enforcement of these rules; often preliminary enforcement falls to development site inspectors.[14]
Conclusions
[edit | edit source]- Arlington County's integrated and relatively safe streets are a reflection of 65 years of explicit urban development plans relying on community engagement.
- The county's commitment to multi-modal transportation options yields a system in which modes operate in harmony with one another rather than competition.
- Arlington's rules for development projects are clearly defined and publicly accessible, simplifying their implementation and enforcement.
- The ready availability of public funds is a major contributing factor to the County's ability to implement programs and infrastructure improvements.
- Citizens are a critical part of the process, in which members of the community feel connected and responsible for their streets. Further, Arlington County makes the citizen involvement process easily accessible to all through online and telephone platforms.
- Successful street governance extends beyond the actual streets. Arlington County staff acknowledged that Transportation Demand Management strategies are paramount to reducing the number of cars on the road, which ultimately makes the system more efficient.
- Automating or using computer-based systems whenever possible makes governance run more smoothly. This is apparent through the electronic development plan review program, the PhotoRED program, and the pavement database prioritization methodology.
- Arlington County's single-body jurisdiction helps to expedite processes, as there is only one governing body involved.
- County-led programs help to inspire consistent change. For example,the former Neighborhood Traffic Calming Program, the upcoming Parklet Program, the Traffic Signs Program, the PhotoRED Program, and other programs initiated by the County each work toward a single cause using a standard methodology, which makes the process easy to emulate from project to project.
- Arlington County's successful implementation of Complete Streets throughout the County underscores the importance of coupling resources. The County looks for potential improvements in every repaving project, which combines funding to achieve multiple goals.
- Standards ensure quality. Arlington County's development and publication of standards for much of its infrastructure is apparent in the quality and consistency of street features throughout the county.
Discussion Questions
[edit | edit source]- When walking, biking, or driving in Arlington County, what do you notice in terms of signage? Do you think Arlington is leading the way for other communities?
- If there was an opportunity for a Capital Bikeshare station near your house but it required the use of two on-street parking spaces, would you favor that trade-off? What about a parklet?
- Which cities do you think offer better street governance practices than Arlington? What could be done to improve local practices?
- Do you think that the level of citizen involvement in Arlington County street planning and governance is too much? Not enough?
- Are red light cameras a "fair" way to monitor driving violations?
- Does Arlington County being under one jurisdiction make it easier to implement programs and strategies?
Additional Readings
[edit | edit source]Smart Growth America's National Complete Streets Coalition: Complete Street Fundamentals
Arlington County's "Participation Leadership and Civic Engagement" program
Arlington County's list of Transportation Projects
Arlington County's Guidelines for Installing Underground Utilities Near Trees
Arlington County's Department of Environmental Services: Traffic Signal & Streetlight Specifications
Arlington County's Department of Environmental Services: Pavement Marking Specifications
References
[edit | edit source]- ↑ County of Arlington, Virginia, "Transportation," accessed Oct 12, 2015, http://transportation.arlingtonva.us/
- ↑ a b c Abbott Bailey, "Mapping the Arlington Way: Understanding the System of Citizen Participation in Arlington County," June, 2000, http://arlingtonva.s3.amazonaws.com/wp-content/uploads/sites/21/2014/11/Mapping-the-Arlington-Way.pdf.
- ↑ County of Arlington, Virginia, "Connect with Us," accessed Oct 14, 2015, https://newsroom.arlingtonva.us/connect/
- ↑ Arlington County Manager's Office, "Administrative Regulations: Social Media Policy and Guidelines," Jun 30, 2009, http://icma.org/en/icma/knowledge_network/documents/kn/Document/6523/Arlington_County_Social_Media_Policy_and_Guidelines
- ↑ County of Arlington, Virginia, "Key Performance Measures," accessed Oct 14, 2015, http://transportation.arlingtonva.us/key-performance-measures/
- ↑ County of Arlington, Virginia, "Projects & Planning," accessed Oct 14, 2015, http://projects.arlingtonva.us/types/
- ↑ County of Arlington, Virginia, "Complete Streets", accessed Oct 13, 2015, http://projects.arlingtonva.us/programs/complete-streets/
- ↑ County of Arlington, Virginia, "Neighborhood Complete Streets Commission (NCSC)," accessed Oct 12, 2015, http://commissions.arlingtonva.us/neighborhood-complete-streets-commission/
- ↑ a b c d e f g h i j k l Ritch Viola, telephone interview by Christine Sherman, Oct 2, 2015.
- ↑ Arlington County Commuter Services, "Arlington Recognized as Gold-Level Walk Friendly Community," accessed Oct 13, 2015, http://www.walkarlington.com/pages/about/arlington-recognized-as-walk-friendly-community/
- ↑ The League of American Bicyclists, "Current Bike Friendly Communities 2014," accessed Oct 12, 20145, http://bikeleague.org/sites/default/files/Fall_2014_BFC_List.pdf
- ↑ Arlington Transit, "ART and Metrobus Routes Serving Arlington," accessed Oct 13, 2015, http://www.arlingtontransit.com/pages/map/
- ↑ a b c d e f g Michael Connor, interview by Houda Ali, Courthouse Plaza, Arlington, Virginia, Oct 6, 2015.
- ↑ a b c d e f g h i j k l m n o p q r s t u v w x y Luis Araya, interview by Eric Stahl, Courthouse Plaza, Arlington, Virginia, Oct 9, 2015.
- ↑ a b c County of Arlington, Virginia, Arlington County Board, "Arlington County Code," accessed Sep 29, 2015, http://countyboard.arlingtonva.us/county-code/.
- ↑ Arlington Historical Society, "History of Arlington County," accessed Oct 16, 2015, http://www.arlingtonhistoricalsociety.org/learn/history-of-arlington-county/alexandria-county-district-of-columbia/
- ↑ a b c County of Arlington, Virginia, "Participation Leadership and Civic Engagement," accessed Oct 10, 2015, http://topics.arlingtonva.us/place/
- ↑ County of Arlington, Virginia, "Civil Engineering Plans," accessed Oct 11, 2015, http://topics.arlingtonva.us/building/civil-engineering-plans/
- ↑ County of Arlington, Virginia, "County Board," accessed Oct 13, 2015, http://countyboard.arlingtonva.us/about/
- ↑ New York City, Department of Transportation, "The Economic Benefits of Sustainable Streets," Dec 13, 2013, http://www.nyc.gov/html/dot/downloads/pdf/dot-economic-benefits-of-sustainable-streets.pdf, pg. 5
- ↑ New York City, Department of Transportation, pg. 8
- ↑ County of Arlington, Virginia, "Advisory Groups & Commissions," accessed Oct 12, 2015, http://commissions.arlingtonva.us/
- ↑ "Commonwealth (U.S. State)," Wikipedia, accessed Oct 10, 2015, wikipedia:Commonwealth (U.S._state)
- ↑ Virginia General Assembly, Constitution of Virginia, amended 2011, art. I, sec. 2
- ↑ a b County of Arlington, Virginia, Office of the County Manager, "Participation, Leadership and Civic Engagement: Report to the County Board," Dec 2012, http://arlingtonva.s3.amazonaws.com/wp-content/uploads/sites/21/2014/11/PLACE-Report-FinalWithPageNo.pdf
- ↑ County of Arlington, Virginia, Department of Environmental Services, Division of Transportation, Development Services Bureau, "Transportation Right of Way Guide," accessed Oct 10, 2015, http://topics.arlingtonva.us/permits-licenses/transportation-right-way-permit-guide/
- ↑ Bailey, p. 19
- ↑ Virginia General Assembly, Code of Virginia, amended 1950, title 15.2, http://law.lis.virginia.gov/vacode/title15.2/
- ↑ United States Census Bureau, "State & County QuickFacts: Arlington County, Virginia," accessed Oct. 10, 2015, http://quickfacts.census.gov/qfd/states/51/51013.html
- ↑ United States Census Bureau, "Selected Economic Characteristics: 2009-2013 American Community Survey 5-Year Estimates," accessed 10/12/2015, http://factfinder.census.gov/bkmk/table/1.0/en/ACS/13_5YR/DP03/0100000US%7C0400000US51%7C0500000US51013
- ↑ United States Census Bureau, "Selected Social Characteristics: 2009-2013 American Community Survey 5-Year Estimates," accessed 10/12/2015, http://factfinder.census.gov/bkmk/table/1.0/en/ACS/13_5YR/DP02/0100000US%7C0400000US51%7C0500000US51013
- ↑ County of Arlington, Virginia, "Major Statistics," 2013, accessed Oct 12, 2015, http://arlingtonva.s3.amazonaws.com/wp-content/uploads/sites/31/2014/03/Major-Statistics-2013.pdf
- ↑ Ethan Rothstein, "Arlington Ranks as Richest County in America", ArlNow, Sep 23, 2013, https://www.arlnow.com/2013/09/23/arlington-1-nationwide-in-family-income/
- ↑ Virginia General Assembly, 1988 Session, Code of Virginia, Amended 1988, Title 62.1, Chapter 3.1, Article 2.5, "Chesapeake Bay Preservation Act," http://law.lis.virginia.gov/vacodefull/title62.1/chapter3.1/article2.5/
- ↑ United States Congress, 92nd (1972), Statute 86-816, "Federal ", http://www.gpo.gov/fdsys/pkg/STATUTE-86/pdf/STATUTE-86-Pg816.pdf
- ↑ Metropolitan Washington Council of Governments, "Protecting Local and Regional Water Quality: Stormwater Management in the Metropolitan Washington Region," Nov 2013, https://mwcog.org/environment/water/Stormwater%20factsheet%20-%20REVISED_110513.pdf
- ↑ County of Arlington, Virginia, "MS4 Permit," accessed Oct 14, 2015, http://environment.arlingtonva.us/stormwater-watersheds/management/ms4-permit/
- ↑ a b United States, Environmental Protection Agency, "Innovative Stormwater Management Standards and Mitigation," accessed Oct 14, 2015, http://water.epa.gov/polwaste/npdes/stormwater/Innovative-Stormwater-Management-Standards-And-Mitigation.cfm
- ↑ County of Arlington, Virginia, Department of Environmental Services, " Fiscal Year 2013 Annual Stormwater Management Program Report," Sep 30, 2013, https://arlingtonva.s3.amazonaws.com/wp-content/uploads/sites/13/2013/10/Stormwater-Permit-Annual-Report.pdf, pg. 32
- ↑ County of Arlington, Virginia, County Code, Chap. 26, Sec 26-9, "Penalties," http://arlingtonva.s3.amazonaws.com/wp-content/uploads/sites/22/2014/01/County-Code-26-Utilities.pdf
- ↑ a b County of Arlington, Virginia, "Building," accessed Oct 14, 2015, http://topics.arlingtonva.us/building/
- ↑ County of Arlington, Virginia, "Pavement Marking Standards," Nov 2013, http://arlingtonva.s3.amazonaws.com/wp-content/uploads/sites/21/2013/11/DES-Pavement-Marking-Standards.pdf
- ↑ County of Arlington, Virginia, "Master Transportation Plan: Bicycle Element," Feb 2014, http://arlingtonva.s3.amazonaws.com/wp-content/uploads/sites/31/2014/02/DES-MTP-Bicycle-Element.pdf
- ↑ County of Arlington, Virginia, "Rossyln Sector Plan," July 17, 2015, https://projects.arlingtonva.us/wp-content/uploads/sites/31/2015/07/Final-draft-Rosslyn_Sector_Plan-Posted_07-17-2015.pdf
- ↑ a b County of Arlington, Virginia, "Traffic Signal and Street Light Specifications," Dec 2013, http://arlingtonva.s3.amazonaws.com/wp-content/uploads/sites/21/2013/12/Traffic-Signal-and-Street-Light-Specifications.pdf
- ↑ County of Arlington, "Traffic Signal and Street Light Specifications," pg. 113
- ↑ County of Arlington, "Traffic Signal and Street Light Specifications," pg. 112
- ↑ County of Arlington, "Traffic Signal and Street Light Specifications," pg. 103
- ↑ County of Arlington, Virginia, "Traffic Signs," accessed Oct 13, 2015, http://transportation.arlingtonva.us/streets/traffic-signs/
- ↑ a b County of Arlington, Virginia, “PhotoRED,” accessed Oct 14, 2015, http://police.arlingtonva.us/photored/
- ↑ Lt. Ken Dennis, email interview by Houda Ali, Oct 16, 2015
- ↑ a b c d County of Arlington, Virginia, County Code, Chap. 15, "Noise Control," Jan 2014, http://arlingtonva.s3.amazonaws.com/wp-content/uploads/sites/22/2014/01/County-Code-15-Noise-Control.pdf
Transportation impacts of lifting the crude oil export embargo
SUMMARY
[edit | edit source]There is current debate across many sectors in the country as to whether or not the crude oil export ban in the United States should be lifted. The case will review the motivations behind lifting and retaining the ban, the background of the ban itself, and the many policy issues that are currently playing a role in the debate. There will also be an explanation of the process of refining crude oil, as well as the various ways crude oil is transported across the country. This case study will give a thorough overview of the ban on exporting crude oil and the resulting impacts on transportation if the ban were to be lifted.
LIST OF MAIN ACTORS
[edit | edit source]Government Actors
[edit | edit source]Bureau of Industry and Security: a sector in the Commerce Department that regulates crude export restrictions[1]
President of the United States: can allow crude oil exports if found to be in the “national interest”[1]
Congress: can pass or deny legislation ending crude oil export embargo[1]
EPA: has ability to fine companies for spilling crude oil[2]
Federal Railroad Administration: responsible for overseeing safety on railroads[3]
Pipeline and Hazardous Materials Safety Administration: regulates safety guidelines regarding crude oil[3]
Industry Actors and Concerned Citizens
[edit | edit source]American Petroleum Institute: the primary Trade Association for the U.S. petroleum industry, including members in exploration, production, transportation, refining, and marketing.[4]
Independent Petroleum Association of America: Trade Association for independent crude oil and natural gas explorer/producers.[4]
National Petroleum Council: a federally chartered and privately funded advisory committee to advise, inform, and make recommendations to the Secretary on any matter relating to oil and natural gas or the industries associated with oil and natural gas.[4]
American Fuel and Petrochemical Manufactures: Trade Association representing high-tech American manufactures of fuel and petrochemicals.[4]
Association of American Railroads: Trade Association representing America's freight and passenger railroads.[5]
Association of Oil Pipe Lines: Trade Association representing America's oil pipeline infrastructure.[6]
American Waterways Operators: Tug, tow and barge Trade Association.[7]
Waterways Council, Inc.: Tug, tow and barge Trade Association.[8]
Environmental Groups: opposed to lifting the ban due to fear of environmental impacts, such as increased carbon emissions[1]
Union Associations: Workers in the industry for oil producers, transporters, and refiners.
TIMELINE OF KEY EVENTS
[edit | edit source]1973: OPEC Oil Embargo [1]
1975: Congress passed the Energy Policy and Conservation Act of 1975. [1]
1979: Congress passed the Export Administration Act. [1]
March 24, 1989: Exxon Valdez Oil Spill in coastal waters off of Alaska[9]
2001: The Export Administration Act expired. The President issued the International Emergency Economic Powers Act as an Executive Order.[1]
2002: Pipeline Safety Improvement Act[10]
2004: Coast Guard and Maritime Transportation Act[11]
2006: Light Tight Shale Crude Oil Boom Started
July 25, 2010: Enbridge Oil Spill in Kalamazoo, Michigan[2]
March 29, 2013: Pegasus Oil Spill in Mayflower, Arkansas[12]
July 6, 2013: Train Derailment and Explosion in Lac-Mégantic, Quebec, Canada[13]
April 2014: H.R.4349 (Crude Oil Export Act) introduced in the House. H.R.4349 will allow unlimited crude oil exports without a license to countries without sanctions.[14]
March 2014: H.R.4286 and S.2170 (American Energy Renaissance Act of 2014) introduced in the House and Senate. H.R.4286 and S.2170 will allow unlimited crude oil exports without a license to countries without sanctions.[15] .[16]
December 2014: H.R.5814 (To adapt to changing crude oil market conditions) introduced in the House. H.R.5814 will allow unlimited crude oil exports without a license to countries without sanctions.[17]
January 2015: H.R.156 (Crude Oil Export Act) introduced in the House. H.R.156 will allow unlimited crude oil exports without a license to countries without sanctions.[18]
February 2015: H.R.666 and H.R.702 (To adapt to changing crude oil market conditions) introduced in the House. H.R.666 and H.R.702 will allow unlimited crude oil exports without a license to countries without sanctions.[19] [20]
March 2015: H.R.1487 and S.791 (American Energy Renaissance Act of 2015) introduced in the House and Senate. H.R.1487 and S.791 will allow unlimited crude oil exports without a license to countries without sanctions.[21][22]
May 2015: H.R.2369 and S.1312 (Energy Supply and Distribution Act of 2015) introduced in the House and Senate. S.1372 (American Crude Oil Export Equality Act) introduced in the Senate. H.R.2369, S.1312 and S.1372 will allow unlimited crude oil exports without a license to countries without sanctions.[23][24]
October 2015: H.R.702 (To adapt to changing crude oil market conditions) passed the House.[20]
MAPS
[edit | edit source]Top U.S. Crude Oil Producing States in 2014
Oil Refining Capacity and Coking Refinery Capacity by PADD
Operable Oil Refineries and Capacity, 2012
Map of North American Crude by Rail
Map of U.S. and Canadian Pipelines
NARRATIVE
[edit | edit source]Over the last two years, there has been a discussion on the feasibility to allowing the export of domestically produced crude oil. With the shale oil boom producing more light sweet crude than our refineries can currently handle, many production companies would like to permission to export crude oil. Infrastructure issues that have already become an issue with moving crude from production field to domestic refineries may become an even bigger problem if exporting crude oil is allowed.
Crude Oil Export Motivations
[edit | edit source]Producers want to earn as much as possible from their wells.[1] Light Tight Oil is sold at a discount to other light sweet crude oils on the world market due to the inability to export. A higher price on the market could ensure that producers continue to drill for oil.
Infrastructure Issues
[edit | edit source]Most oil pipeline infrastructure was built when imports exceeded domestic production. Therefore, pipelines were built to bring oil from the Gulf Coast to the Midwest. East and West Coast refineries received foreign oil from tankships. With most oil now coming from Canada and North Dakota through Cushing, OK to the Gulf Coast, pipeline bottlenecks exist in Cushing, and in Houston, TX, the hub for the Gulf Coast. Oil fields in Texas are sending oil through pipeline to Cushing and directly to Houston as well. These bottlenecks are making the transport of crude oil through rail and marine modes more economical than they otherwise would be.[25] Exporting crude oil would only exacerbate the pipeline bottleneck issues.
The refineries that most need the light tight oil produced domestically are on the east and west coasts. Rail is the primary method to transport domestic oil from the Midwest to the east and west coast as there are no current pipelines. However, in some case, the price to ship crude oil by pipeline to the Gulf Coast and then by tankship to the East or West Coast is cheaper than shipping by rail from the oil field to the refinery.[11]
BACKGROUND
[edit | edit source]Export Ban History
[edit | edit source]In 1973, OPEC embargoed crude oil for delivery to the United States. This increased the price of all oil products and as a result, Congress passed the Energy Policy and Conservation Act. The Energy Policy and Conservation Act banned domestic crude oil from being exported without a license, established the Strategic Petroleum Reserve, and reduced energy consumption. However, the law stated that the President may allow export of crude oil as long as it is consistent with the national interest. The law was amended in 1990 and 1994. In 1979, the Export Administration Act established the Bureau of Industry and Security (BIS) to administer the licenses to export crude oil. The Export Administration Act expired in 2001 and the President created an Executive Order, the International Emergency Economic Powers Act, to keep the BIS administering the Energy Policy and Conservation Act.
The Energy Policy and Conservation Act requires a license from the BIS to export crude oil. Currently, licenses are allowed for the following reasons:
- Crude oil from Alaska's Cook Inlet
- Exports to Canada for consumption
- Refine or exchange crude oil in the Strategic Petroleum Reserve
- California heavy crude oil at not greater than 25,000 barrels/day
- Consistent with certain international agreements
- Consistent with other laws passed (Alaska's North slope oil)
- Foreign crude oil not co-mingled with domestic crude oil
Some of the other laws passed allow crude oil that has been shipped through the Trans Alaska Pipeline. Crude oil that has been transported through a Mineral Leasing Act Federal Right of Way and crude oil produced from the Outer Continental Shelf must also go through the licensing process to be exported.[1]
The Energy Policy and Conservation Act only prevented the export of crude oil. Refined products have been and are exported without any controls.
Crude Oil
[edit | edit source]Crude Oil - Each crude oil has its own characteristics and quality. The two major qualities are density and sulfur content.[26]
Density - Density is measured in API (American Petroleum Institute) gravity. Light crude is easier to refine into the preferred products and therefore sells at a premium to heavy crude. Heavy crude is usually defined as 20 API or lower. Light crude is defined by the New York Mercantile Exchange as between 32 and 42 API.[27][26]
Sulfur Content - Sulfur is an additive that must be removed from the crude in the refining process. Sour crude is usually defined as a sulfur content of 0.5% or higher. Sour crude is more expensive to refine.[28]
As a consequence of density and sulfur content, light sweet crude commands a premium on the free market over heavy sour crude.[26]
Domestic crude oil (light tight oil) is a light sweet crude and will command a premium on the international market.
Refining
[edit | edit source]Refining - Refining is necessary to make crude oil into the products used by industry and the public. Different refineries have different equipment to handle the different types of crude oil. Each process unit costs around a million dollars with some costing up to 600 million dollars.[29] Refineries in the Gulf Coast, Midwest, and West are configured to handle all types of crude from light sweet crude to heavy sour crude. As heavy sour crude is cheaper, these refineries are able to make a good margin on refined products. Refineries in the Northeast are mainly configured to handle light sweet crude oils. Refineries are able to retool their refineries to take advantage of different types of crude oil, but this may be a very expensive process.Currently, many of the Gulf Coast refineries are only importing heavy sour crude. The light sweet crude that they previously imported is now sourced domestically.[1]
Refining Process
[edit | edit source]Fractionation (Distillation): using heat and/or pressure to separate the different types of crude into products. Light products (butane, propane, gasoline) will rise to the top. Medium products (kerosene, diesel) will rise but not as high. Heavy products (heavy fuel oil, residuals) will remain at the bottom.
Conversion: converting crude products into other products that are more needed by the marketplace. (More gasoline and diesel, less heavy fuel oil and propane.) Conversion includes decomposition, unification and alteration.
Decomposition: change heavy products into lighter ones
Thermal Cracking: heat through the Visbreaking process, Steam Cracking process or Coking process)
Catalytic Cracking: using a chemical catalyst through Fluid Catalytic cracking, Moving Bed Catalytic cracking, or Thermofor Catalytic Cracking.
Unification: change light products into heavier ones
Alkylation: done through catalysts
Polymerization: often done through heat, may be done by a catalyst
Alteration: alter the chemical structure to change the product into one more used by industry
Isomerization
Catalytic Reforming
Treatment: remove impurities (heavy metals, sulfur, oxygen, salts) to produce finished goods.
Formulating and Blending: form specific blends to sell (octane 87 or 91 gas)
Other refining operations: Solid waste and wastewater treatment, storage and handling, sulfur recovery, etc.
Auxiliary operations: pollution control, administration, air/water/steam gases, power generation, flares, sampling and testing, pumps/valves, etc[30]
The current domestic oil production is of light sweet crude. Many of the oil refineries that are close to the oil fields are set to refine heavy sour crude. There is a mismatch between the type of crude that is being produced and the type of refinery in the United States.
Oil Transportation Processes
[edit | edit source]Crude oil is transported by barge, ship, rail, pipeline and truck.[11][31][32]
| Conveyance | Capacity (000 barrels) | Cost per Barrel | Speed | Crew Size | Inventory | Operating Geography |
|---|---|---|---|---|---|---|
| River Barge | 20-90 | $4-5 | 4-5 mph | 4-10 | 3500-4000 | Inland rivers, intracoastal waterway |
| Seagoing barge (ATB) | 50-300 | $5-6* | 10 knots (12 mph) | 6-12 | 86** | Coastal U.S. |
| Handysize product tanker | 300 | $5-6* | 2-15 knots (14-18 mph) | 21-28 | 31** | Coastal U.S. |
| Aframax or Suezmax crude oil tanker | 800-1300 | $5-6* | 2-15 knots (14-18 mph) | 21-28 | 11 U.S.** 1400 foreign flag | Alaska to Puget Sound and California, U.S. Gulf Coast to Eastern Canada |
| 100 car unit train | 70-80 | $10-15 | 40-50 mph | 2 | 45,000 crude oil tank cars/450 unit trains*** | continental U.S., predominantly west-east |
| Crude oil pipeline | 400-800 | $5 | 3-8 mph | 1-2 (remote monitors) | 57,500 miles | predominantly midcontinent, south-north, Alaska |
| Truck | .2 | $7-19 | 55-65 mph | 1 | 100,000 | continental U.S., Alaska |
Notes: *Domestically shipped oil. International prices are $1-3 per barrel. **For domestic service, vessels must be U.S. built and U.S. flagged. ***Tank car inventory increasing rapidly.
The current capacity of pipelines is exceeded and rail and barge transport have increased as a substitute. The cost to build a new pipeline is more expensive than additional rail line. Owners of pipelines may require a 10 year commitment versus a 1-2 year commitment from a new rail line.[33]
Rail transport has increased dramatically, mostly to east coast refineries. Rail is also delivering to ships and barges for the last portion of the transport chain to the refinery. Several new routes include:
- rail to barge at St. Louis and Hayti, MO, and Osceola, AR, on the Mississippi River, to Gulf refineries
- rail to barge at Hennepin, IL, on the Illinois Waterway, to Gulf refineries
- rail to vessel at Albany, NY, on the Hudson River, to East Coast refineries
- rail to Yorktown, VA, for coastal transport to East Coast refineries
- rail to vessel at Anacortes and Vancouver, WA, for coastal transport to West Coast refineries.[11]
POLICY ISSUES
[edit | edit source]Pipeline Policy
[edit | edit source]The Code of Federal Regulations Title 49, Volume 2, Subtitle B, Chapter 1, Subchapter D is the federal regulation for the transportation of oil via pipeline. This federal regulation covers the safety and compliance of transporting crude oil via pipeline.The Pipeline and Hazardous Materials Safety Administration (PHMSA) is responsible for implementing the regulations.[34] The Pipeline Safety Improvement Act of 2002 was implemented in order improve pipeline safety, The act was intended to give control of pipeline inspection to individual states, increase the federal safety programs, as well as increase public awareness of pipelines. However, there has been a continued lack in staffing of pipeline inspectors. Another attempt to increase pipeline safety has been the use of automatic shut-off valves. The National Transportation Safety Board (NTSB) has recommended using the automatic shut-off valves, most notably in high-risk areas and those areas with high population. In order to make changes to the valves, there is a high cost factor, which has led to delays in implementation.[10]
Rail Policy
[edit | edit source]The Federal Railroad Administration oversees the safety and implements regulations for the railroads in the United States. The PHMSA is responsible for implementing the regulations. The Code of Federal Regulations Title 49, Volume 4, Subtitle B, Chapter 1, Subchapter C Part 174 is the federal regulation for the transportation of oil via rail. This federal regulation covers the operation of the rail car, as well as handling, loading and unloading of tank cars, and the identification of tank cars as hazardous.[34] The Federal Railroad Administration (FRA) oversees the safety aspects of rail transportation. Many safety guidelines come from the PHMSA, a section of the U.S. DOT, and the FRA then applies the guidelines to rail transportation. Following recent train derailments, many important safety implications have come to light involving rail transportation of crude oil. It has been suggested that speed, braking systems, crew size, and train control can have major impacts on the safe transportation of crude oil. Trains need to have an advanced system for braking that could help prevent derailments, or they would need to reduce speed. If a train is traveling at a lower speed, the likelihood of there being a spill is decreased. There are some that oppose this option as advanced braking systems are very costly and reducing speed could slow other rail lines down. Another option would be to have a minimum of two crew on a train at all times. There are some that oppose this because a second crew member has historically been shown to cause distractions, resulting in accidents. Another option is to implement better train control, which could override actions caused by human error, which could prevent accidents. Requirements for implementation are currently being debated.[3]
Marine Policy
[edit | edit source]The Code of Federal Regulations Title 46, Volume 1, Chapter 1, Subtitle D, Parts 30-39 and Title 33, Volume 2, Chapter 1, Subtitle O, Parts 151-159 are the federal regulation for the transportation of oil via barge and tanker. This federal regulation covers the safety and compliance of transporting crude oil via waterways.[34] In recent years there has also been legislation passed to increase safety of transportation of crude by barge. Congress passed the Coast Guard and Maritime Transportation Act of 2004 in order to implement better safety standards on barges. The legislation required that the Coast Guard implement safety inspections for barges and tankers and certify the inspections and ship-building that would be similar to what is required of other ships. This legislation would put in place better safety standards related to infrastructure and crew. There has also been efforts to implement limits on hours of service, but there continues to be debate on what the rest period should be, six or eight hours.[11]
The Merchant Marine Act of 1920, better known as the Jones Act, requires that any cargo shipped domestically is required to be on a U.S. flagged vessel that was built in the United States, with a crew of U.S. citizens, and at least 75% owned by a U.S. citizen. The Jones Act was passed in part to support the U.S. merchant marine and U.S. shipbuilders.
The Jones Act make shipping oil by sea more expensive than it otherwise would be. Building a ship in the United States is 70-150 million dollars more expensive than building it internationally. Operating the ship is approximately four times more expensive, mainly in crew salaries. As a result, more than twice as much crude oil is being shipped by sea from the Gulf Coast to Canada (at approximately $2 a barrel) than from the Gulf Coast to the East Coast (at approximately $5 a barrel). A foreign flagged tanker can take the oil to Canada but a US tanker must carry the oil to the U.S. East Coast.
The approval to allow export of crude oil from the Trans-Alaska pipeline was allowed if the oil was carried on a U.S. owned and crewed tanker, built anywhere in the world. Oil exports never exceeded approximately 7% and ceased in 2000.
Repealing the Jones Act may allow East Coast refineries to take more U.S. oil. However, it will be at the expense of the U.S. merchant marine and shipbuilding industry. [11]
Truck Policy
[edit | edit source]The Code of Federal Regulations Title 49, Volume 5, Subtitle B, Chapter 1, Subchapter C, Part 177 is the federal regulation for the transportation of oil via highway, which would include the transportation via tanker truck. This federal regulation covers the safety, compliance, handling, loading and unloading of tank cars, and the identification of tanker trucks as hazardous.The PHMSA is responsible for implementing the regulations. The U.S. DOT and Federal Motor Carrier Safety Administration are responsible for overseeing the implementation of regulations.[34]
Transportation Safety
[edit | edit source]Transporting crude oil can be very dangerous, especially if safety is overlooked. No matter how oil is transported, spills will occur. The most dangerous mode for an oil spill depends upon what is the most concern: human life and property, amount of oil spilled overall, or the environment.
From safest to most damaging:
- For human life and property: boat, pipeline, rail, truck
- For amount of oil spilled per mile traveled: boat, rail, pipeline, truck
- For damage to the environment: rail, truck, pipeline, boat[35]
Currently, pipelines account for 70% of crude oil transportation, followed by 23% on marine barges and tankers, 4% by truck, and 3% by rail. However, with the rise in production of crude oil, rail transportation has seen a rise in usage, due to the ability to carry larger volumes.[35] Between 2011 and 2012, rail transportation saw a 423% increase in transportation usage, by volume transported.[1] Pipeline transportation is the most cost-effective means of transportation based on volume transported by distance over time. One rail tank car can carry approximately 700 barrels of crude oil. If a train had 100 cars, that means the train could transport approximately 70,000 barrels of crude oil. A pipeline can carry approximately 830,000 barrels the same distance. However, there is a much bigger network of rail track than there is pipeline in the United States. There is roughly 140,000 miles of railroad track compared to only roughly 57,000 miles of crude oil pipeline. A truck can only carry 200 barrels. Truck transportation is the least cost effective and least efficient mode of transporting crude oil.[35]
There can be many causes for accidents, some due to negligence and some due to unforeseen actions that as a result have created mass destruction. Those that oppose lifting the ban have concerns that are deeply rooted in safety and worry about an increase in accidents.[36]
Environmental Impacts related to Crude Oil Spills
[edit | edit source]Rail transportation, in attempts to be competitive with pipeline transport, has attempted to add more cars in order to transport more. However, this can have devastating consequences in the case of an accident and subsequent spill because the train cars are heavier and slower to react to stops. If the trains are carrying more crude, they would then have the ability to spill more oil, if an accident were to occur.[35] One of the worst crude oil spills from a train occurred on July 6, 2013 in Lac-Mégantic, Quebec, Canada. While the train was stopped overnight, the necessary hand brakes were not all secured and a fire in the locomotive caused the locomotive to shut down, resulting in a lack of air brakes. As a result of many errors, the train rolled down the decline it was resting on and barreled into the city of Lac-Mégantic. The entire train derailed at the curve and the crude oil spilled out of the cars, which then caught fire and exploded. Forty-seven people lost their lives in the derailment and much of the town was destroyed.[13] Regardless of the devastation in Quebec, rail has been shown to have a lower amount of spills, based on volume traveled[1], however, recent spills have made transportation by rail frowned upon due to increased number of accidents as of late.
Transportation by ship can also have devastating consequences when accidents and spills occur. Some of the largest spills on record are results of shipping accidents. When spills occur in the water, the negative impact on the ecosystem is instantaneous.[35] One of the worst marine-related oil spills due to transporting crude oil occurred on March 24, 1989 when the oil tanker, Exxon Valdez, hit a reef in coastal waters near Alaska. As a result of the blow, the hull cracked and approximately 11 million gallons of crude oil rushed into the water. The devastation to marine life is still recovering, 25 years after the spill.[9] Ship transportation is another mode of transportation that has a record of very low spillage per mile of transport, yet it is still frowned upon due to the significant ecosystem damage that occurs as a result of a spill.[1]
Pipelines are not free from accidents or spills. There are roughly 280 spills from pipeline every year.[35] There have been two notable oil spills from transporting heavy crude oil via pipeline in the United States in recent years. Even though both spills involved heavy crude oil, they bring to light many safety implications for transporting light crude oil as well. In other words, a great deal can be learned from the two following spills. On July 25, 2010, the Enbridge pipeline ruptured and the company was unable to shut the pipeline off for 17 hours as nearly 1 million gallons of heavy crude oil spilled into a nearby creek near Kalamazoo, Michigan.[2] On March 29, 2013, the Pegasus pipeline ruptured near Mayflower, Arkansas spilling nearly 134,000 gallons of heavy crude oil into the town and nearby creek.[12] Each company has been fined and have spent billions in cleaning up the spills, even though residents don’t feel the area will ever return to what they once were.[2]
Environmental Impacts related to Climate Change
[edit | edit source]Another environmental concern that is playing a large part in the debate of whether to lift the crude oil embargo is related to the effects on climate change. Environmental advocates worry that the increased production of extracting crude oil will have negative impacts on the environment and increase the carbon emissions.[1] In 2012, the EPA found that 32 million metric tons of greenhouse gasses were released as a result of oil production and transportation. This is a rather small amount when compared to the combined total of over 6,000 million metric tons that the United States produced that same year. An end to the export ban would likely increase global emissions, as a result of global usage and increased production.[37] The environmental impacts related to climate change are greatly contested and are strongly debated. One alternative to debating whether or not environmental impacts would increase, it would be more beneficial for the United States government to look into proccesses which could make production safer and less damaging to the environment.[38]
Energy and Economic Impacts
[edit | edit source]Lifting the crude oil embargo could have impacts on the economy by affecting oil and gas prices. Based on the economic theory of international trade, ending the oil embargo by adding US oil exports to the world market, the price of oil would be pushed more towards the world price. Therefore, an increase in world supply and demand would have an effect on the price of oil. In this case, an increase in supply, all else equal, would result in a decrease in the world price. However, with an increased supply, it is possible that demand for crude oil would increase, which would result in an increase in the price of oil.[1] By lifting the ban on exporting crude oil, there would likely be an increase in the U.S. price of crude oil, but there would be a decrease in the world price of crude oil, due to increased competition.[36] However, it is not likely that the effects on the price of oil would be great. An increase in the world supply of crude oil, would bring stabilization in the price of oil, which would have an important role should there be any future supply scares.[1] Gas prices in the United States are impacted by the world price of crude oil. If the export ban was lifted and there was an increased world supply of crude oil, this would bring stabilization to the oil and gas market. The impact would be a decrease in the price of gasoline, however the decrease would be minimal, current estimates are a drop between five and ten cents per gallon.[38] Ultimately, the effects on both the world price of crude oil and the domestic price of gasoline would be directly impacted by the reaction of OPEC to an increased supply of crude oil. OPEC controls the market and could take action to manipulate the price of oil. While it is likely that the world price of crude oil would increase and the price of domestic gasoline prices would decrease, both price effects would be minimal.[39] An end to the crude oil embargo would also have an impact on the overall U.S. economy, as a result of increased exports. A study by the Brookings Institute has found that if the embargo were lifted, it could result in GDP in the upper billions to lower trillions throughout the next 25 years.[40]
The United States is a member of the International Energy Agency. The International Energy Agency is an independent agency that works with its member states to stabilize supply of energy and reduce fear, but the IEA also works with non-member states to promote clean, affordable, and sustainable energy.[41] As a result of being a member of the IEA, the U.S. must maintain a Strategic Petroleum Reserve, which can help resolve disruptions in case of increased supply needs. With an end to the crude oil embargo, the U.S. can become an ally in times of need or disaster for other countries, similar to how Europe was able to provide petroleum from their reserves after Hurricane Katrina.[1] The oil embargo was put in place due to a fear of running out of oil. With increased production, the fear of running out of oil is no longer as great of a threat.[42] An increase in crude oil would have an overall positive impact on the world energy resources.
CONCLUSION
[edit | edit source]Due to the increased production of crude oil, bottlenecks have already occurred while transporting crude oil across the country. Transportation of crude oil has already increased across all modes. If the export ban were to be lifted it can be presumed that the transportation of crude oil will also continue to rise across modes. An end to the export ban could lead to an increase in building infrastructure, as there would be an even higher need for more rail, pipeline, and ships. It could also be presumed that there would be an increase in employment, as there would be more need for individuals to produce the oil as well as transport it. Before the ban would be lifted it is necessary to look at every angle and ensure it is the best solution for the entire country. It is critical that safety is taken into high consideration and that the government looks into best practices. It is very important that all avenues are considered because the impacts of lifting the export ban would have an impact on the entire country.
DISCUSSION
[edit | edit source]Should the Jones Act be repealed? What would happen to U.S. merchant marine and U.S. shipbuilders if it was? Should the government require that exports be carried on U.S. ships?
What is the most important aspect of crude oil transportation safety (human life and property, amount of oil spilled, or damage to the environment)?
Is the possibility of more greenhouse gases contributing to climate change a reason to keep the export ban?
What are additional safety measures that could be enacted that could prevent spills and increase safety?
ADDITIONAL READINGS
[edit | edit source]U.S. Crude Oil Export Policy: Background and Considerations http://www.pennyhill.com/jmsfileseller/docs/R43442.pdf
U.S. Rail Transportation of Crude Oil: Background and Issues for Congress https://www.fas.org/sgp/crs/misc/R43390.pdf
Shipping U.S. Crude Oil by Water: Vessel Flag Requirements and Safety Issues https://www.fas.org/sgp/crs/misc/R43653.pdf
REFERENCES
[edit | edit source]
Governance of Washington DC Metro
Summary
[edit | edit source]In 2001, the Washington Metropolitan Area Transit Authority (WMATA) celebrated an important milestone in its history when the final portion of the initial 103 mile Metrorail system was opened for operations.[43] After 32 years of construction and 25 years of operations, the system was complete.[44] WMATA was on top of the world, having been awarded the American Public Transportation Association's Outstanding Achievement Award twice in 1987 and 1997.[45] Following the completion of the system in 2001, the Government Accountability Office (GAO) praised WMATA for their "sound policies, programs and practices."[46]
This would all change though during the next decade. Accidents, near misses and constant reports of mismanagement and dysfunction changed the public perception of WMATA. Its governance structure received special attention. Even the GAO, the same office that praised WMATA in 2001, released a report entitled "Washington Metro Could Benefit from Clarified Board Roles and Responsibilities, Improved Strategic Planning" in 2011, criticizing the current governance structure of WMATA and called for changes.[47] Since then, the calls for changes have only increased as it has become apparent that WMATA's governance structure must change.
However, there is disagreement amongst various parties to the cause of the current situation. This case study will investigate some of these causes, including the problems of; managing a multi-jurisdictional organization such as WMATA; the structural nature of transit system that WMATA has built, maintains and operates; the lack of funding for WMATA; the policies and bylaws of the WMATA Board of Directors; and the constraints and limitations imposed by the WMATA Compact. This case study will first describe the current actors involved in the case, followed by a timeline of important events. Maps and organizational charts will be provided here as needed. The narrative of the case will be described before the policy issues presented above will be discussed. The case study will finish with its conclusion and the posing of discussion questions for the group.
Annotated List of Actors
[edit | edit source]Washington Metropolitan Area Transit Authority (WMATA)
[edit | edit source]An interstate compact agency that currently provides heavy rail,[48] bus[49] and paratransit[50] services inside the Washington Metropolitan Area Transit Zone (Zone). The Zone includes the District of Columbia (DC), the Virginia cities of Alexandria, Fairfax and Falls Church, the Virginia counties of Arlington, Fairfax and Loudoun and the Maryland counties of Montgomery and Prince George's.[51] WMATA operates the nation's second largest heavy rail system, sixth largest bus system and fifth largest paratransit system.[52]
- Board of Directors (Board)- The governing body of WMATA.[53] Comprised of eight voting members and eight alternate members, for a total of 16 members. DC, the Commonwealth of Virginia (Virginia), the State of Maryland (Maryland) and the General Services Administration (GSA) may appoint two voting and alternative members each.[54] The Board selects from amongst these members their own Board Chairman and Vice Chairman and can hold meetings as frequently or infrequently as they deem appropriate.[55] The Board Members are not compensated for their services, but can be reimbursed for necessary expenses.[56] The Board has many powers including appointing and dismissing the WMATA General Manager[57] and other offices at their pleasure [58] and has final approval on specific issues, including bus route changes, capital project spending and fare increases.[59] As of October 25, 2015, all eight full member and alternate member spots are occupied.[60]
- General Manager (GM)- The GM is the "chief administrative office of the Authority" and "shall be responsible for all activities of the Authority."[61] The GM is appointed by, serves at the pleasure of the Board, can be removed by the Board and shall perform all duties and functions as specified by the Board.[62] The GM oversees most of the day-to-day operations of WMATA and its staff.[63]
- WMATA Staff- The staff that is managed by the GM. Under the GM there are 11 departments [64] and 70 sub-departments.[65] The size of the total workforce is more than 12,600 men and women.[66]
States
[edit | edit source]There are two states, the State of Maryland and the Commonwealth of Virginia, and one district, the District of Columbia, that are involved in WMATA. The appropriate actors for each one are presented below.
State of Maryland (Maryland)
[edit | edit source]- Washington Suburban Transit Commission (WSTC)- The body that appoints the two voting and two alternates to the WMATA Board for the State of Maryland.[67] The Maryland WMATA Board voting and alternate members must be members of the WSTC. The WSTC has seven members, with three appointed by the Governor of Maryland, two appointed by the Executive of Montgomery County and two appointed by the Executive of Prince George's County.[68] Traditionally, Maryland's two voting members to the WMATA Board are selected from the Governor's appointees to the WSTC and the alternate members are split between one member each from Montgomery and Prince George's Counties.[69] In addition to its role in selecting the Maryland members of the WMATA Board, the WSTC is charged with paying the local share of WMATA funding for Montgomery and Prince George's Counties.[70] This is done through annual appropriations made by the Maryland General Assembly from the Maryland Transportation Trust Fund to the WSTC, who pay it to WMATA.
- Governor of Maryland- The chief executive for Maryland and is responsible for appointing three members to the WSTC and by tradition the two voting members for Maryland on the WMATA Board.
- General Assembly of Maryland- The legislature of Maryland. They are responsible for appropriating Montgomery and Prince George's Counties' share of WMATA funding through the Maryland Transportation Trust Fund.[71] Their approval, along with the approval of the General Assembly of Virginia, the Council of the District of Columbia and the Congress of the United States, is necessary for amending the WMATA Compact.[72]
- Montgomery County- A county located in suburban Washington, DC that is located within the Zone. By tradition, the County Executive appoints one of the alternate members for Maryland to the WMATA Board. They are required to provide funding for WMATA. Their portion is covered by payments made to the WSTC from the Maryland Transportation Trust Fund.
- Prince George's County- A county located in suburban Washington, DC that is located in the Zone. By tradition, the County Executive appoints one of the alternate members for Maryland to the WMATA Board. They are required to provide funding for WMATA. Their portion is covered by payments made to the WSTC from the Maryland Transportation Trust Fund.
Commonwealth of Virginia (Virginia)
[edit | edit source]- Northern Virginia Transportation Commission(NVTC)- The body that appoints the two voting and two alternate members to the WMATA Board for Virginia.[73] The Virginia WMATA Board members and alternates must be members of the NVTC. The NVTC has twenty members, who are elected officials.[74] Five members are appointed by Fairfax County, three from Arlington County, two from the City of Alexandria and one member each from Loudoun County, the City of Fairfax and the City of Falls Church.[75] The Chairman of the Commonwealth Transportation Board is a member, as well as four members from the House of Delegates and two members from the Virginia Senate.[76] The county members are appointed by their respective counties, the CTB Chairman by the Governor, the House members by the Speaker of the House and the Senate by the Senate Rules Committee.[77] Traditionally, Virginia's two voting members to the WMATA Board are selected from Fairfax and Arlington County appointees and the two alternates are selected from Fairfax County and Alexandria City appointees.[78] In addition to appointing the Virginia members of the WMATA Board, the NVTC is responsible for paying for the Virginia localities' share of local funding to WMATA from state and local sources.[79]
- Governor of Virginia- The chief executive of Virginia and is responsible for appointing the Chairman of the Commonwealth Transportation Board, who is a member of the NVTC.
- Virginia General Assembly- The legislature of Virginia. Responsible for paying for two-thirds of the Virginia localities' share of local funding to WMATA through the NVTC.[80] The sources of this funding includes a two cent gas tax collected in the Northern Virginia localities located in the Zone and other state revenues.[81] Their approval, along with the approval of the General Assembly of Maryland, the Council of the District of Columbia and the Congress of the United States, is necessary for amending the WMATA Compact.[82]
- Arlington County- A county located in suburban Washington, DC that is located in the Zone. By tradition, the one of its three members on the NVTC is one of Virginia's full WMATA Board Members. Pays the remaining one-third of their share of local funding for WMATA from general revenues.[83]
- Loudoun County- A county located in suburban Washington, DC that is located in the Zone. Notable for being the only locality in the Zone to have no Metrorail service[84] and pays no local funding to WMATA.[85] This will end following the completion of the Silver Line.
- Fairfax County- A county located in suburban Washington, DC that is located in the Zone. By tradition, the one of its five members on the NVTC is one of Virginia's voting members on the WMATA Board Members. Another Fairfax County member is, by tradition, one of the alternate members. Required to pay the remaining one-third of their share of local funding for WMATA from general revenues.[86]
- City of Alexandria- A city located in suburban Washington, DC that is located in the Zone. By tradition, one of its two members on the NVTC is one of Virginia's alternate WMATA Board Members. Required to pay the remaining one-third of their share of local funding for WMATA from general revenues.[87]
- City of Fairfax- A city located in suburban Washington, DC that is located in the Zone. Required to pay the remaining one-third of their share of local funding for WMATA from general revenues.[88]
- City of Falls Church- A city located in suburban Washington, DC that is located in the Zone. Required to pay the remaining one-third of their share of local funding for WMATA from general revenues.[89]
District of Columbia (DC)
[edit | edit source]- Council of the District of Columbia (DC Council)- The legislature for DC and responsible for appointing the two voting and two alternate members from the District of Columbia to the WMATA Board.[90] Traditionally, one voting member and one alternate member is selected by the DC Council from among its 13 members.[91] The other voting and alternate members are chosen from the Mayor of the District of Columbia's administration by the DC Council.[92]
- Mayor of the District of Columbia- Executive of the District of Columbia and selects, through the DC Council, a voting and alternate member for the WMATA Board from their administration.[93]
- District Department of Transportation (DCDOT)- The department of transportation for DC and the entity responsible for providing funding from the District of Columbia to WMATA.[94] Payments are made every quarter, with funds for operations coming from the general fund and funds for capital projects coming from general obligation bonds.[95]
Federal Government
[edit | edit source]The Federal Government has played a large role in the construction and operations of WMATA since its inception in 1967. They were responsible for up to 60 percent of the funding for the construction of the Metrorail system and continue to provide funds to them today.[96]
- Congress of the United States of America (Congress)- The legislature of the United States and responsible for consenting to any changes made to the WMATA compact once Maryland, DC and Virginia have passed the necessary legislation to amend it.[97] Can also pass legislation compelling DC, Maryland and Virginia to amend the compact, as was done in 2009.[98] Congress appropriates Federal funding to WMATA for operations and capital costs.
- General Services Administration (GSA)- Agency responsible for appointing the two voting and two alternate members from the Federal Government to the WMATA board. The Administer of General Services makes the appointment decisions based on consultations with local stakeholders such as local transportation boards, Federal agencies and local members of Congress.[99] Unlike the other appointing bodies, the GSA is required by the WMATA Compact to have one of its appointed members be a regular passenger or user of WMATA's rail and/or bus services.[100]
- Federal Transit Administration (FTA)- Agency inside the Department of Transportation responsible for directing Federal Government funding to WMATA and, through its State Safety Oversight Agency program, overseeing the system's safety, along with the Tri-State Oversight Commission.[101] Recent decisions by Congress have given the FTA the sole authority for safety oversight of the WMATA Metrorail system.[102]
Timeline of Important Events
[edit | edit source]- February 20, 1967- Birth of WMATA.[103]
- 1969- Construction of Metrorail by WMATA begins.[104]
- January 14, 1973- Following the failing of the private bus operators, WMATA assumes operations and maintenance of the region's bus services. Metrobus is created.[105]
- March 27, 1976- Metrorail begins operations following the opening of the first portion of the Red Line between Brookland and Farragut North stations.[106]
- January 13, 1982- First major accident involving passengers on Metrorail when train crashes at Federal Triangle Station. Occurs on same day as Air Florida Flight 90 Crash on the 14th Street Bridges.[107]
- 1994- Metroaccess, a paratransit service provided by WMATA, begins operations.[108]
- January 6, 1996- Heavy snowstorm causes crash of Red Line train at Shady Grove.[109]
- 1997- Tri-State Oversight Commission is established by a Memorandum of Understanding between DC, Maryland and Virginia to oversee safety on Metrorail.[110]
- April 20, 2000- Train catches fire between Farragut West and Foggy Bottom.[111]
- January 13, 2001- Green Line opened from Anacostia Metrorail station to Branch Avenue Metrorail station. The initial 103 mile Metrorail system is complete after 32 years of construction.[112]
- 2004- First expansions of the Metrorail system are completed and opened to the public. The Blue Line is extended to Largo Town Center and an infill station at New York Avenue is constructed on the Red Line.[113]
- November 4, 2004- Two trains crash into each other on the Red Line at Woodley Park-Zoo Station with 20 injuries.[114]
- March 2009- Construction on Silver Line to Tysons Corner, Dulles International Airport and Loudoun County begins.[115]
- June 2, 2009- Two Red Line trains crash into each other at the Fort Totten Station. 8 passenger and one crew member are killed and over 80 individuals are injured.[116]
- March 2010- Richard Sarles, is selected to be the Interim General Manager for WMATA by the WMATA Board.[117]
- January 2011- Richard Sarles is promoted from Interim General Manager to General Manager.[118]
- July 26, 2014- Phase I of the Silver Line is completed connecting Tysons Corner to the Metrorail system.[119]
- September 24, 2014- WMATA General Manager Richard Sarles announces he will retire from his position effective January 16, 2015.[120]
- January 12, 2015- Smoke incident at L'Efant Plaza Metrorail station caused by faulty electrical equipment and other issues kills one passenger and injures 95 other individuals.[121]
- January 16, 2015- Richard Sarles retires from WMATA. Jack Requa becomes new Interim General Manager pending the selection of a permanent General Manager by the WMATA Board.[122]
- February 14–15, 2015- WMATA Board comes close to selecting Grace Crunican, former manager of the Bay Area Rapid Transit (BART) system in San Francisco, as the new General Manager for WMATA. Under pressure from DC and Maryland officials prevents the WMATA Board from making a decision and the effort collapses.[123]
- October 9, 2015- Following investigations into the response of WMATA to the L'Efant Plaza Metrorail station smoke incident, safety oversight for the WMATA Metrorail system is transferred from the Tri-State Oversight Committee to the Federal Transit Administration.[124]
- October 28, 2015- News is leaked that former aerospace executive Neal Cohen has been selected as the new WMATA General Manager.[125]
- November 2, 2015- Neal Cohen withdraws his candidacy for the new WMATA General Manager position.[126]
- November 5, 2015- Paul Wiederfeld is chosen by the WMATA Board to be the new General Manager. He is the former administrator of the Maryland Transit Administration and the former executive of Baltimore-Washington International Airport.[127]
Narrative of the Case
[edit | edit source]The Washington Metropolitan Area Transit Administration (WMATA) is a unique system providing transit services to two states and one district. Conceived in the 1960s, construction began on the Metrorail system in 1969 and the first section opened in 1976.[128] The entire system was completed in 2001 and expansion began shortly thereafter.[129] WMATA began to provide bus service in 1973 and para-transit, Metroaccess, services in 1994.[130] Today, WMATA's rail service, Metrorail, operates on over 106 miles of track and serves 86 stations.[131] Their bus service, Metrobus, operates on over 325 routes using 1,500 individual buses.[132] These services means that WMATA now currently operates the country's second largest heavy rail transit system, sixth largest bus transit system and fifth largest para-transit system over a service area of 1,500 square miles containing five million individuals.[133] With a total daily ridership of 1.2 million individuals, 20 percent of which are Federal government employees, the Washington, D.C. area could not operate today without WMATA's vital services.[134] It is no wonder that because of this, some have referred to WMATA as "America's Transit System."[135]
Unfortunately, throughout its history, WMATA has been plagued by issues that have impacted its governance. The unique governance system, necessitated by being the only transit system in the country to serve three separate state level jurisdictions, has created problems. The threat of jurisdictional veto is a constant threat as is the lack of clear delineation of responsibility between the General Manager and the WMATA Board. Although WMATA has suffered from accidents throughout its history, the responses to the most recent fatal accident in January 2015 have caused some to question WMATA's ability to provide a safe service. Funding woes has caused maintenance issues, most notably the continued presence of out of service escalators and elevators throughout the system. Finally, WMATA's many duties, including providing what is in essence commuter services for outer jurisdictions, subway services for DC and the inner suburbs and local bus services for DC, have caused problems as WMATA has to balance each of these competing priorities.
2015 has so far appeared to be the year when all of these issues have come to the forefront. Since the retirement of Richard Sarles as WMATA General Manager this past January, WMATA has been without a permanent General Manager until early November. This delay has been attributed to infighting and disagreement among WMATA Board members and the three jurisdictions on what qualities the new General Manager should have. The fatal accident at L'Efant Plaza Metrorail station made passengers, elected officials and the Federal government question the safety of the Metrorail system. This has led to the Metrorail system being placed under federal oversight for safety since October, 2015. Finally, throughout the year, ridership on the system has been declining, hurting WMATA greatly.[136]
Policy Issues
[edit | edit source]Multi-Jurisdictional Issues
[edit | edit source]WMATA is the only heavy rail mass transit system in the nation that serves three, distinct state level entities.[137] WMATA's governance structure and the problems that it faces today are very much a reflection of this unique and special characteristic and go back to the founding of WMATA. During the early planning stages of Metrorail, DC, Maryland and Virginia feared that if they did not work out a multi-jurisdictional compact to plan and operate the proposed Metrorail system for themselves, the Federal government would do it for them, without their input.[138] Although they came together, disagreements and arguments between the states and localities continue to cause problems for WMATA. Several times in its history, one locality or state has threatened to withhold or withdraw funding for WMATA until their specific grievances are met.[139] The WMATA Compact contains the jurisdictional veto requiring that all Board of Directors decisions be passed by a majority of the members and include at least one member from each jurisdiction.[140] The only exceptions are when the Board is adopting a finance plan or is adopting or amending the mass transit plan.[141] The best recent example of this inter-jurisdictional tendency to disagree would be the arguments made between the Governors of Virginia and Maryland and the Mayor of the District of Columbia on what skill set the new WMATA General Manager should have following the retirement of former General Manager Richard Sarles in January 2015.[142] After months of debate, discussion and the sudden withdraw of the WMATA Board's first choice, Paul J. Weidefeld, former head of the Maryland Transit Administration and Baltimore-Washington International Airport, was selected as WMATA's new GM on November 5, 2015.[143]
It is not clear how multi-jurisdictional issues could be addressed due to the geographic nature of the region. There are two potential options that may alleviate some of the problem. In their recent report, Report on Governance of the Washington Metropolitan Area Transit Authority, the WMATA Riders' Advisory Council (RAC) states their belief that these issues could be alleviated if the Board of Directors started to operate more as a legislature with more transparency and public officials on it that would represent the interests of the system's riders.[144] In contrast, Cadwalader, Wickersham & Taft, LLP in their report to the WMATA Board, Recommendations to the WMATA Board Concerning Governance and the Code of Ethics, state that while the RAC's proposal is one option, another option is to take the opposite track and "take steps to free its Board Members from jurisdictional conflict by reducing their direct accountability to their appointing jurisdiction."[145] Instead of being like a legislature, the Board under this proposal would act more like a regional body and function in a way similar to a corporate board.[146] While the two proposals do offer potential for how to reduce the inter-jurisdictional conflicts that cause headaches for the WMATA Board, they will never be fully removed as long as the current situation of having two states and one special district sharing the Capital region exists.
Structural Issues of WMATA's Transit System
[edit | edit source]WMATA officially provides three vital services to the Washington D.C. metropolitan area. These are Metrorail, Metrobus and Metroacces, a para-transit service. However, it could be argued that WMATA really provides four services as the Metrorail system is in some ways a hybrid commuter rail/subway system. Inside DC and the inner suburbs, the Metrorail system runs underground through tunnels between stations that are located near each other. In the outer suburbs of Fairfax, Montgomery and Prince George's counties, the Metrorail runs at grade or in elevated structures in a manner similar to traditional commuter rail services like those provided by the Virginia Railway Express and Maryland Area Regional Commuter trains.[147] The Metrobus service also shows a similar hybrid nature with multiple local services inside DC with longer distance commuter services spreading into the surrounding counties.[148] Therefore, it is best to think of WMATA has providing limited commuter rail service, subway service, commuter bus service and local bus service.
Prioritizing which of these services is most important has always been a problem for WMATA. Traditionally, the outer suburbs view WMATA's commuter oriented rail and bus services as the most important, while the inner suburbs and DC have wanted WMATA to prioritize the more traditional subway services. Finally, Metrobus is the primary provider of local bus services for DC. Until 2005 when the DC Circulator service was inaugurated, it was the only provider of local bus service for DC. Consequently, DC places a higher priority on the local bus services provided by WMATA than the other jurisdictions as shown by them paying the highest share of the WMATA operating subsidy.
WMATA has tried to balance all of these competing service priorities with mixed success. To better understand how this situation could be improved, it is necessary to look at other transit providers that are either similar to WMATA and/or provide a similar range of services. The Bay Area Rapid Transit (BART) rail system have been called Metrorail's cousins since they were conceived and built at roughly the same time and employed the same hybrid commuter rail/subway system as Metrorail.[149] In the case of BART, only rail service is provided.[150] Local and commuter bus and transit services are provided by the individual localities located within the BART service areas.[151] In this way, BART operates in a manner similar to how WMATA was initially planning to operate. Two other transit agencies that provider commuter rail, subway, commuter bus and local bus/transit services are the Massachusetts Bay Transportation Authority (MBTA)[152] and Southeastern Pennsylvania Transportation Authority (SEPTA).[153] While both systems provide services similar to WMATA and do extend into neighboring states such as Rhode Island, New Hampshire, Delaware and New Jersey, these states play either a limited or no role in the governance of the authorities. In the case of the MBTA, all MBTA Board of Directors members are appointed by the Governor of Massachusetts,[154] and all Board of Directors members at SEPTA come from localities located within the Commonwealth of Pennsylvania.[155]
While reforming the WMATA governance structure to make it similar to the governance structures of both the SEPTA and the MBTA would make the coordination and prioritization of providing conflicting services a simpler endeavor than it currently is, the reality is that such an action is impossible as it would require either DC, Maryland, Virginia or the Federal government to surrender its powers to one of the partners. Abandoning the provision of commuter and local bus services, while feasible, would leave DC and Prince George's county in a lurch, as they depend heavily on these services for their local populations. These two localities between them have two voting members and three alternate members on the WMATA Board and the DC WMATA Board members would certainly use their jurisdictional veto to block any such moves as described above.
Funding Issues
[edit | edit source]Since its birth, WMATA has always depended on government support to provide its services to the people of the Washington Metro region. Table 1, presented below, shows the total amount of funding received by WMATA in fiscal year 2015, the funding sources, the percentage of funding received from these sources and how much and what percentage was spend on operational and capital expenses.[156]
| Source of Funding | Amount ($Million) | Amount (Percentage) | Operational/Capital Spending Split (Amount) | Operational/Capital Spending Split (Percentage) |
|---|---|---|---|---|
| All Sources | $3,243.8 | 100% | N/A | N/A |
| Federal Funding | $471.9 | 16% | $0/$471.9 | 0%/100% |
| Local and State Funding | $1.157 | 40.7% | $778.1/$379.7 | 67%/33% |
| All Other Revenues | $1614.9 | 43.3% | N/A | N/A |
As per the WMATA Compact, each locality served by WMATA is required to pay a portion of the operating subsidy, of which totaled $778.1 million in fiscal year 2015, annually. The distribution among the eight localities is presented below in table 2.[157]
| Locality | Percentage of Operating Subsidy Paid by Locality |
|---|---|
| District of Columbia | 37.4% |
| Prince George's County | 21.4% |
| Montgomery County | 16.7% |
| Fairfax County | 13.4% |
| Arlington County | 6.7% |
| City of Alexandria | 6.7% |
| City of Falls Church | 0.3% |
| City of Fairfax | 0.2% |
Each state has a designated entity which will make the payments to WMATA for the localities. For Maryland, the WSTC makes the full payments for Montgomery and Prince Georges Counties and receives its funding from appropriations from the Maryland Transportation Trust Fund (MDTTF),[158] the depository for the Maryland state gas tax, as well as other vehicle taxes and fees.[159] For Virginia, the NVTC is the entity responsible for making payments on behalf of the Northern Virginia localities to WMATA. Two-thirds of the localities WMATA payments are paid by the NVTC directly and comes from a two percent retail tax collected on gasoline in the NVTC localities as well as other transit funding given to the NVTC by the Commonwealth.[160] Statute requires that monies collected from the two percent gas tax must be used by the NVTC to pay for the two-thirds share of WMATA funding paid by Northern Virginia localities by the NVTC and cannot be used for other purposes.[161] The remaining one-third of the Northern Virginian localities share must be paid by the localities themselves to WMATA through the NVTA. The District of Columbia Department of Transportation is the entity responsible for making the operations subsidy payment to WMATA for DC.[162] The payments are made every quarter and the operations subsidy is paid for by DC general fund revenues, which include such sources as the gas tax, parking meter fees, traffic fines, car fees, restaurant taxes and hotel taxes.[163]
Despite all of these sources of funding, it is important to note that, with the exception of the 2 percent gas tax that is collected in Northern Virginia, none of the operating subsidy that is paid to WMATA from the localities are from dedicated sources.[164][165] The result is that each year there is no guarantee for WMATA that the localities will pay their share of the operating subsidy. In 2009 the Federal government tried to change this with the most recent amendment to the WMATA Compact.[166] The amendment inserted sections d(1) and d(2) to clause 18 and was brought about when in 2008, Congress authorized $1.5 billion to be given to WMATA over the next decade for capital improvements.[167] The localities were required to match this new Federal funding and the 2009 amendments required that any local matching funds come from "a dedicated funding source."[168]
The localities have responded to this in different ways. The Maryland localities have stated that their share already comes from a dedicated funding source, the MDTTF.[169] Virginia gave instructions to their localities stating that the remaining one-third that they are responsible for should come from local sources that are not subject to appropriations.[170] DC stated that they would use sources that are "earmarked or required under the law of the signatory [DC] to be used to match such federal appropriations."[171] This was deemed satisfactory and the first $150 million payment was made to WMATA from the Federal government in 2010.[172]
Despite this advance the majority of funding that WMATA receives from all levels of government comes from non-dedicated sources. While WMATA was authorized to receive $1.5 billion over 10 years in 2008, each payment of $150 million must be appropriated annually. The MDTTF is also subject to annual appropriations as it is the funding source for transportation projects throughout the state.[173] Finally, sections d(1) and d(2) only apply to those funds authorized under that law[174] and does not apply to other funds provided by the localities. The funding source that is the closest to a dedicated funding source, the two percent gas tax in Northern Virginia, is too small to make a difference. In 2005, it was estimated that this tax paid for only 13.2% of the Northern Virginia localities share of the operating subsidy.[175]
This lack of a dedicated funding source for WMATA does impact how the organization is governed. Without certainty that future funding it is difficult for leadership to plan for the future and manage a large and complicated organization. WMATA has done a good job with fare box recovery, recovering about 53.9% of their total costs[176] through fare revenues alone, it is not enough for fund an organization whose budget in 2003 was roughly the size of the budget for the State of Wyoming.[177] Between 2003 and the end of fiscal year 2015, the budget has since more than doubled, from $1.23 billion to $2.84 billion.[178] While funding may not be the primary cause of the current governance issues facing WMATA, it does appear to exacerbate them and therefore should be considered when discussing how to solve WMATA's governance issues.
WMATA Board Procedures and Bylaws Issues
[edit | edit source]In addition to the WMATA Compact, the WMATA Board is governed by procedures and bylaws that they themselves have the power to make and amend as they please.[179] As of July 24, 2014, the Bylaws of the Washington Metropolitan Area Transit Area Board of Directors (WMATA Board Bylaws) contained 17 articles and 27 sub-articles.[180] As of February 26, 2015, the Procedures of the Washington Metropolitan Area Transit Authority Board of Directors (WMATA Board Procedures) contained 10 articles and 16 sub-articles.[181] Both the WMATA Board Bylaws and the WMATA Board Procedures can be amended by the WMATA Board by a majority vote and without legislative action from DC, Maryland, Virginia and Congress.[182][183]
In their 2011 report, the Government Accountability Office criticized the WMATA Board for their policies and procedures and a lack of permanent and amendable bylaws.[184] In response to these criticism, the then chair of the WMATA Board, Catherine Hudgins, sent a letter to David Wise at the GAO and dated for June 24, 2011. The letter was later included in the final GAO report.[185] The letter highlighted the changes that had been made by the WMATA Board since November 2010 and the schedule for pending changes to the WMATA Board Procedures and draft WMATA Board Bylaws.[186] A comparison between the latest versions of the WMATA Board Procedures and Bylaws shows that of the 17 changes outlined in the letter, 12 have been adopted since 2011. While the changing of the WMATA Board Procedures and Bylaws may be able to help WMATA with its governance issues, it appears that it can only do so on the perimeter of the issues due to their subordination to the WMATA Compact.
WMATA Compact Issues
[edit | edit source]The Washington Metropolitan Area Transit Authority Compact (WMATA Compact) is the founding document for WMATA and outlines the roles, responsibilities and powers of the major actors. However, the language in the Compact is unclear and has over the years caused confusion over which responsibilities belong to whom with most confusion being the division of responsibilities between the WMATA Board of Directors (WMATA Board) and the General Manager (GM). The WMATA Compact states that the "General Manager shall be the chief administrative officer of the Authority and, subject to policy direction of the Board, shall be responsible for all activities of the Authority."[187] Beyond this single clause, the Compact does not discuss the role and responsibility of the General Manager in great detail. As it currently stands the WMATA Compact includes the phrase "the Board" over 150 times, while the phrase "General Manager" is included less than 10 times. The WMATA Compact gives the Board of Directors many powers including appointing and dismissing the General Manager at the Board's pleasure,[188] developing and adopting a long range transit plan,[189] capital budgets,[190] current expense budgets,[191] authorizing bond sales,[192] labor policies[193] and, most importantly, the setting of fares and rates as well as service routes.[194] This last power is "subject to the sole and exclusive jurisdiction of the Board."[195]
The document itself has not changed much since it went into effect in 1967 when it went into effect for the construction and operation of the future Metrorail system.[196] In 1973, WMATA took over the privately provided local bus services in the region and began to operate Metrobus, a task it was not originally planned for.[197] This was a major expansion of WMATA's responsibilities, but no changes on how the authority would be governed were made. The only major change to WMATA's governance structure came in 2009, when two voting and alternate members were added to the WMATA Board representing the Federal government.[198]
Why the WMATA Compact was written as it was requires an understanding how it got enacted in the 1960s. During the preliminary planning for what would become Metrorail, there was debate over if the system should be planned, built and funded by a multi-jurisdictional authority or by a Federal authority. One group, the Joint Transportation Commission (JTC), supported the multi-jurisdictional approach and another, the National Capital Transit Agency (NCTA), supported the Federal approach.[199] Both were competing against each other to ensure that their vision would become the reality. The JTC won the competition, but in order to get the compact quickly approved by Maryland, DC (at the time controlled by Congress) and Virginia, the WMATA Compact had to be as inoffensive and uncontroversial as possible.[200] The result was that the Compact was heavily based off a previous regulatory compact, the Washington Metropolitan Area Transit Commission (WMATC), which was established in 1961 to regulate the private local bus companies in the region.[201] The compacts for two other multi-state authorities, the Port Authority of New York and New Jersey and the Port Authority of the Delaware River Basin, were also used as a basis.[202] The results of this rushed process survive with us to this day.
In the aftermath of the 2009 Red Line Crash five reports were released between 2010 and 2012 that investigated WMATA's governance, its problems, and possible solutions. While the reports differed in their conclusions, some commonality emerged on the impact of the WMATA Compact has on the current governance issues plaguing WMATA. Two[203] reports[204] found that the ambiguity and vagueness of the Compact had resulted in a lack of a clear delineation of the responsibilities of the WMATA Board and the General Manager. Another report analyzed the WMATA Compact and how it set up WMATA's governance and stated that it resembled more a regulated utility board than a corporate board, with major limitations on the actions of the General Manager when it came specifically to route selection and rate setting.[205] The Riders Advisory Council's (RAC) report found that although the General Manager is usually referred to as the CEO of WMATA, the Compact makes no mention of this and that it should be corrected.[206] The alternate board members established by the Compact came under scrutiny as well, with one report finding that no other transit agency or authority having similar positions.[207] They were also confused by these positions as they are allowed to vote in Board committees and subcommittees, but not allowed to vote at Board meetings, unless their designated voting member is absent.[208] The same report took issue with the current procedure for how Board members are appointed to the Board of Directors. Currently each jurisdiction has discretion on how their specified appointing body will select their WMATA Board Members with no coordination or communication on how each jurisdiction selects their appointed members. This results in a Board that is uneven in the necessary knowledge and experience of overseeing a large transit provider.[209] Finally, the jurisdictional veto included in the Compact was found by one report to be unique to WMATA.[210]
It appears likely that a good part of WMATA's governance troubles do stem from the WMATA Compact. Unfortunately, in order to overcome these issues, it would be necessary to amend the WMATA Compact itself as it have been done nine times before.[211] The reason for this is because in order to amend the WMATA Compact, the amendments must be approved by all three jurisdictions before being consented to by Congress.[212] Both the Maryland and Virginia General Assemblies are part-time legislatures and meet only at specific times of the year and for a limited period, thereby limiting the timing window for the amendment process. Additionally, the recent gridlock in Congress makes the obtaining of Congressional consent unlikely at best.
Conclusion and Policy Suggestions
[edit | edit source]After reviewing the evidence presented in this case study, it can be determined that the policy issues discussed above do play a role in the current governance issues plaguing WMATA and its transit system. Some of these policy issues do seem to have either resolved themselves or, due to the underlying issues in them, are impossible to resolve. The issues caused by the WMATA Board Procedures and Bylaws appears to have potentially resolved themselves, though the recentness of the changes made to them means that any long term effect of the changes is unknown at this time. The issues caused by WMATA being a multi-jurisdictional entity, while being a prominent source of WMATA's current troubles, appears to be impossible to resolve at this time due to the underlying geographical nature of the Washington, D.C. metropolitan area. Geography is destiny and therefore in order to provide transit service throughout the entire region, geography ensures that it is WMATA's destiny to be a multi-jurisdictional entity.
Other policy issues discussed in the above sections can be addressed through changes of policy and therefore the following policy actions should be taken by the appropriate authorities to improve and alleviate the governance issues of WMATA. First, the structural issues of WMATA's transit system must be addressed. It is clear that trying to provide all services to all customers while being beholden to multiple masters is untenable and therefore the services provided by WMATA should be streamlined. This would most likely require the transfer of the provision of local bus service from WMATA to the local jurisdictions where it currently provides such services. While this would hurt DC and Prince George's County the most, it will allow WMATA to focus on the task it was created for, the construction, operation and maintenance of a heavy rail system for the Washington, D.C. metropolitan area. In order to bring this about, a committee should be established that would include all stakeholders to determine which routes are appropriate for transfer. Second, a dedicated funding source must be found for WMATA to ensure that the new streamlined services provided by WMATA are sustainable in the long run and that the problems created by lack of funding and delayed maintenance are fixed. One potential dedicated funding source would be for DC and Maryland to create a gas tax that is similar, or ideally identical, to the one that is currently collected in the Northern Virginia localities served by WMATA. Other appropriate sources of a dedicated revenue source includes a regional sales tax.
The third and final policy change that could improve WMATA's governance issue would be the review and reform of the WMATA Compact to make it appropriate for today's environment. The WMATA Compact was based on the experience of the day, namely compacts designed to regulate privately operated transit and commuter bus services and those for port authorities. Unfortunately, while this may have been appropriate for the time, the fact remains that today WMATA is a transit operator and provider, not a transit regulator and is not responsible for port facilities. The intervening decades have seen other regional compacts formed, inspired by the success of WMATA in its first decades. These compacts should be reviewed and used to determine what reforms are necessary to make the WMATA Compact suitable for WMATA's current role. In order to do this, a conference should be held to discuss potential reforms and be attended by high level officials of all stakeholders, specifically the governors/mayors and legislatures/councils of DC, Virginia and Maryland as well as Congressional and Executive branch representatives, along with other interested parties. This conference will allow for all stakeholders to determine what sort of changes and reforms to the WMATA Compact are required. Following this conference a working group made of stakeholder representatives should be established to draft the necessary amendments to the WMATA Compact and guide them through the necessary legislative processes required by the WMATA Compact. This is a long term goal and will not be met for some time meaning that it is vital that the process begin as soon as it is feasible.
Discussion Questions
[edit | edit source]- How much of WMATA's governance issues are a result of WMATA being a multi-jurisdictional entity?
- How much of WMATA's governance issues are a result of WMATA's structural issues in regards to its transit system?
- How much of WMATA's governance issues are a result of WMATA's funding issues?
- How much of WMATA's governance issues are a result of the WMATA Board Procedures and Bylaws?
- How much of WMATA's governance issues are a result of the WMATA Compact?
- What are your opinions on the policy changes suggested in the case study report, the effectiveness of the suggested policy changes and their feasibility?
- What other policy changes could be made to alleviate the governance issues plaguing WMATA?
Additional Readings
[edit | edit source]Moving Metro Forward: Report of the Joint WMATA Governance Review Task Force
References
[edit | edit source]- ↑ a b c d e f g h i j k l m n o p q r Phillip Brown et al., “US Crude Oil Export Policy: Background and Considerations,” Congressional Research Service 43442 (2014), http://www.pennyhill.com/jmsfileseller/docs/R43442.pdf.
- ↑ a b c d Gallucci, Maria. “Enbridge Oil Spill: Five Years Later, Michigan Residents Struggle to Move On.” International Business Times, July 24, 2015. Accessed October 17, 2015. http://www.ibtimes.com/enbridge-oil-spill-five-years-later-michigan-residents-struggle-move-2022591
- ↑ a b c John Fritelli et al. "U.S. Rail Transportation of Crude Oil: Background and Issues for Congress." Congressional Research Services 43390 (December 4, 2014). https://www.fas.org/sgp/crs/misc/R43390.pdf
- ↑ a b c d [“Oil and Gas Industry Trade Associations,” PetroStrategies, Inc, 2015, http://www.petrostrategies.org/Links/trade_associations.htm.]
- ↑ “About AAR,” Association of American Railroads, 2015, https://www.aar.org.
- ↑ “About AOPL,” Association of Oil Pipe Lines, 2015, http://www.aopl.org/about-aopl/.
- ↑ awo manager, “About AWO,” Text, The American Waterways Operators, (July 16, 2013), http://www.americanwaterways.com/about.
- ↑ “About Waterways Council, Inc,” Waterways Council, Inc, accessed October 19, 2015, http://waterwayscouncil.org/about-us/.
- ↑ a b “Exxon Valdez Oil Spill.” NOAA Office of Response and Restoration. Accessed October 17, 2015. http://response.restoration.noaa.gov/oil-and-chemical-spills/significant-incidents/exxon-valdez-oil-spill
- ↑ a b Parfomack, Paul W. "Keeping America’s Pipelines Safe and Secure: Key Issues for Congress." Congressional Research Services 41536 (9 January 2013). https://www.fas.org/sgp/crs/homesec/R41536.pdf
- ↑ a b c d e f John Frittelli, “Shipping U.S. Crude Oil by Water: Vessel Flag Requirements and Safety Issues,” Congressional Research Service 43653 (2014), https://www.fas.org/sgp/crs/misc/R43653.pdf.
- ↑ a b “ExxonMobil to Pay $5 Million to Settle U.S. and Arkansas Claims for Mayflower Oil Spill.” United States Department of Justice News Service, April 22, 2015. Accessed October 17, 2015 http://www.justice.gov/opa/pr/exxonmobil-pay-5-million-settle-us-and-arkansas-claims-2013-mayflower-oil-spill
- ↑ a b Ahlers, Mike M. “Report: 18 Errors Lined Up to Cause Quebec Rail Catastrophe.” CNN, August 19, 2014. Accessed October 17, 2015. http://www.cnn.com/2014/08/19/world/americas/canada-rail-disaster-report/
- ↑ Michael McCaul, “H.R.4349 - 113th Congress (2013-2014): Crude Oil Export Act,” legislation, (June 10, 2014), https://www.congress.gov/bill/113th-congress/house-bill/4349/all-info.
- ↑ Jim Bridenstine, “H.R.4286 - 113th Congress (2013-2014): American Energy Renaissance Act of 2014,” legislation, (April 16, 2014), https://www.congress.gov/bill/113th-congress/house-bill/4286?q=%7B%22search%22%3A%5B%22%5C%22crude+oil%5C%22+export%22%5D%7D&resultIndex=32.
- ↑ Ted Cruz, “S.2170 - 113th Congress (2013-2014): American Energy Renaissance Act of 2014,” legislation, (March 27, 2014), https://www.congress.gov/bill/113th-congress/senate-bill/2170/all-info?resultIndex=35#major-actions..
- ↑ Joe Barton, “H.R.5814 - 113th Congress (2013-2014): To Adapt to Changing Crude Oil Market Conditions.,” legislation, (December 12, 2014), https://www.congress.gov/bill/113th-congress/house-bill/5814/all-info?resultIndex=46#major-actions.
- ↑ Michael McCaul, “H.R.156 - 114th Congress (2015-2016): Crude Oil Export Act,” legislation, (March 2, 2015), https://www.congress.gov/bill/114th-congress/house-bill/156/all-info.
- ↑ Joe Barton, “H.R.666 - 114th Congress (2015-2016): To Adapt to Changing Crude Oil Market Conditions.,” legislation, (February 6, 2015), https://www.congress.gov/bill/114th-congress/house-bill/666/all-info?resultIndex=55#major-actions.
- ↑ a b [Joe Barton, “H.R.702 - 114th Congress (2015-2016): To Adapt to Changing Crude Oil Market Conditions.,” legislation, (October 9, 2015), https://www.congress.gov/bill/114th-congress/house-bill/702/all-info?resultIndex=56#major-actions.]
- ↑ Jim Bridenstine, “H.R.1487 - 114th Congress (2015-2016): American Energy Renaissance Act of 2015,” legislation, (April 8, 2015), https://www.congress.gov/bill/114th-congress/house-bill/1487/all-info?resultIndex=61#major-actions.
- ↑ Ted Cruz, “S.791 - 114th Congress (2015-2016): American Energy Renaissance Act of 2015,” legislation, (March 18, 2015), https://www.congress.gov/bill/114th-congress/senate-bill/791/all-info?resultIndex=60#major-actions.
- ↑ K. Conaway, “H.R.2369 - 114th Congress (2015-2016): Energy Supply and Distribution Act of 2015,” legislation, (June 10, 2015), https://www.congress.gov/bill/114th-congress/house-bill/2369/all-info?resultIndex=75#major-actions.
- ↑ Lisa Murkowski, “S.1312 - 114th Congress (2015-2016): Energy Supply and Distribution Act of 2015,” legislation, (June 9, 2015), https://www.congress.gov/bill/114th-congress/senate-bill/1312/all-info?resultIndex=73#major-actions.
- ↑ Trisha Curtis et al., “Pipelines, Trains, and Trucks: Moving Rising North American Oil Production to Market” (Energy Policy Research Foundation, Inc, 2013), http://eprinc.org/wp-content/uploads/2013/10/EPRINC-PIPELINES-TRAINS-TRUCKS-OCT31.pdf.
- ↑ a b c “Crude Oils Have Different Quality Characteristics,” U.S. Energy Information Administration, July 12, 2012, http://www.eia.gov/todayinenergy/detail.cfm?id=7110.
- ↑ “Light Crude Oil,” Petroleum.co.uk, 2015, http://www.petroleum.co.uk/light-oil
- ↑ “Sweet vs. Sour Crude Oil,” Petroleum.co.uk, 2015, http://www.petroleum.co.uk/sweet-vs-sour.
- ↑ “Technical Options for Processing Additional Light Tight Oil Volumes within the United States” (U.S. Energy Information Administration, 2015), http://www.eia.gov/analysis/studies/petroleum/lto/pdf/lightightoil.pdf.
- ↑ “OSHA Technical Manual, Section IV: Chapter 2 - Petroleum Refining Process,” Occupational Safety & Health Administration, accessed October 16, 2015, https://www.osha.gov/dts/osta/otm/otm_iv/otm_iv_2.html.
- ↑ “The U.S. Petroleum Industry: Statistics, Definitions,” NACS - The Association for Convenience & Fuel Retailing, 2015, http://www.nacsonline.com/yourbusiness/fuelsreports/gasprices_2013/pages/statistics-and-definitions.aspx
- ↑ David Sheppard and Bruce Nichols, “Insight: Oil Convoy Blues: Trucking Game Foils Crude Traders,” Reuters, October 14, 2011, http://www.reuters.com/article/2011/10/14/us-cushing-trucks-idUSTRE79D0OP20111014.
- ↑ Ford Shale, “Trains Carry the Load of US Crude Surge as Pipeline Growth Lags,” Southwest Economy, 2013, 8–10.
- ↑ a b c d "Electronic Code of Federal Regulations." U.S. Government Publishing Office, Accessed October 20, 2015.
- ↑ a b c d e f Conca, James. “Pick Your Poison For Crude -- Pipeline, Rail, Truck Or Boat.” Forbes 26 April 2014. http://www.forbes.com/sites/jamesconca/2014/04/26/pick-your-poison-for-crude-pipeline-rail-truck-or-boat/
- ↑ a b Ebinger, Charles, and Heather L. Greenley. "Changing Markets: Economic Opportunities from Lifting the U.S. Ban on Crude Oil Exports." The Brookings Institution 14-02 (September 2014): 25-36. http://www.brookings.edu/~/media/research/files/reports/2014/09/09%208%20facts%20about%20crude%20oil%20production/crude%20oil%20exports%20web.pdf
- ↑ Bordoff, Jason and Trevor Houser. “Navigating the U.S. Oil Export Debate.” Columbia University Center on Global Energy Policy, 2015. 55-57. http://energypolicy.columbia.edu/sites/default/files/energy/Navigating%20the%20US%20Oil%20Export%20Debate_January%202015.pdf
- ↑ a b "Lifting the Crude Oil Export Ban: Explainer II: Domestic Impacts of Lifting the Export Ban." Bipartisan Policy Center, September 2015. http://bipartisanpolicy.org/wp-content/uploads/2015/09/BPC-Energy-Crude-Oil-Export-Ban-Domestic-Impacts.pdf
- ↑ Brown, Stephen P.A., et al. "Crude Behavior: How Lifting the Export Ban Reduces Gasoline Prices in the United States." Resources for the Future,14-03 (February 2014). http://www.rff.org/files/sharepoint/WorkImages/Download/RFF-IB-14-03-REV.pdf
- ↑ Livingston, Abby. “Texans in Congress Aim to Abolish Crude Oil Export Ban.” The Texas Tribune, May 7, 2015. Accessed October 5, 2015. http://www.texastribune.org/2015/05/07/texans-congress-aim-abolish-crude-oil-export-ban/
- ↑ “About Us.” International Energy Agency. Accessed October 17, 2015. http://www.iea.org/aboutus/
- ↑ Barron-Lopez, Laura. “Boehner Backs Lifting Crude Oil Export Ban.” The Huffington Post, July 29, 2015. Accessed October 5, 2015. http://www.huffingtonpost.com/entry/boehner-backs-lifting-crude-oil-export-ban_55b92578e4b0a13f9d1b50a2
- ↑ Washington Metropolitan Area Transit Authority, Fiscal Year 2016 Proposed Budget, December 4, 2014 (Washington, D.C.:WMATA, 2014), 1-2.
- ↑ Ibid.
- ↑ Robert Puentes, Washington's Metro: Deficits by Design (Washington, D.C.: The Brookings Institute, June 2004), 1.
- ↑ Ibid.
- ↑ United States General Accountability Office, Public Transportation: Washington Metro Could Benefit from Clarified Board Roles and Responsibilities, Improved Strategic Planning (Washington, D.C., GAO, June 2011), 1-63.
- ↑ WMATA, FY 2016 Proposed Budget, I-3,I-4.
- ↑ Ibid., I-5.
- ↑ Ibid., I-5,I-6.
- ↑ Washington Metropolitan Area Transit Authority, Washington Metropolitan Area Transit Authority Compact: As Amended August 2009 (Washington, D.C.: WMATA, 2009), Article III, Clause 3.
- ↑ WMATA, FY 2016 Proposed Budget, I-2.
- ↑ WMATA, WMATA Compact, Article III, Clause 5(a).
- ↑ Ibid.,
- ↑ Ibid., Article III, Clause 7.
- ↑ Ibid., Article III, Clause 6.
- ↑ Ibid,, Article III, Clause 9(a).
- ↑ Ibid.
- ↑ John W. Fischer and William J. Mallet, Washington Metropolitan Area Transit Authority (WMATA): Issues and Options for Congress (Washington, D.C.: Congressional Research Service, August 14, 2010), 7.
- ↑ WMATA, Board of Directors, http://www.wmata.com/about_metro/board_of_directors/.
- ↑ WMATA, WMATA Compact, Article III, Clause 9(b).
- ↑ Ibid., Article III, Clause 9(a).
- ↑ Fischer and Mallett, WMATA: Issues and Options for Congress, 7.
- ↑ WMATA, FY 2016 Proposed Budget, I-2.
- ↑ WMATA, FY 2016 Proposed Budget, III-36 - III-73.
- ↑ WMATA, FY 2016 Proposed Budget, III-27.
- ↑ WMATA, WMATA Compact, Article III, Clause 5(a).
- ↑ WMATA Governance Review Task Force, Moving Metro Forward: Report of the Joint WMATA Governance Review Task Force (Washington, D.C. Metropolitan Washington Council of Governments and the Greater Washington Board of Trade, November 17, 2010), 10.
- ↑ GAO, Washington Metro Could Benefit from Clarified Board Roles and Responsibilities, Improved Strategic Planning, 7.
- ↑ WMATA, WMATA Compact, Article VII, Clause 18(b).
- ↑ Amalgamated Transit Union Local 689, Issues Relating to Funding for the Washington Metropolitan Area Transit Authority (Washington, D.C.: Amalgamated Transit Union, April 2009), 4.
- ↑ WMATA, WMATA Compact, Article XVI, Clause 84.
- ↑ Ibid., Article III, Clause 5(a).
- ↑ WMATA Governance Review Task Force, Moving Metro Forward, 10.
- ↑ Commonwealth of Virginia, Code of Virginia, Section 33.2 (Richmond: Commonwealth of Virginia, 2015), Article 1904(B).
- ↑ Ibid.
- ↑ Ibid.
- ↑ GAO, Washington Metro Could Benefit from Clarified Board Roles and Responsibilities, Improved Strategic Planning, 7
- ↑ WMATA, WMATA Compact, Article VII, Clause 18(a).
- ↑ ATU Local 689, Issues Relating to Funding for the Washington Metropolitan Area Transit Authority, 4.
- ↑ Ibid.
- ↑ WMATA, WMATA Compact, Article XVI, Clause 84.
- ↑ Puentes, Deficits by Design, 10.
- ↑ ATU Local 689, Issues Relating to Funding for the Washington Metropolitan Area Transit Authority, 2.
- ↑ Puentes, Deficits by Design, 3.
- ↑ Ibid., 10.
- ↑ Ibid.
- ↑ Ibid.
- ↑ Ibid.
- ↑ WMATA, WMATA Compact, Article III, Clause 5(a).
- ↑ GAO, Washington Metro Could Benefit from Clarified Board Roles and Responsibilities, Improved Strategic Planning, 7.
- ↑ Ibid.
- ↑ Ibid.
- ↑ ATU Local 689, Issues Relating to Funding for the Washington Metropolitan Area Transit Authority, 4.
- ↑ Ibid., 5.
- ↑ Ibid.
- ↑ WMATA, WMATA Compact, Article XVI, Clause 85.
- ↑ ATU Local 689, Issues Relating to Funding for the Washington Metropolitan Area Transit Authority, 5.
- ↑ GAO, Washington Metro Could Benefit from Clarified Board Roles and Responsibilities, Improved Strategic Planning, 7.
- ↑ GAO, Washington Metro Could Benefit from Clarified Board Roles and Responsibilities, Improved Strategic Planning, 7.
- ↑ United States General Accountability Office, Rail Transit: Additional Federal Leadership Would Enhance FTA's State Safety Oversight Program (Washington, D.C., GAO, July 2006), 5.
- ↑ Lori Aratani and Paul Duggan, "Federal Officials Will Assume Responsibility for Federal Oversight," Washington Post, October 9, 2015, https://www.washingtonpost.com/local/trafficandcommuting/federal-officials-will-assume-responsibility-for-metro-safety/2015/10/09/8fe4cae6-6eca-11e5-aa5b-f78a98956699_story.html
- ↑ Zachary M. Schrag, The Great Society Subway: A History of the Washington Metro (Baltimore: The Johns Hopkins University Press, 2006), 103.
- ↑ WMATA, FY 2016 Proposed Budget, I-2.
- ↑ Schrag, The Great Society Subway, 176.
- ↑ Ibid., 185.
- ↑ Ibid., 245.
- ↑ WMATA, FY 2016 Proposed Budget, I-2.
- ↑ Schrag, The Great Society Subway, 247.
- ↑ National Transportation Safety Board, Safety Recommendation, September 30, 2015 (Washington, D.C.: NTSB, 2015), 3.
- ↑ Schrag, The Great Society Subway, 249.
- ↑ Schrag, The Great Society Subway, 245.
- ↑ WMATA, FY 2016 Proposed Budget, I-2.
- ↑ Steven Ginsburg and Lindsey Layton, "20 Injured in Crash of 2 Red Line Trains," Washigton Post, November 4, 2004, Sec. A.
- ↑ WMATA, FY 2016 Proposed Budget, I-2.
- ↑ NTSB, Safety Recommendation, 2.
- ↑ Washington Metropolitan Area Transit Authority, Commendation for General Manager/Chief Executive Officer Richard Sarles, January 8, 2015 (Washington D.C.: WMATA, 2015), 1.
- ↑ Ibid.
- ↑ WMATA, FY 2016 Proposed Budget, I-2.
- ↑ Jay Korff and Jennifer Van Der Kluet, "Metro Chief Richard Sarles Makes Surprise Announcement: He'll Retire in 2015," WJLA Washington, D.C., September 24, 2014. http://wjla.com/news/local/wmata-s-ceo-and-gm-richard-sarles-announces-retirement-107472
- ↑ NTSB, Safety Recommendation, 1.
- ↑ WMATA, Commendation for General Manager/Chief Executive Officer Richard Sarles, 1.
- ↑ Martin Di Caro, "Why Has the Hiring of a New Metro GM Taken More Than a Year?," WAMU 88.5, October 28, 2015, https://wamu.org/news/15/10/28/how_the_hiring_of_a_new_metro_gm_was_delayed_most_of_2015
- ↑ Aratani and Duggan, "Federal Officials Will Assume Responsibility for Federal Oversight," Washington Post, October 9, 2015.
- ↑ Adam Tuss, "Metro Picks New General Manager: Aerospace Executive Neal Cohen," NBC 4 Washington, October 28, 2015, http://www.nbcwashington.com/news/local/Metro-Picks-New-General-Manager-Neal-Cohen-338106682.html
- ↑ Brianne Carter and John Gonzalez, "WMATA General Manager Position Still Open," WJLA Washington, DC, November 2, 2015, http://wjla.com/news/local/metro-names-a-new-general-manager.
- ↑ Paul Duggan, "Metro Names ex-BWI Chief as its new GM,"Sec. B.
- ↑ WMATA, FY 2016 Proposed Budget, I-2.
- ↑ Ibid.
- ↑ Ibid.
- ↑ Ibid.
- ↑ Ibid.
- ↑ Ibid.
- ↑ Ibid., I-2,I-3.
- ↑ Ibid., I-3.
- ↑ Benjamin Freed, "Metro’s Ridership Is Still Falling, and Fare Hikes Might Be the Only Way to Keep Its Revenue Up", Washingtonian Magazine, October 5, 2015, http://www.washingtonian.com/blogs/capitalcomment/transportation/metros-ridership-is-still-falling-and-fare-hikes-might-be-the-only-way-to-keep-its-revenue-up.php
- ↑ GAO, Rail Transit: Additional Federal Leadership Would Enhance FTA's State Safety Oversight Program,40.
- ↑ Schrag, The Great Society Subway: A History of the Washington Metro, 93-106.
- ↑ Puentes, Deficits by Design, 2.
- ↑ WMATA, WMATA Compact, Article III, Clause 8(a).
- ↑ Ibid.
- ↑ Paul Duggan, "Metro Names ex-BWI Chief as its new GM," Washington Post November 6, 2015, Sec. B.
- ↑ Ibid.
- ↑ WMATA Riders Advisory Council, Report on Governance of the Washington Metropolitan Area Transit Authority (Washington, D.C.: WMATA, December 1, 2010), 9.
- ↑ Caldwalader, Wickersham & Taft, LLP, Recommendations to the WMATA Board Concerning Governance and the Code of Ethics (Washington, D.C.: Caldwalader, November 9, 2012),5.
- ↑ Ibid.
- ↑ Schrag, The Great Society Subway, 51
- ↑ Ibid., 176-177.
- ↑ Schrag, The Great Society Subway, 1.
- ↑ Bay Area Rapid Transit, Schedules,https://www.bart.gov/schedules/bystation
- ↑ Bay Area Rapid Transit, Transit Connections,https://www.bart.gov/guide/transit
- ↑ Massachusetts Bay Transportation Authority, Schedules and Maps, http://www.mbta.com/schedules_and_maps/system_map/.
- ↑ Southeastern Pennsylvania Transportation Authority, Service, http://www.septa.org/service/.
- ↑ Massachusetts Bay Transportation Authority, MBTA Leadership, http://www.mbta.com/about_the_mbta/leadership/.
- ↑ Southeastern Pennsylvania Transportation Authority, Board Members, http://www4.septa.org/about/board/members.html.
- ↑ WMATA, FY 2016 Proposed Budget, I-14.
- ↑ Ibid.
- ↑ ATU Local 689, Issues Relating to Funding for the Washington Metropolitan Area Transit Authority, 3.
- ↑ Puentes, Deficits by Design, 10.
- ↑ ATU Local 689, Issues Relating to Funding for the Washington Metropolitan Area Transit Authority, 3.
- ↑ Ibid.
- ↑ Ibid.
- ↑ Puentes, Deficits by Design, 10.
- ↑ Fischer and Mallett, WMATA: Issues and Options for Congress,4.
- ↑ Puentes, Deficits by Design, 10.
- ↑ WMATA, WMATA Compact, Note 10.
- ↑ Fischer and Mallett, WMATA: Issues and Options for Congress,4.
- ↑ WMATA, WMATA Compact, Article VII, Clause 18 d(1).
- ↑ ATU Local 689, Issues Relating to Funding for the Washington Metropolitan Area Transit Authority, 4.
- ↑ Ibid.
- ↑ Ibid.
- ↑ Fischer and Mallett, WMATA: Issues and Options for Congress,4.
- ↑ ATU Local 689, Issues Relating to Funding for the Washington Metropolitan Area Transit Authority, 3.
- ↑ WMATA, WMATA Compact, Article VII, Clause 18 d(1), d(2).
- ↑ Puentes, Deficits by Design, 10.
- ↑ WMATA, FY 2016 Proposed Budget, III-4.
- ↑ Puentes, Deficits by Design, 10.
- ↑ WMATA, FY 2016 Proposed Budget, I-15.
- ↑ WMATA, WMATA Compact, Article III, Clause 7.
- ↑ Washington Metropolitan Area Transit Authority, Bylaws of the Washington Metropolitan Area Transit Authority Board of Directors (Washington, D.C.: WMATA, July 24, 2014), 1-16.
- ↑ Washington Metropolitan Area Transit Authority, Procedures of the Washington Metropolitan Area Transit Authority Board of Directors (Washington, D.C.: WMATA, February 26, 2015), 1-8.
- ↑ WMATA, Procedures of the WMATA Board, Article X.
- ↑ WMATA, Bylaws of the WMATA Board, Article XVII.
- ↑ GAO, Washington Metro Could Benefit from Clarified Board Roles and Responsibilities, Improved Strategic Planning, 15-16.
- ↑ GAO, Washington Metro Could Benefit from Clarified Board Roles and Responsibilities, Improved Strategic Planning, 53-61.
- ↑ GAO, Washington Metro Could Benefit from Clarified Board Roles and Responsibilities, Improved Strategic Planning, 57-61.
- ↑ WMATA, WMATA Compact, Article III, Clause 9(b).
- ↑ Ibid., Article III, Clause 9(a).
- ↑ Ibid., Article VI, Clause 13(a).
- ↑ Ibid., Article VIII, Clause 23.
- ↑ Ibid., Article VIII, Clause 24.
- ↑ Ibid., Article IX, Clause 31.
- ↑ Ibid., Article XIV, Clause 64.
- ↑ Ibid., Article XIII, Clause 60.
- ↑ Ibid.
- ↑ Schrag, The Great Society Subway, 176.
- ↑ Ibid.
- ↑ WMATA, WMATA Compact, Note 2.
- ↑ Schrag, The Great Society Subway, 99.
- ↑ Ibid., 101-103.
- ↑ Ibid., 99.
- ↑ Ibid., 100.
- ↑ WMATA Governance Review Task Force, Moving Metro Forward, 21-22.
- ↑ GAO, Washington Metro Could Benefit from Clarified Board Roles and Responsibilities, Improved Strategic Planning, 31.
- ↑ Fischer and Mallett, WMATA: Issues and Options for Congress, 5-6.
- ↑ WMATA RAC, Report on Governance of the Washington Metropolitan Area Transit Authority, 16.
- ↑ WMATA Governance Review Task Force, Moving Metro Forward, 23-25.
- ↑ Ibid.
- ↑ Ibid.
- ↑ GAO, Washington Metro Could Benefit from Clarified Board Roles and Responsibilities, Improved Strategic Planning, 31.
- ↑ WMATA, WMATA Compact, 38.
- ↑ Ibid., Article XV, Clause 84.
Sources
[edit | edit source]Amalgamated Transit Union Local 689. Issues Relating to Funding for the Washington Metropolitan Area Transit Authority, April 2009. Washington, D.C.: Amalgamated Transit Union, 2009.
Aratani, Lori and Paul Duggan, "Federal Officials Will Assume Responsibility for Federal Oversight," Washington Post, October 9, 2015,https://www.washingtonpost.com/local/trafficandcommuting/federal-officials-will-assume-responsibility-for-metro-safety/2015/10/09/8fe4cae6-6eca-11e5-aa5b-f78a98956699_story.html
Bay Area Rapid Transit. Schedules. https://www.bart.gov/schedules/bystation
Caldwalader, Wickersham & Taft, LLP. Recommendations to the WMATA Board Concerning Governance and the Code of Ethics, November 9, 2012. Washington, D.C.: Caldwalader 2012.
Carter, Brianne and John Gonzalez. "WMATA General Manager Position Still Open." WJLA Washington, DC. November 2, 2015. http://wjla.com/news/local/metro-names-a-new-general-manager.
Commonwealth of Virginia. Code of Virginia, Section 33.2. Richmond: Commonwealth of Virginia, 2015.
Di Caro, Martin. "Why Has the Hiring of a New Metro GM Taken More Than a Year?" WAMU 88.5. October 28, 2015. https://wamu.org/news/15/10/28/how_the_hiring_of_a_new_metro_gm_was_delayed_most_of_2015
Duggan, Paul. "Metro Names ex-BWI Chief as its new GM," Washington Post November 6, 2015, Sec. B.
Fischer, John W. and William J. Mallet. Washington Metropolitan Area Transit Authority (WMATA): Issues and Options for Congress, August 14, 2010. Washington, D.C.: Congressional Research Service, 2010.
Freed, Benjamin. "Metro’s Ridership Is Still Falling, and Fare Hikes Might Be the Only Way to Keep Its Revenue Up." Washingtonian Magazine. October 5, 2015. http://www.washingtonian.com/blogs/capitalcomment/transportation/metros-ridership-is-still-falling-and-fare-hikes-might-be-the-only-way-to-keep-its-revenue-up.php
Ginsburg, Steven and Lindsey Layton, "20 Injured in Crash of 2 Red Line Trains." Washigton Post. November 4, 2004, Sec. A.
Korff, Jay and Jennifer Van Der Kluet. "Metro Chief Richard Sarles Makes Surprise Announcement: He'll Retire in 2015." WJLA Washington, D.C.. September 24, 2014. http://wjla.com/news/local/wmata-s-ceo-and-gm-richard-sarles-announces-retirement-107472
Massachusetts Bay Transportation Authority. MBTA Leadership. http://www.mbta.com/about_the_mbta/leadership/.
Massachusetts Bay Transportation Authority. Schedules and Maps. http://www.mbta.com/schedules_and_maps/system_map/.
National Transportation Safety Board. Safety Recommendation, September 30, 2015. Washington, D.C.: NTSB, 2015.
Puentes, Robert. Washington's Metro: Deficits by Design. Washington, D.C.: The Brookings Institute, June 2004.
Schrag, Zachary M. The Great Society Subway: A History of the Washington Metro. Baltimore: The Johns Hopkins University Press, 2006.
Southeastern Pennsylvania Transportation Authority. Board Members. http://www4.septa.org/about/board/members.html.
Southeastern Pennsylvania Transportation Authority. Service. http://www.septa.org/service/.
Tuss, Adam. "Metro Picks New General Manager: Aerospace Executive Neal Cohen." NBC 4 Washington. October 28, 2015. http://www.nbcwashington.com/news/local/Metro-Picks-New-General-Manager-Neal-Cohen-338106682.html
United States General Accountability Office. Public Transportation: Washington Metro Could Benefit from Clarified Board Roles and Responsibilities, Improved Strategic Planning, June 2011. Washington, D.C.:GAO, 2011.
United States General Accountability Office. Rail Transit: Additional Federal Leadership Would Enhance FTA's State Safety Oversight Program, July 2006. Washington, D.C.: GAO, 2006.
Washington Metropolitan Area Transit Authority. Board of Directors. http://www.wmata.com/about_metro/board_of_directors/.
Washington Metropolitan Area Transit Authority. Bylaws of the Washington Metropolitan Area Transit Authority Board of Directors, July 24, 2014. Washington, D.C.: WMATA, 2014.
Washington Metropolitan Area Transit Authority. Commendation for General Manager/Chief Executive Officer Richard Sarles, January 8, 2015. Washington D.C.: WMATA, 2015.
Washington Metropolitan Area Transit Authority. Fiscal Year 2016 Proposed Budget, December 4, 2014. Washington, D.C.:WMATA, 2014.
Washington Metropolitan Area Transit Authority. Procedures of the Washington Metropolitan Area Transit Authority Board of Directors, February 26, 2015. Washington, D.C.: WMATA, 2015.
Washington Metropolitan Area Transit Authority. Washington Metropolitan Area Transit Authority Compact: As Amended August 2009. Washington, D.C.: WMATA, 2009.
WMATA Governance Review Task Force. Moving Metro Forward: Report of the Joint WMATA Governance Review Task Force, November 17, 2010. Washington, D.C.: Metropolitan Washington Council of Governments and the Greater Washington Board of Trade, 2010.
WMATA Riders Advisory Council. Report on Governance of the Washington Metropolitan Area Transit Authority, December 1, 2010. Washington, D.C.: WMATA, 2010.
Endnotes
[edit | edit source]
Integrating drones into civil aviation
Summary
[edit | edit source]The first recorded use of an unmanned aerial system occurred in 1849 when the Austrian Empire utilized explosive laden balloons to terrorize revolutionaries in besieged Venice. However, it wasn’t until World War II that unmanned aerial systems saw routine use as remotely operated target drones.[1] Technological developments created a new generation of unmanned airborne systems operating as armed and/or surveillance platforms during recent wars in Iraq and Afghanistan. Improvements in electronics, miniaturization and composite materials enabled smaller, lighter and inexpensive unmanned aerial systems available to the public. Although the Federal Aviation Administration (FAA) utilizes the taxonomy unmanned aircraft system (UAS), the public and press prefer the older, simpler nomenclature, drone.
Recent industry and FAA estimates indicate that sales of small UASs will exceed one million units during the 2015 holiday season.[2] As a result of UAS’s explosive popularity, policy leaders face difficult challenges and questions regarding UAS use and safety. For practical and policy considerations, UAS are classified as small, less than 55 pounds, and large, 55 pounds or more. (A third classification, micro, is proposed and the weight criteria is under development.) Large UAS, popularized during recent wars, carry sophisticated electronic navigation and detection capability to meet mission requirements and ensure safety. Generally, large UAS operate at high altitudes and beyond the operator’s line-of-sight. Due to operating limitations, small UAS do not have the same capabilities. Yet, small UAS have potential viable use for various commercial purposes such as photography, filming, traffic reports, fish spotting, agriculture, pipeline/rail inspection and package delivery.[3]
A basic safety tenant of the civil airspace system requires that all aircraft ‘can see and be seen.’ Therefore, FAA’s proposed rules for small UAS mandate operation within line-of-sight of the operator. Although useful to the recreational operator, this limitation does not efficiently allow for most extended commercial use. Consequently, various UAS stakeholders actively research advance capability known as ‘sense and avoid.’ In this paradigm, technology onboard the aircraft ‘looks’ for other aircraft (including other UAS) and takes autonomous action to avoid risk of collision.[4] Until that technology is developed, tested and deployed, large UAS operate in segregated blocks of airspace to mitigate the risk of collision.
Since ‘sense and avoid’ capability is in early development, full integration of large UAS in the National Airspace System (NAS) remains several years into the future. However, the million-drone Christmas is here today. The affordability, popularity, reliability and fly ability of small UAS presents significant challenges for today’s policy makers. Therefore, this case study examines the public policy implications and develops recommendations for integration of small UAS into the NAS.
Actors
[edit | edit source]US Senate Transportation, Housing, and Urban Development Subcommittee
[edit | edit source]The subcommittee is comprised of 17 Senators and has jurisdiction over 31 transportation, housing, and urban development agencies. Some of the transportation related agencies that the subcommittee has jurisdiction over include:the Federal Aviation Administration (FAA), the Department of Transportation (DOT),and the National Transportation Safety Board (NTSB). [5] Since the subcommittee has jurisdiction over the FAA, the issue of integrating small Unmanned Aerial Systems (UAS) into the national airspace has recently been deliberated. On October 28, 2015, the subcommittee held a hearing about integrating UAS into the national airspace in which multiple near collisions between drones and aircraft were discussed.[6]
US House Aviation Subcommittee
[edit | edit source]The subcommittee is comprised of 35 representatives and "has jurisdiction over all aspects of civil aviation, including safety, infrastructure, labor, commerce, and international issues."[7] The subcommittee has jurisdiction over all FAA programs, except research, and also the NTSB.[8] On October 2nd and 7th of 2015, the subcommittee held hearings on aviation safety concerning UAS.[9]
US Government Accountability Office (GAO)
[edit | edit source]The mission of the GAO "is to support the Congress in meeting its constitutional responsibilities and to help improve the performance and ensure the accountability of the Federal Government for the benefit of the American people."[10] The GAO performs studies at the request of Congress or as required by "public laws or committee reports."[11] Following the Federal Aviation Administration (FAA) Modernization and Reform Act of 2012, the GAO was directed to oversee the FAA's progress in integrating UAS into US civil aviation.[12]
Congressional Research Service (CRS)
[edit | edit source]The Congressional Research Service (CRS) functions as a staff to members of Congress and congressional committees.[13] CRS staff members provide services including: reports on policy issues, responses to inquiries, and seminars in addition to analyzing current and proposed policies.[14] On September 9, 2015, the CRS published a report entitled "Unmanned Aircraft Systems (UAS): Commercial Outlook for a New Industry" which highlighted the commercial domestic UAS industry.[15]
US Department of Transportation (DOT) Office of Inspector General (OIG)
[edit | edit source]The mission of the US Department of Transportation (DOT) Office of the Inspector General (OIG) is to fulfill "its statutory responsibilities and support members of Congress, the Secretary, senior Department officials, and the public in achieving a safe, efficient, and effective transportation system."[16] The OIG works to prevent or cease "fraud, waste, and abuse" through audits in addition to consulting with Congress about newly proposed laws/regulations.[17] On June 26, 2015, the OIG published "FAA Faces Significant Barriers To Safely Integrate Unmanned Aircraft Systems Into the National Airspace System" which spurred the initiation of an audit on the FAA's "approval and oversight processes" for UAS. [18]
US Federal Aviation Administration (FAA)
[edit | edit source]The mission of the US Federal Aviation Administration (FAA) "is to provide the safest, most efficient aerospace system in the world."[19] The FAA is a subordinate agency of the Department of Transportation which regulates and certifies all US aircraft, airports, and air traffic within the national airspace to ensure that established safety standards are upheld. The FAA is the main Federal agency responsible for ensuring the safe and seamless integration of UAS into the national airspace. As required by Section 332(a)of the FAA Modernization and reform Act of 2012, the FAA published "Unmanned Aircraft Systems (UAS) Comprehensive Plan: A Report on the Nation’s UAS Path Forward" in September of 2013.[20]
US Department of Defense (DOD)
[edit | edit source]"The mission of the Department of Defense (DOD) is to provide the military forces needed to deter war and to protect the security of our country."[21] The DOD has successfully developed and fielded UAS for use in global combat operations for many years. In 2013, the DOD published “Unmanned Systems Integrated Roadmap FY2011-2036” which highlighted the issue that military UAS operations within the national airspace are limited due to current FAA regulatory issues.[22]
US Department of Homeland Security (DHS)
[edit | edit source]The overall mission of the US Department of Homeland Security (DHS) "is to ensure a homeland that is safe, secure, and resilient against terrorism and other hazards."[23] The five DHS national security missions include: to prevent terrorism and enhance security, to secure the nation's borders,to enforce immigration laws, to safeguard cyberspace, and to ensure resilience following national disasters.[24] Subordinate DHS agencies such as the US Coast Guard and US Customs and Border Protection have successfully utilized UAS within the national airspace to enhance operations.
US Federal Bureau of Prisons (FBP)
[edit | edit source]The mission of the US Federal Bureau of Prisons (BOP) is "to protect society by confining offenders in the controlled environments of prisons and community-based facilities that are safe, humane, cost-efficient, and appropriately secure, and that provide work and other self-improvement opportunities to assist offenders in becoming law-abiding citizens."[25] On November 4, 2015, the FBP issued a request for information with the goal of discovering technology "that will allow for detection, tracking, interdiction, engagement and neutralization of small drones."[26]
US Forest Service (USFS)
[edit | edit source]The mission of the US Forest Service (USFS) "is to sustain the health, diversity, and productivity of the Nation’s forests and grasslands to meet the needs of present and future generations."[27] On June 19, 2014, the director of the USFS signed a policy memorandum entitled "Memorandum 14–05, Unmanned Aircraft – Interim Policy" which prohibits members of the public from operating UAS within the national parks.[28] The USFS currently utilizes UAS for forest fire detection and management.
US Park Police
[edit | edit source]The mission of the US Park Police (USPP) is to "support and further the mission and goals of the Department of the Interior and the National Park Service by providing quality law enforcement to safeguard lives, protect our national treasures and symbols of democracy, and preserve the natural and cultural resources entrusted to us."[29] On October 9, 2015, the USPP cited a man for flying a small drone in the vicinity of the Washington Monument which was the ninth similar occurrence in 2015 this year in a Washington area park.[30]
US National Aeronautics and Space Administration (NASA)
[edit | edit source]The mission of the US National Aeronautics and Space Administration is to "drive advances in science, technology, aeronautics, and space exploration to enhance knowledge, education, innovation, economic vitality, and stewardship of Earth."[31] From July 28-30, 2015, NASA held an UAS traffic management convention in which "policy issues including safety and security, emerging markets, strategies for low-altitude traffic management, and international perspectives" were discussed.[32]
NAV Canada
[edit | edit source]The mission of NAV Canada is to "facilitate the safe movement of aircraft efficiently and cost-effectively through the provision of air navigation services on a long-term sustainable basis."[33] NAV Canada is the entity responsible for controlling Canada's national airspace and approved UAS operators must contact them in order to coordinate airspace use.[34]
US Transportation Research Board (TRB) Airport Cooperative Research Program (ACRP)
[edit | edit source]The US Transportation research Board (TRB) Airport Cooperative Research Program (ACRP) conducts research on issues facing "airport operating agencies" that have not been addressed by existing Federal research programs.[35] "The ACRP undertakes research and other technical activities in a variety of airport subject areas including design, construction, maintenance, operations, safety, security, policy, planning, human resources, and administration."[36] In 2015, the ACRP published a report entitled "ACRP Report 144: Unmanned Aircraft Systems (UAS) at Airports: A Primer" to help US airports with UAS understanding and integration.[37]
The MITRE Corporation
[edit | edit source]The mission of the MITRE Corporation is to "work with industry and academia to advance and apply science, technology, systems engineering, and strategy, enabling government and the private sector to make better decisions and implement solutions to complex challenges of national and global significance."[38] In September of 2012, the MITRE Corporation published "Integrating Unmanned Aircraft into Nextgen Automation Systems" which addressed possible solutions to the challenges posed by UAS integration into the "National Airspace System (NAS), known as Next Generation Air Transportation System(NextGen)."[39]
Governor of the Commonwealth of Virginia
[edit | edit source]Governor Terry McAuliffe is the 72nd Governor of Virginia and his top priority is to ensure economic prosperity for the state through jobs creation and maintenance. [40] On June 12, 2015, Governor McAuliffe signed Executive Order 43 which established the Virginia Unmanned Systems Commission with the goal of making the state a national leader in UAS.[41] Under the Governor's leadership, the state was selected by the FAA as a UAS test site "to develop unmanned aerial technologies through the Mid-Atlantic Aviation Partnership."[42]
Mid-Atlantic Aviation Partnership (MAAP)
[edit | edit source]The Mid-Atlantic Aviation Partnership (MAAP) is a collaboration effort between academic institutions from Virginia, Maryland, and New Jersey with the goal of executing a successful UAS "test capability for the nation."[43] In December of 2013, the FAA selected the MAAP as one of its six designated UAS test sites which is located at Virginia Tech University. [44]
Virginia UAS Commission
[edit | edit source]The 19 member Virginia UAS Commission was established by Governor McAuliff's Executive Order 43 to "be a key asset in charting the way forward to grow (the UAS) industry and create new, good jobs and economic opportunities across the Commonwealth."[45] The established goals of the Virginia UAS Commission include: "identify the state of all unmanned systems industries in Virginia, identify challenges and needs of the unmanned system industry that may be met with Virginia assets for each domain of unmanned systems, provide recommendations that will encourage the development of the unmanned systems industry, and develop the value proposition for Virginia that will provide a basis for marketing Virginia to the current unmanned systems industry."[46]
Google Incorporated
[edit | edit source]"Google’s mission is to organize the world’s information and make it universally accessible and useful."[47] Google in conjunction with other major corporations, signed an agreement with NASA "to help devise the first air-traffic system to coordinate small, low-altitude drones, which the agency calls the Unmanned Aerial System Traffic Management"[48] The company is also researching novel UAS applications such as internet provision and parcel delivery.
Amazon Incorporated
[edit | edit source]The mission of Amazon is "to be Earth's most customer centric company; to build a place where people can come to find and discover anything they might want to buy online."[49] Amazon has been testing its parcel delivery UAS in a secret location in Canada, due to FAA regulations. [50] Amazon's small parcel UAS are being developed to operate at an altitude of 200ft-500ft with a range of about 10 miles, "carrying payloads of up to 5lbs which accounts for 86% of all the company’s packages."[51] Amazon has termed its vision for parcel delivery via UAS as "Amazon Prime Air."
Academy of Model Aeronautics (AMA)
[edit | edit source]The mission of the Academy of Model Aeronautics is to provide "leadership, organization, competition, communication, protection, representation, recognition, education, and scientific/technical development to modelers."[52] The AMA is the world's largest "model aviation association" with over 175,000 members,"organized for the purpose of promotion, development, education, advancement, and safeguarding of modeling activities."[53]
International Drone Racing Association (IDRA)
[edit | edit source]The mission of the International Drone Racing Association (IDRA) is to provide a world class racing experience, promote innovation, and foster education on UAS.[54] The IDRA enables the global "First Person View (FPV) racing community exciting, professionally organized, highly competitive racing competitions."[55]
Association for Unmanned Vehicles Systems International (AUVSI)
[edit | edit source]The Association for Unmanned Vehicle Systems International (AUVSI) "is the world's largest nonprofit organization devoted exclusively to advancing the unmanned systems and robotics community."[56] The organization serves over 7,500 members from government, academia, and industry; "AUVSI members support defense, civil and commercial sectors."[57]
Air Line Pilot Association (ALPA)
[edit | edit source]"The mission of the Air Line Pilots Association (ALPA) is to promote and champion all aspects of aviation safety throughout all segments of the aviation community; to represent, in both specific and general respects, the collective interests of all pilots in commercial aviation; to assist in collective bargaining activities on behalf of all pilots represented by the Association; to promote the health and welfare of the members of the Association before all governmental agencies; to be a strong, forceful advocate of the airline piloting profession, through all forms of media, and with the public at large; and to be the ultimate guardian and defender of the rights and privileges of the professional pilots who are members of the Association."[58] As of October 1, 2015, the ALPA became the most recent supporter of the "Know Before You Fly" campaign.[59] The campaign was implemented in December of 2014 by the AUVSI and the AMA, in partnership with the FAA,"to provide UAS users with the information and guidance they need to fly safely and responsibly."[60]
Competitive Enterprise Institute (CEI)
[edit | edit source]The mission of the Competitive Enterprise Institute (CEI)"is to promote both freedom and fairness by making good policy good politics."[61] CEI is a non-profit organization "dedicated to advancing the principles of limited government, free enterprise, and individual liberty."[62] On November 6,2015, the CEI submitted a formal response to the FAA's request for information, in reference to UAS registration.
National Corn Grower's Association (NCGA)
[edit | edit source]The mission of the National Corn Grower's Association (NCGA) is to "create and increase opportunities for corn growers."[63] On April 20, 2015, the NCGA submitted a formal letter to the US DOT and US Department of Commerce’s National Telecommunications and Information Administration which highlighted the fact that "unmanned aerial systems have widespread potential applications for farmers."[64]
Electronic Frontier Foundation (EFF)
[edit | edit source]The Electronic Frontier Foundation is the leading nonprofit organization defending civil liberties in the digital world. Founded in 1990, EFF champions user privacy, free expression, and innovation through impact litigation, policy analysis, grassroots activism, and technology development.[65]
Electronic Privacy Information Center (EPIC)
[edit | edit source]EPIC is a non-profit research and educational organization established in 1994 to focus public attention on emerging human rights issues, and to defend privacy, freedom of expression, and democratic values.[66]
SkyPan International Incorporated
[edit | edit source]A Chicago based aerial photography company that utilizes proprietary Remote Piloted Vehicles (RPV) that usher in a whole new world of aerial and panoramic photography. SkyPan spent many years researching, developing and advancing these technologies that allow us to shoot unique, 360-degree, "bird's-eye views" from a full range of platforms.[67] On October 6, 2015, the Federal Aviation Administration proposed a record $1.9 million fine against SkyPan for flying small UASs in crowded New York and Chicago airspace without permission.[68]
DJI
[edit | edit source]DJI Innovations is a privately owned and operated company based in Shenzhen, China. DJI is the world's largest manufacturer of small UAS platforms with many equipped for high-definition video and still photography. DJI platforms are used in filmmaking, agriculture, conservation, search and rescue, and energy infrastructure with flying and camera stabilization systems that redefine camera placement and motion.[69] On November 18, 2015, DJI announced development of new operating software that prevents UAS flights over sensitive areas.[70] DJI recently launched an UAV specifically designed for spraying crops[71].
Timeline of Events
[edit | edit source]June 9, 1981 – The United States (US) Federal Aviation Administration (FAA) issues Advisory Circular 91-57 "Model Aircraft Operating Standards" that outlines and encourages voluntary compliance with safety standards for operating model aircraft.
February 1, 2010 – MITRE Corporation publishes "Airspace Integration Alternatives for Unmanned Aircraft (UAS)".
2012 – MITRE Corporation publishes "A New Paradigm for Small UAS".
February 14, 2012 – The US Congress passes FAA Modernization and Reform Act of 2012 that includes requirements and timelines for integration of civil Unmanned Aircraft Systems (UAS) into the National Airspace System (NAS). Public Law 112-95 Subtitle III, Subtitle B.
September 18, 2012 – US Government Accountability Office (GAO) publishes "Unmanned Aircraft Systems: Measuring Progress and Addressing Potential Privacy Concerns Would Facilitate Integration into the National Airspace System".
October 16, 2012 – MITRE Corporation publishes "Integrating Unmanned Aircraft into NEXTGEN Automation Systems".
2013 – US Department of Defense (DOD) publishes Unmanned Systems Integrated Roadmap: FY2013 - 2038.
September 2013 – FAA publishes "Unmanned Aircraft Systems (UAS) Comprehensive Plan".
November 7, 2013 – FAA publishes "Roadmap for Integration of Civil Unmanned Aircraft Systems (UAS) in the National Airspace System".
December 30, 2013 – FAA selects six UAS research and test site operators across the country.
January 6, 2014 – FAA publishes "Fact Sheet – Unmanned Aircraft Systems (UAS)".
February 15, 2014 – GAO publishes "Unmanned Aircraft Systems: Continued Coordination, Operational Data, and Performance Standards Needed to Guide Research and Development".
June 26, 2014 – US Department of Transportation (DOT) Office of Inspector General (OIG) publishes "FAA Faces Significant Barriers to Safely Integrate Unmanned Aircraft Systems into the National Airspace System".
December 10, 2014 – GAO publishes "Unmanned Aerial System: Efforts Made Toward Integration into the National Airspace Continue, but Many Actions Still Required".
2015 – Under the FAA sponsored Airport Cooperative Research Program (ACRP), the Transportation Research Board (TRB) publishes "Unmanned Aircraft Systems (UAS) at Airports: A Primer".
February 23, 2015 – FAA publishes proposed rules for the operation and certification of small UAS.
March 31, 2015 - Electronic Privacy Information Center (EPIC) initiates legal action against the FAA for failing to address privacy in small UAS proposed rules.
June 12, 2015 – Governor Terry McAuliffe of the Commonwealth of Virginia announces the formation of the Virginia Unmanned Systems Commission.
July 2015 – GAO publishes "Unmanned Aerial Systems: FAA Continues Progress toward Integration into National Airspace".
July 28, 2015 – US National Aeronautics and Space Administration (NASA) conducts a three-day conference regarding air traffic management of UAS attended by Google and Amazon.
August 13, 2015 – FAA releases database of pilot reports concerning UAS sightings highlighting 500% increase in 2015 over 2014.
August 30, 2015 – The Commonwealth of Virginia publishes "Virginia Unmanned Systems Business Plan".
September 2, 2015 – FAA issues Advisory Circular 91-57A that revises standards for model aircraft for hobby and recreational purposes.
September 14, 2015 – Academy of Model Aeronautics releases an analysis of FAA database of UAS pilot sightings finding dozens versus hundreds of “near misses.”
September 15, 2015 – FAA announces prohibition of UAS operations ahead of Papal visits to Washington, Philadelphia and New York.
September 18, 2015 – Virginia Governor McAuliffe opens the first meeting of the Virginia UAS Commission at George Mason University Arlington Campus.
October 2, 2015 – The Aviation Subcommittee of the US House of Representatives Transportation and Infrastructure Committee held a public hearing titled, “Ensuring Aviation Safety in the Era of Unmanned Aircraft Systems”
October 7, 2015 – FAA expands industry collaborative research and development initiatives to detect UAS in the vicinity of airports.
October 22, 2015 – FAA releases clarification of registration requirement for UAS and announces the formation of UAS registration task force.
October 28, 2015 – The Transportation, Housing, and Urban Development Subcommittee of the US Senate Appropriations Committee conducts a public hearing titled. “Integrating Unmanned Aircraft Systems Technology into the National Airspace System.”
November 3, 2015 - FAA Administrator Michael Huerta kicks-off 25-member UAS Regestration Task Force chartered to develop recommendations on requirements and procedures for registration of UASs.
November 4, 2015 – US Federal Bureau of Prisons (FBP) publishes a request for information procurement initiative for Protection from Unmanned Air Vehicles.
November 21, 2015 - The UAS Registration Task provides recommendations to the FAA for registration of UAS between .55 and 55 pounds.
Maps of Locations
[edit | edit source]
After a rigorous 10-month selection process involving 25 proposals from 24 states, the Federal Aviation Administration chose six unmanned aircraft systems research and test site operators across the country. In selecting the six test site operators, the FAA considered geography, climate, location of ground infrastructure, research needs, airspace use, safety, aviation experience and risk. In totality, these six test applications achieve cross-country geographic and climatic diversity and help the FAA meet its UAS research needs.[72]
Policy Issues
[edit | edit source]Privacy
[edit | edit source]While the integration of UAS in the commercial sector presents great opportunities, it also raises questions as to how to achieve UAS integration in a way that is consistent with privacy and civil liberties concerns. Though the FAA’s mission does not include creating or implementing policies related to privacy, experience with the UAS test sites give them the opportunity to learn more concerning the use of UAS technologies and the topic of privacy. The FAA plans to have each test site operator create a privacy policy that will affect operations at the test site. The privacy policy will be publicly accessible and informed by Fair Information Practice Principles. In addition, each test site will create a tool through which the operator can collect and consider comments on its privacy policy. The privacy requirements planned for the UAS test sites are specially designed for the test sites and are not meant to predetermine the long-term policy under which UAS would function. Still, the FAA expects that the privacy policies created by the test sites will help inform the discussion among policymakers and privacy advocates.[73]
Safety
[edit | edit source]Established FAA policy supports the concept of aircraft over the United States are piloted in accordance with their mandatory procedures and practices, and that same policy extends to UAS. Additionally, all new civil aircraft require an airworthiness certificate, independent of the airspace class where it could be flown.[74]
The application of these established policies to UAS is summarized in the following key points:
Regulatory standards need to be establish to enable current technology for UAS to comply with Title 14 Code of Federal Regulations which states that "in order to ensure safety, the operator is required to establish the UAS airworthiness either from FAA certification, a DoD airworthiness statement, or by other approved means."[75]
Applicants also have to prove that a collision with another aircraft is extremely unlikely.
And the pilot-in-command concept is necessary for manned operations. The FAA’s UAS guidance applies this pilot-in-command concept to UAS and includes minimum qualification and currency requirements.
To gain full access to the national air space, UAS need to be able to improve from existing systems requiring accommodations to future systems that are able to obtain a standard airworthiness certificate. These UAS will also need to be used by a certified pilot in accordance with existing, revised, or new regulations and required standards, policies, and procedures.[76]
Security
[edit | edit source]Integrating public and civil UAS into the national airspace carries specific national security repercussions. These include security screening for certifications and instructing of UAS-related personnel, focusing on cyber and communications weaknesses, and upholding and improving air defense and air domain awareness capabilities in an increasingly crowded airspace. In some cases, existing security structures used for manned aircraft may be valid. Other security concerns may require developing new security plans entirely. The FAA is working with applicable US departments and agencies, and with stakeholders to proactively address these areas of concern.[77]
Case Narrative
[edit | edit source]Across the three policy areas, various actors introduced initiatives to determine or influence policy based upon their organizational mission and priorities. Although small UAS certification and operation regulations are not final, the Federal Aviation Administration utilizes current regulations to determine the requirements highlighted in Table 1. By limiting small UAS operations to line-of-sight, daylight, below 400 feet above ground level and outside controlled airspace, the FAA mitigates risk of collision. Additionally, Certificates of Waiver or Authorization contain specific operational requirements that further mitigates collision through isolated airspace, chase aircraft, position and altitude transponders, direct two-way communications, etc. The FAA defines Public Entities as law enforcement, firefighting, border patrol, disaster relief, search and rescue, military training and other governmental missions.[78] This section provides further information on additional policy initiatives.
Table 1. Current FAA Requirements for Operation of Small UAS
| Use of UAS | Line-of-Sight Operation | Beyond Line-of-Site Operation |
|---|---|---|
| Recreational | Below 400’, Daylight, Uncontrolled Airspace | Prohibited |
| Experimental | Below 400’, Daylight, Uncontrolled Airspace | Experimental Airworthiness Certificate |
| Commercial | Certificate of Waiver or Authorization | Certificate of Waiver or Authorization |
| Public Entities | Below 400’, Daylight, Uncontrolled Airspace | Certificate of Waiver or Authorization |
Note: Information from FAA Fact Sheet - Unmanned Aircraft Systems
Criticisms of Current Policy
[edit | edit source]The current FAA UAS policy has been the subject of criticism from certain stakeholders. The major points of contention of the current UAS policy include: failure to address privacy issues, the proposal to mandate registration of all UAS, and the requirement for UAS to be flown via line-of-sight. On March 31, 2015, EPIC filed a suit against the FAA "for failing to establish privacy rules for commercial drones as mandated by Congress."[79] The suit was filed in response to the FAA's notice of proposed rule-making (NPRM) and denial of EPIC's initial petition (filed in 2012), both occurred on February 23, 2015.[80] The NPRM issued by the FAA states, " privacy issues are beyond the scope of this rulemaking."[81] The case is currently awaiting deliberation in the US Court of Appeals for the District of Columbia.
On November 6, 2015, CEI submitted a formal response to the FAA's "Request for Information Regarding Electronic Registration for UAS". In the response, the CEI highlighted three main points including: "(1)the FAA lacks jurisdiction to mandate registration for all unmanned aircraft systems; (2) mere registration, whether point-of-sale or prior-to-operation, will do little to mitigate UAS safety risks; and (3) the FAA cannot dispense with required notice and comment rulemaking requirements by way of the good cause exception to the Administrative Procedure Act (APA)."[82] CEI pointed out that the FAA lacks jurisdiction to mandate UAS registration because Section 336 of the FAA Modernization and Reform Act (FMRA) states that the "FAA is not permitted to promulgate rules targeting small UAS hobbyists."[83] CEI further explained that methods such as geo-fencing would be more effective with countering unsafe UAS operation as opposed to compulsory registration. Finally, CEI asserted that Transportation Secretary Fox's goal to mandate UAS registration by "mid December" violates the APA which states that "substantive agency rulemakings are required to include a notice and comment period of at least 30 days", unless the agency can illustrate good cause.[84] If enacted, the proposed requirement for all UAS to be registered will likely be met with a great deal of opposition from hobbyists and commercial entities alike.
The current FAA UAS policy requires that "UAS must be flown within the line of sight of the operator, less than 400 feet above the ground, during daylight conditions, inside Class G (uncontrolled) airspace, and more than five miles from any airport or other location with aviation activities."[85] The requirement for line of sight UAS operations drastically limits the capabilities of hobbyist and commercial entities alike. For instance, the IDRA hobbyist organization promotes "First Person View (FPW)" UAS racing which is strictly prohibited by the current policy. Amazon wishes to use "highly automated aerial vehicles for Prime Air" with "sense and avoid sensors" to deliver payloads of up to five pounds (accounts for 85% of sold products) within a range of 10 miles.[86] Under the current FAA UAS regulations, Amazon would have to submit a Certificate of Waiver or Authorization for the fleet of Global Positioning System (GPS) navigated and automated UAS.
Jurisdiction/Authority
[edit | edit source]The FAA Modernization and Reform Act (FMRA) of 2012 grants the Administrator of the Federal Aviation Administrator broad and exclusive authority for the safety of flight.[87] The authority is codified in detailed Federal Aviation Regulations (FAR) that define standards and requirements for the safe operation of airborne systems, airports, airways, procedures and obstructions. Over time, case law recognized FAA authority extending into all airspace not otherwise exempted by law. Therefore, this national authority cannot be preempted by state law. However, other stakeholders offer differing opinions on the applicability of FAA authority to regulate small UAS. Through October 8, 2015, 45 states considered 166 bills in 2015 relating to UAS operations with 20 enacting legislation and 4 adopting resolutions.[88] The role of the state legislation varies widely and face challenges as preempting FAA authority. Other actors, such as SkyPan International, state that the current FAA small UAS requirements lack legal substance because the FAA exceeded current legal authority.[89] However, the Electronic Privacy Information Center (EPIC) opines that the FAA failed to exercise authority and requirement in FMRA by failing to define privacy protections in the proposed small UAS operation and certification requlations.[90] These conflicts require adjudication in the appropriate court systems.
Registration
[edit | edit source]On November 3, 2015, FAA Administrator Michael Huerta chartered a 25 member task force to provide recommendations on requirements and procedures regarding small UAS.[91] Citing too many close calls between piloted and unmanned aircraft, Administrator Huerta urged the task force to "think outside of the box" and leverage currently available technology to design and quickly implement a registration scheme.[92] The task force members represent various industry and organizational stakeholders. The process could be in place by mid-December in anticipation of millions of new aircraft being given as holiday gifts.[93] The FAA emphasizes the importance of protecting the national airspace and differentiates between remotely operated ground vehicles. Much like owning an automobile, not registering your UAS could provide a reason for law enforcement to focus on you. The main reason for having registration will be to locate the owner if there is an accident (or purposeful) encounter with another aircraft or object on the ground.[94] Additionally, the FAA warned current small UAS owners not utilize advertised "Drone Registration" firms, as the registration process is still in development.[95]
On November 21, 2015, the UAS Registration Task Force provided recommendations to the FAA for registration of small UAS between .55 and 55 pounds. If adopted, small UAS owners would register their name and physical home address to the FAA and receive a single registration number that must be affixed to every drone owned by that registrant.[96] On November 23, 2015, Representative Peter DeFazio, ranking member of the House Transportation and Infrastructure Committee praised the FAA and the Task Force for their quick work and reasonable recommendations. However, the Competitive Enterprise Institute questions the legitimacy of including these regulations in emergency rule-making.[97] Additionally, the Electronic Privacy Information Center stated that the Task Force did not go far enough and require contact information for small UAS operators and full disclosure of registered small UAS surveillance capabilities.[98]
Standards/Regulations
[edit | edit source]The FAA proposes three categories of UAS. Micro UAS weighs less than 4.4 pounds and will have the most flexible standards and regulations. Small UAS weigh less than 55 pounds and large UAS weigh 55 pounds or more. Some industry and policy stakeholders believe these categories do not effectively describe all the different characteristics across the range of UAS available. In constrast, the DoD has 5 classes of UAS that are categorized by characteristics such as speed, weight, and altitude capabilities. Grouping UAS into specific classes are an essential step in achieving certification standards.[99]
Although proposed and published in February 2015, the FAA has not finalized regulations for integrating small UAS into the airspace. Currently, the FAA allows the use of UAS on a case-by-case basis. To move past the time consuming process, the FAA seeks to establish standards in the following areas: performance standards, certification standards, and categorization. Without governing regulations, UAS will be unable to operate in the national airspace without substantial limitations.[100] The FAA estimates that small UAS regulations and standards will be finalized by June 17, 2016.[101] Some stakeholders do not recommend any regulations or standards for small UAS, as this will unneccesarily constrain the growth and development of a new industry.[102]
Work remains between the FAA and other government agencies and industry participants on minimum performance standards for large UAS. In March 2013, a UAS executive committee was created to focus on “more detailed standards for detect and avoid capabilities and command and control links. In the near term, the focus will be on operations at higher altitudes.”[103] Additionally, there are not yet established standards “necessary for designing, manufacturing, and certifying new UAS”.[104] Because of this, the FAA is unable to certify any new large UAS or offer direction to manufacturers concerning the design specification that would be required for certification. However, a special committee developed and released interim standards for detect-and-avoid systems and command-and-control data links.[105]
Enforcement
[edit | edit source]As with any standard or regulation, they must be buttressed with the necessary authority to ensure compliance and penalties for noncompliance. Unfortunately with the extraordinary and rapid growth of small UAS ownership and operations, there are numerous and increasing reports of small UAS operating too close to piloted aircraft, airports and restricted airspace. Aircraft pilot reported data maintained by the FAA indicates an increase from 16 incidents in June 2014 to 138 in June of 2015. These events include the need to shutdown aerial forest fire fighting in several Western wildfires due to unauthorized small UAS activity. Therefore, regulators initiated several recent enforcement actions for safety and security violations.
The most significant is a $1.9 million fine by the FAA against Chicago aerial photography company SkyPan International for 65 unauthorized commercial UAS flights including 43 in highly restricted New York airspace.[106] However, other recent events continue to highlight enforcement of restrictions. After a small UAS crashed on the White House grounds in January 2015 and another small UAS flew adjacent to the White House in May 2015, the US Park Service and US Secret Service stepped up enforcement. The Park Service fined a District of Columbia resident after the Secret Service retrieved a small UAS from the White House Ellipse.[107] The problem is not isolated to the United States. The United Kingdom's Civil Aviation Authority (CAA) fined a small UAS operator for filming a promotional video in London.[108] Recognizing the growing problem and increased collision risk, the Chief Executive Officer of NAV Canada, Canada's air navigation service provider, recommends criminal penalties for unauthorized small UAS operations close to airports.[109]
However, the FAA, UK CAA and Transport Canada prefer a multi-pronged approach that includes education and awareness coupled with stronger enforcement. Ahead of the September 2015, Papal visits to New York, Washington and Philadelphia, the FAA partnered with the small UAS and model aircraft industries to educate the public on restrictions to small UAS flights near Pope Francis.[110] In addition, the FAA collaborated with the small UAS industry to create the website, "Know Before You Fly," to increase public awareness and educate the small UAS community.[111]
Geo-Fencing
[edit | edit source]Geo-fencing is a software feature encoded into small UAS onboard systems and controller applications that prevent activation and flight of the small UAS over restricted or security sensitive areas. DJI, the world's largest small UAS manufacturer, announced on November 19, 2015 the installation and availability of a software update that includes Geo-Fencing around prisons, power plants, airports, restricted airspace, natural disasters and major sporting events. However, public safety organizations such as police and firefighting first responders will be able to deactivate geo-fencing to perform life safety and security functions.[112] During US Congressional hearings in October 2015, many members called for mandatory geo-fencing as part of FAA proposed small UAS regulations.[113]
sUAS Air Traffic Management
[edit | edit source]Small UAS are versatile and affordable platforms that provide utility beyond the recreational user or amateur photographer, in spite of the proliferation of videos on YouTube. In agriculture, small UAS provides early detection of pest infestations and crop disease, precise application of fertilizers and crop scouting.[114] Small UAS aid in the restoration of power after damaging weather events.[115] Additionally, the Association of Unmanned Vehicle Systems International (AUVSI) estimated that small UAS operations will contribute $80 billion in new business, if safely integrated.[116] However, the most effective small UAS functionally requires the ability to safety navigate during beyond the line-of-sight operations. Two major initiatives are working toward this goal.
The FAA established the Pathfinder Program to leverage developing technology to extend small UAS operations beyond line-of-sight. Currently, CNN, PrecisionHawk, BNSF Railway and CACI participate in this collaborative research and development initiative.[117] CNN is exploring small UAS use for news gathering in populated areas while PrecisionHawk is developing beyond line-of-sight in rural areas.[118] BNSF Railways is researching command and control of small UAS to inspect rail infrastructure.[119] CACI will access the safety and security capabilities to detect and track small UAS operations in the vicinity of airports.[120] On November 13, 2015, PrecisionHawk announced live testing of small UAS capability to detect and self-navigate away from other airborne vehicles and obstacles.[121]
NASA is partnering with 21st Century giants, Amazon and Google, to develop an integrated system that allows safe and widespread operation of small UAS in low-altitude airspace.[122] NASA envisions autonomous operation of UAS air traffic management in portable and persistent systems.[123] Google and Amazon propose the use of current cellular systems for command and control while Automatic Dependent Surveillance-Broadcast (ADS-B) provides detection capability. Additionally, Google and Amazon propose a low-altitude airspace design that segregates small UAS into different altitude strata depending upon the flight's purpose.[124] This system's concept of operation prioritizes access through a paradigm where the best-equipped small UAS get the best service.[125]
Defense
[edit | edit source]Similar to other emerging technology, the criminally minded develop nefarious uses for small UAS. However, due to their size, affordability, flyability and difficulty to detect, small UAS are especially appealing and create an emerging security threat.[126] Current research is exploring several avenues to protect against this threat. First, small UAS have two inherent weaknesses, GPS navigation and data link control. This research explores ways to deactivate the UAS by breaking these links. Second, developers investigated new radar capability to detect the small slow moving UAS. Last, small UAS interdiction through accurate and fast laser platforms which destroy the UAS and eliminates the risk.[127] These technologies remain in development and are not currently available for deployment.
However, the US Federal Bureau of Prisons (BOP) seeks a solution to the growing use of small UAS to smuggle weapons and prohibited items into Federal prisons.[128] Additionally, small UAS are used for unauthorized imagery and surveillance. BOP requests information on an ingrated system with capability to detect, interdict and neutralize small UAS operations in the vicinity of BOP locations.[129] Additionally, this system has potential to protect critical infrastructure and crowded events and mitigates the growing threat of terrorists utilizing small UASs.
Conclusions and Recommendations
[edit | edit source]The small UAS policy arena is dynamic and growing. As expected in a new transportation sector, many actors engage to advocate or protect their interests. There is no shortage of opinion or ideas across the three policy areas of privacy, safety and security. Therefore, policy makers face a significant challenge piecing together relevant information and developing effective policy without unintended negative consequences and without favoring a specific actor(s). As demonstrated by the 2015 “Million Drone Christmas”, policy makers do not have the luxury of unlimited time to act. This section provides three policy recommendations.
First, privacy policy is beyond the scope of the Federal Aviation Administration. Therefore, US Congress must determine if there is valid threat to individual privacy and develop policy to mitigate that threat. Although small UAS provide easy and inexpensive capability to ‘film’ from new vistas, airborne surveillance by law enforcement and other public agencies is not new. Therefore, the privacy threat may not be as significant as feared. However, the popularity of small UAS may make it more salient.
Second, the proliferation of small UAS creates a risk of collision. Although much easier to operate that previous vehicles, small UAS crash. Also, small UAS lack capability to ‘see and be seen’ in the current aviation environment. Therefore, the FAA must complete review of public comments on proposed small UAS regulations and publish final regulations as soon as possible.
Third, small UAS offer tremendous economic and efficiency benefits across a spectrum of sectors. However, less than a dozen companies participate in consortiums of research and development initiatives across the country. More actors with stake in the growing small UAS industry must contribute more research and development resources in a collaborative environment. Only through emerging technologies will small UAS safely and securely integrate in the National Airspace System.
Additional Readings
[edit | edit source]FAA Fact Sheet - Unmanned Aircraft Systems
GAO Unmanned Aerial Systems: FAA Continues Progress toward Integration in the National Airspace
CRS Domestic Drones and Privacy: A Primer
Discussion Questions
[edit | edit source]Are small UAS a threat to the privacy of the general public?
Does mandatory UAS registration create privacy risks for small UAS operators/owners?
Do regulation and standards create a chilling effect on the growing UAS industry?
Do the benefits of small UAS exceed the security and safety risks (perceived or real)?
Is the Federal government moving fast enough to keep up with the growth of small UAS?
What is the state and local role in the regulation of small UAS?
References
[edit | edit source]Academy of Model Aeronautics. "A Closer Look at the FAA's Drone Data." AMA, September 14, 2015. http://www.modelaircraft.org/gov/docs/AMAAnalysis-Closer-Look-at-FAA-Drone-Data_091415.pdf
Academy of Model Aeronautics. Media Release: "New AMA Analysis: FAA Data Reveals Complex Picture of U.S. Drone Activity." AMA, September 14, 2015. http://www.modelaircraft.org/files/AMAreleasesanalysisofFAAsnearmissdata.pdf
Academy of Model Aeronautics. “Academy of Model Aeronautics - What Is the AMA?” Accessed November 20, 2015. http://www.modelaircraft.org/aboutama/whatisama.aspx.
Air Line Pilots Association. “What We Do - ALPA.” Accessed November 20, 2015. http://www.alpa.org/en/about-alpa/what-we-do.
Amazon. "Determining Safe Access with a Best-Equipped, Best-Served Model for Small Unmanned Aircraft Systems." NASA UAS Traffic Management Convention, July, 2015. http://utm.arc.nasa.gov/docs/Amazon_Determining%20Safe%20Access%20with%20a%20Best-Equipped,%20Best-Served%20Model%20for%20sUAS[2].pdf
Amazon. “Amazondotcom” Facebook. Accessed November 18, 2015. https://www.facebook.com/Amazon/info?tab=page_info.
Amazon. "Revising Airspace Model for Safe Integration of Small UAS." NASA UAS Traffic Management Convention, July 2015. http://utm.arc.nasa.gov/docs/Amazon_Revising%20the%20Airspace%20Model%20for%20the%20Safe%20Integration%20of%20sUAS[6].pdf
Associated Press. "FAA Proposes Nearly $2 Million Fine Against Drone Operator" ABC Chicago, October 6, 2015. http://abc7chicago.com/news/faa-proposes-nearly-$2-million-fine-against-drone-operator/1019911/ Accessed October 8, 2015.
AUVSI. “Who Is AUVSI - Association for Unmanned Vehicle Systems International.” Accessed November 20, 2015. http://www.auvsi.org/home/learnmore.
Blachly, Linda. "FAA Proposes $1.9 Million Civil Penalty Against UAS Operator." Air Transport World, October 6, 2015.
Canis, Bill. “Congressional Research Service (Library of Congress).” Text. Washington DA: Congressional Research Service, September 9, 2015. http://www.loc.gov/crsinfo/.
Competitive Enterprise Institute. “About | Competitive Enterprise Institute.” Accessed November 20, 2015. https://cei.org/about-cei.
Croft, John. "DOT: Register Your Drones or Face FAA Penalties." Aviation Daily, October 19, 2015.
Department of Homeland Security. “Our Mission | Homeland Security.” Accessed November 16, 2015. http://www.dhs.gov/our-mission.
Department of Transportation Office of Inspector General. “About OIG | Office of Inspector General.” Accessed November 16, 2015. https://www.oig.dot.gov/about-oig.
Drew, James. "NBAA: UAVs Find Their Place in Business Aviation." Flightglobal, November 18, 2015. https://www.flightglobal.com/news/articles/nbaa-uavs-find-their-place-in-business-aviation-419237/
Dron, Alan. "UK Fines UAV Operator for Flying Over Central London." Air Transport World, October 9, 2015.
Electronic Privacy Information Center. “EPIC - EPIC v. FAA.” Accessed November 23, 2015. https://www.epic.org/privacy/litigation/apa/faa/drones/.
Electronic Privacy Information Center v. Federal Aviation Administration. EPIC, March 31, 2015. https://epic.org/privacy/litigation/apa/faa/drones/EPIC-v-FAA-DC-Cir-Petition.PDF
Electronic Privacy Information Center. "Spotlight on Surveillance." EPIC, October 2014. https://epic.org/privacy/surveillance/spotlight/1014/drones.html
Electronic Privacy Information Center. "Comments to the FAA on Registration Requirements for UAS." EPIC, November 12, 2015.
Eschel, David and John M. Doyle. "UAV Killers Gain Role Against Growing Threat." Aviation Week and Space Technology, November 6, 2015.
Esler, David. "What a Business Aviation Flight Department Needs to Know About UAVs." Aviation Week, September 25, 2015.
Federal Aviation Administration. “Fact Sheet – Unmanned Aircraft Systems (UAS).” Template, January 6, 2015. https://www.faa.gov/news/fact_sheets/news_story.cfm?newsId=14153
Federal Bureau of Prisons. “BOP: Agency Pillars.” Accessed November 17, 2015. https://www.bop.gov/about/agency/agency_pillars.jsp.
Federal Aviation Administration. (1981) "Advisory Circular 91-57." Washington: FAA.
Federal Aviation Administration. (2015) "Advisory Circular 91-57A." Washington: FAA.
French, Sally. "Drone Maker Moves to Limit Flying Over Sensitive Areas." MSN Market Watch, November 18, 2015. http://www.msn.com/en-us/money/technologyinvesting/drone-maker-moves-to-limit-flying-over-sensitive-areas/ar-BBn8vpe?li=AA4Zjn
Goglia, John. “U.S. Seeks Drone Protection Technology For Federal Prisons.” Forbes. Accessed November 17, 2015. http://www.forbes.com/sites/johngoglia/2015/11/06/us-seeks-drone-protection-technology-for-federal-prisons/.
Google. “About Google.” Accessed November 18, 2015. https://www.google.com/about/.
Herman, Peter and Candice Norwood. "Police Cite District Man After Drone Lands on Ellipse near White House." Washington Post, October 9, 2015.]
International Drone Racing Association. “About the IDRA.” IDRA | FPV Drone Racing International. Accessed November 20, 2015. http://www.idra.co/.
Kauh, Elaine. "FAA: Drone Rules Ready by June 2016." AVWeb, October 7, 2015. http://www.avweb.com/avwebflash/news/FAA-Drone-Rules-Ready-By-June-2016-224972-1.html?zkPrintable=true
Kauh, Elaine. "SkyPan to FAA: Our Drone Flights Legal, Safe." AVWeb, October 15, 2015. http://www.avweb.com/avwebflash/news/SkyPan-To-FAA-Our-Drone-Flights-Legal-Safe-225011-1.html
Karp, Aaren. "A Nightmare: A Million Christmas Drones." Aviation Daily, September 28, 2015.
Karp, Aaren. "NAV Canada CEO: 'Jail Time' Needed for Reckless UAV Operators." Air Transport World, October 8, 2015.
Know Before You Fly. “Air Line Pilots Association Joins ‘Know Before You Fly’ | Know Before You Fly.” Accessed November 20, 2015. http://knowbeforeyoufly.org/2015/10/air-line-pilots-association-joins-know-before-you-fly/.
Morgan, David. "FAA Task Force to Recommend Drone Registry." Reuters. November 20, 2015.
Levin, Alan. “Google Wants a Piece of Air-Traffic Control for Drones.” Bloomberg.com. Accessed November 18, 2015. http://www.bloomberg.com/news/articles/2015-07-24/google-has-way-to-unclog-drone-filled-skies-like-it-did-the-web.
Mid Atlantic Aviation Partnership. “About Us | Mid-Atlantic Aviation Partnership.” Accessed November 18, 2015. http://www.maap.ictas.vt.edu/about-us-2/.
Misener, Paul. “Amazon Petition for Exemption,” July 9, 2014.
National Aeronautics and Space Administration. “NASA UTM: Convention 2015.” Accessed November 17, 2015. http://utm.arc.nasa.gov/utm2015.shtml.
National Corn Growers Association. “Mission/Vision.” National Corn Growers Association. Accessed November 20, 2015. http://www.ncga.com/about-ncga/mission-vision.
National Corn Growers Association. “NCGA Submits Comments to Federal Agencies Regarding Use of Unmanned Aerial Systems.” National Corn Growers Association, April 27, 2015. http://www.ncga.com/news-and-resources/news-stories/article/2015/04/ncga-submits-comments-to-federal-agencies-regarding-use-of-unmanned-aerial-systems.
National Corn Growers Association. "UAS: Good for Farmers, Consumers and the Environment." October 20. 2015. http://www.ncga.com/news-and-resources/news-stories/article/2015/10/uas-good-for-farmers-consumers-and-the-environment
National Park Service. “Aviation: Unmanned Aerial Systems | U.S. National Park Service.” Accessed November 17, 2015. http://www.nps.gov/fire/aviation/safety/unmanned-aerial-systems.cfm. ———. “Mission, Vision, and Value Statement - United States Park Police (U.S. National Park Service).” Accessed November 17, 2015. http://www.nps.gov/subjects/uspp/mission-statement.htm.
NAV Canada. “NAV CANADA: About Us - Vision, Mission & Objectives.” Accessed November 18, 2015. http://www.navcanada.ca/EN/about-us/Pages/vision.aspx.
Neubauer, Kenneth, National Research Council (U.S.), Transportation Research Board, Airport Cooperative Research Program, United States, and Federal Aviation Administration. Unmanned Aircraft Systems (UAS) at Airports: A Primer, 2015.
Paczan, Nathan M., Joshua Cooper, and Eric Zakrzewski. “Integrating Unmanned Aircraft into NextGen Automation Systems.” In Digital Avionics Systems Conference (DASC), 2012 IEEE/AIAA 31st, 8C3–1. IEEE, 2012.
Pilkington, Ed. “Amazon Tests Delivery Drones at Secret Canada Site after US Frustration.” The Guardian, March 30, 2015, sec. Technology. http://www.theguardian.com/technology/2015/mar/30/amazon-tests-drones-secret-site-canada-us-faa.
Pramuk, Jacob. "Drone Start-up Flying High after Big Win in DC." CNBC, September 30, 2015. http://www.cnbc.com/2015/09/29/drone-start-up-flying-high-after-big-win-in-dc.html
Scribner, Marc. “Comments of the Competitive Enterprise Institute,” November 6, 2015.
Sheehan, Martin F., and Michael Parrish. “Regulation of Unmanned Aerial Vehicles (‘Drones’) in Canada | Publications |.” Fasken Martineau. Accessed November 18, 2015. http://www.fasken.com/drones-canada/.
Simonite, Tom. "FAA Will Test Drones' Ability to Steer Themselves Out of Trouble." MIT Technology Review, November 13, 2015. http://www.technologyreview.com/news/543456/faa-will-test-drones-ability-to-steer-themselves-out-of-trouble/
The MITRE Corporation. “Mission and Values.” The MITRE Corporation. Accessed November 18, 2015. http://www.mitre.org/about/mission-and-values.
Transportation Research Board. “Overview | ACRP.” Accessed November 18, 2015. http://www.trb.org/ACRP/ACRPOverview.aspx.
US Congress. (2012) "Public Law 112-95. FAA Modernization and Reform Act." Washington: GPO.
US Department of Defense. “About Department of Defense.” Accessed November 16, 2015. http://www.defense.gov/About-DoD.
US Department of Defense. (2013) "Unmanned Systems Integrated Roadmap." Washington: DOD.
US Forest Service. “What We Believe | US Forest Service.” Accessed November 17, 2015. http://www.fs.fed.us/about-agency/what-we-believe.
Warwick, Graham. "FAA Backs Research Into Extending Small UAS Operations." May 8, 2015.
Warwick, Graham. "First Interim Standards for Unmanned Aircraft Unveiled." Aviation Week, October 6, 2015.
Warwick, Graham. "FAA's UAV Registration Task Force Moves Forward." Air Transport World, November 3, 2015.
Warwick Graham. "Optionally Piloted K-Max Offers Firefighting Flexibility." Aviation Week and Space Technology, November 5, 2015.
Warwick, Graham. "Cellular Technology, Challenges At Heart of Small UAS Plans." Aviation Week and Space Technology November 13, 2015.
Virginia.gov. “Governor - Governor McAuliffe.” Accessed November 18, 2015. https://governor.virginia.gov/about-the-governor/governor-mcauliffe/. ———. “Governor - Newsroom.” Accessed November 18, 2015. https://governor.virginia.gov/newsroom/newsarticle?articleId=8593.
Endnotes
[edit | edit source]
Arlington Streetcar
Summary
[edit | edit source]Improving public transit along Columbia Pike has been a priority for Arlington County since the late 1990s. This is due to several key factors facing Arlington (and Fairfax as well). Columbia Pike is expected to experience significant growth in both population (projected to increase by 21 percent from 2010 to 2030) and employment (projected to increase by 23 percent).[130]
To accommodate this expected growth – and in accordance with Arlington County’s stated policy against expanding automobile capacity and major new street capacity[131] – the County began considering Arlington Streetcar as one alternative among several in 2005. The Arlington Streetcar is only one component of a larger streetcar system that also involves a Fairfax component. In fact, the Streetcar stretches from the Skyline area of Fairfax County to Pentagon City in Arlington County.
This case study provides an overview of the Arlington Streetcar project, including a timeline of key events, actors, history and background, and examines the major policy issues analyzed by local decision-makers to evaluate and decide on the Streetcar as the locally preferred alternative.
Timeline of Events
[edit | edit source]- January 1998 - Columbia Pike Initiative Begins
- March 2002 - Columbia Pike Initiative Plan Unveiled
- December 2002 - Revitalization District Expanded
- February 2003 - Commercial Form Based Code Adopted
- February 2004 - Street Planning Task Force Shares Recommendations
- July 2005 - Modified Streetcar Alternative Recommended
- January 2006 - Counties (Arlington and Fairfax) Agree on Streetcar Plan
- January 2009 - Environmental Assessment Conducted
- October 2010 - VDOT Transfers Columbia Pike to Arlington
- July 2012 - Neighborhoods Area Plan Adopted - Streetcar Named Locally Preferred Alternative
- March 2014 - Streetcar Return on Investment Study
- May 2014 - Arlington and Fairfax County choose Parsons Transportation Group for streetcar program management team
- May 2014 - Arlington County released updated ridership forecasts
- July 2014 - Arlington County Board approved a $2.7-billion 10-year Capital Improvement Plan (CIP) for Fiscal Years 2015-2024, including $268,121,000 for streetcar project.
- July 2014 - Virginia DOT Increases Streetcar Funding Up to $65 Million
Maps of Locations
[edit | edit source]Annotated List of Actors
[edit | edit source]Arlington & Fairfax County - Arlington County Board and Fairfax Board of Supervisors, the county’s various departments, and the advisory boards and commissions have been involved in all aspects of the Columbia Pike Streetcar project, from planning and development to outreach and marketing. Arlington County’s website has most of the relevant documentation related to the Columbia Pike Transit Initiative.[132]
Washington Metropolitan Area Transit Authority (WMATA) – The agency oversee current transit service throughout the Washington Metropolitan region, including in Arlington and Fairfax counties. WMATA helps coordinate bus service along Columbia Pike, an initiative called the Pike Ride (started in 2003). WMATA conducted the 2005 Columbia Pike Transit Alternatives Analysis and has been an instrumental partner in the development of the Columbia Pike Streetcar.[133]
Commonwealth of Virginia, Department of Rail and Public Transit (DRPT) & Department of Transportation (VDOT) – Both DRPT and VDOT are key players in the Columbia Pike Streetcar’s development, especially in terms of funding, guidance and implementation. Both agencies participate in the Streetcar Policy Committee. VDOT has provided vital funding to the project.[134]
Federal Transit Administration – FTA, in its rejection of the application for Small Starts funding for the streetcar project, paved the way for a funding application to its New Starts program.[135]
Businesses, civic associations, and property owners - A coalition, the Columbia Pike Revitalization Organization, advocated for adoption of the Commercial Form Based Code, an instrumental zoning code change to promote a more holistic vision of land use and development along the Columbia Pike corridor, and endorsed the Columbia Pike Streetcar.[136] Additionally, the Columbia Pike Street Space Planning Task Force, comprised of similar groups, eventually recommended the Streetcar option.
Consultants – HR&A Advisors conducted a Return on Investment (ROI) analysis of the project for Arlington County.[137] Parsons Transportation Group will manage its implementation.[138] HDR Engineering will begin engineering and design work.[139]
Advocacy groups and media- Arlington Street Car Now, Coalition for Smart Growth, Arlingtonians for Sensible Transportation, Arlnow.com, the Patch, GreaterGreaterWashington, Blue Virginia and other community groups, blogs and media have helped shape public opinion about the streetcar.
Background
[edit | edit source]Streetcars played an integral role in transit history, as they were used extensively from the late 1800s to the mid-1900s to move passengers within the inner cities and from suburbs to inner cities. But what exactly is a streetcar? In Europe, streetcars are referred to as trams, and defined as a rail vehicle which runs on tracks along public urban streets (called street running), and also sometimes on separate rights of way.[140]
The American Public Transportation Association (APTA) defines streetcars as a “type of light rail transit, operating singly (or in short, usually two-car, trains) on fixed rails in right-of-way that is not separated from other traffic for much of the way. Light rail vehicles are typically driven electrically with power being drawn from an overhead electric line via a trolley or a pantograph.”[141]
Since the 1950s, when most streetcar systems met their demise, the streetcar has experienced a significant resurgence in many metropolitan areas around the United States, a result of renewed interest in transit oriented development and transit options.[142] Arlington County is already considered a leader in using the Metro system to leverage well-planned development, and has been recognized by the National Academy of Sciences as one of the nation’s best transit oriented development success stories.[143]
Nor are streetcars a new phenomenon in Arlington. During World War I, Arlington’s Rosslyn and Nauck neighborhoods were connected by a streetcar through Fort Myer, crossing Columbia Pike at Walter Reed and Four Mile Run Drives. The streetcar stop at the intersection of Columbia Pike and Walter Reed Drive became the focal point of early commercial development.[144]
In present day Arlington, the streetcar concept returned as part of The Columbia Pike Initiative – A Revitalization Plan, a study that began in 1998 and culminated with a board-approved report in 2002 and an update in 2005. This study brought together the experience and expertise of Arlington County’s board, various departments and advisory bodies, DRPT, VDOT, WMATA, the Columbia Pike Revitalization Organization and other interested organizations and citizens. The group had a vision to transform Columbia Pike into the Main Street of South Arlington. The group sought to redefine the concept of “street,” a vision driven by the adoption of the Commercial Form Based Code in 2003. The idea of a street as more than just a travel way for vehicles was the result and Columbia Pike, in fact, was shared by pedestrians, bicyclists, transit riders, and others. The plan called for further discussions on high capacity forms of transit, including a streetcar.[145]
WMATA led the Pike Transit Initiative, initiated in 2002, working closely with Arlington and Fairfax Counties, DRPT and VDOT, to study alternatives for transit along Columbia Pike. The Pike Transit Initiative issued its 2005 Alternatives Analysis (AA), a study of four transit alternatives for Columbia Pike, including a No Build Alternative, Bus Rapid Transit, Streetcar, and Modified Streetcar. The Pike Transit Initiative eliminated the use of Light Rail, Heavy Rail, Automated Guideway Transit, Diesel Multiple Unit and Monorail, citing feasibility issues operating on surface streets in the dense urban environment.[146] The Pike Transit Initiative endorsed the Modified Streetcar as the locally preferred option.[147]
In 2006, the Fairfax County Board of Supervisors and Arlington County Board voted to endorse the Modified Streetcar as the locally preferred alternative. The Columbia Pike Streetcar experienced a significant setback in 2008 when the Virginia Supreme Court invalidated the local funding source for the project. As a result, Arlington and Fairfax Counties decided to seek federal funding through the Federal Transit Administration, requiring a federally approved Alternatives Analysis-Environmental Assessment (AA/EA). For the 2012 AA/EA, four transit alternatives were studied including the No Build Alternative, Enhanced Bus Alternative (TSM-1), Articulated Bus Alternative (TSM-2) and Streetcar Alternative and once again the study concluded that the Streetcar was the local preferred alternative.[148]
Current Status
[edit | edit source]VDOT Secretary Aubrey Lane, in a letter dated July 10, 2014, promised to increase the state’s commitment of funding for the streetcar project, providing up to $65 million for the project as well as making it eligible for up to 30% in state matching funds.[149] On September 23, 20014, the Arlington County Board, in a 3-2 vote, awarded the engineering and design contract for the Columbia Pike Streetcar, worth approximately $26 million, to HDR Engineering. Preliminary design plans will be developed for the Columbia Pike and Crystal City-Potomac Yard streetcar segments and technical specifications for the streetcar vehicles, including 30 percent design plans for the roadway, track alignment, power, signals, stations and facilities; vehicle specifications; and updated construction cost estimates.[150]
Policy Issues
[edit | edit source]Accessibility and Mobility
[edit | edit source]Based on a review of the transit alternatives analysis in the 2005 Columbia Pike Transit Alternatives Analysis, the Modified Streetcar was not a clear winner in this category. In some cases, when compared to the other alternatives, the streetcar performed worse.
The Pike Transit Initiative, which conducted the alternatives analysis in 2005 through the forecast year 2030, evaluated the effectiveness of each alternative against criteria including:
- Corridor Transit Travel Time – the change in travel time to activity centers
- Accessibility - the ability to serve population and employment centers.
- Ridership - the ability to attract riders.
- Traffic Conditions- the effect on traffic along the corridor[151]
The Modified Streetcar Alternative’s “measure of effectiveness” equaled or in some cases measured less effective than the other build options (BRT and Streetcar) in the Pike Transit Initiative’s analysis. In terms of ridership, two examples that represent a divergent outcome from the analysis of other build alternatives include the measurements for total daily ridership and transit passenger capacity.
Excerpted from Table 5.1, 2005 Alternatives Analysis [152][153]
| BRT Alternative | Streetcar | Modified Street Car | |
|---|---|---|---|
| Total Daily Transit Ridership along the corridor | 22,490 | 23,080 | 20,670 |
| Transit Passenger Capacity per hour (peak hour, peak direction) | 2,540 | 3,100 | 2,360 (6 min. headway) 1,990 (12 min. headway) |
In the 2005 report, WMATA explained its analysis of the Modified Streetcar regarding the total projected corridor ridership, stating:
“the alignment for the Modified Streetcar Alternative is approximately one mile shorter and terminates at Pentagon City. Unlike the Streetcar Alternative, the Modified Streetcar Alternative does not provide streetcar service to the Pentagon, which explains a significant portion of the difference in ridership between the alternatives.”[154]
The analysis of the Modified Streetcar improved significantly upon a review of the 2012 Alternatives Analysis/Environmental Assessment (AA/EA) and the winner was clear: the Streetcar remained the locally preferred alternative. In the 2012 analysis of the build alternatives (TSM 1 – Enhanced Bus, TSM 2 – Articulated Bus and Streetcar), 2030 total daily ridership forecasted was:
Excerpted from Table 5.2-1, 2012 Alternative Analysis [155] [156]
| TSM 1 Enhanced Bus | TSM 2 Articulated Bus | Streetcar | |
|---|---|---|---|
| 2030 Transit Ridership (total avg weekday for Metrobus/ streetcar and ART) | 25,000 | 28,900 | 30,500 |
| Transit Passenger Capacity (peak hour, peak direction) | 2,073 | 2,654 | 2,802 |
Of the four project goals and objectives the Streetcar Alternative was comparable to the TSM 2 – Articulated Bus for the following: improving mobility for corridor residents, employees, customers and visitors, and supporting development of an integrated regional multimodal transportation system.[157]
Multimodal Transportation Integration
[edit | edit source]In the 2005 analysis of Multimodal Transportation Integration, WMATA looked at the effectiveness of each build alternative in meeting the goal of Regional Transit Travel Time. This goal was measured by two criteria: the percentage of improvement in transit travel time to select regional activity centers and regional employment accessible by transit in less than 60 minutes. The Modified Streetcar was comparable to BRT and Streetcar in terms of transit time travel and regional accessibility to employment.[158]
The Streetcar Alternative, according to the 2012 report, was also comparable to TSM-2 Articulated Bus in meeting the following project objectives: providing enhanced connections to intermodal centers; providing improved service to regional activity centers; and increasing transit ridership and mode share.[159]
In 2005 and 2012, multimodal transportation integration did not seem to play a major role in the decision in favor of the Modified Streetcar as the locally preferred alternative. From the details in each report, each of the "build alternatives" would enhance multimodal transportation integration more than the “no build option” and therefore are preferred.
Critique
[edit | edit source]Peter Rousellot, a prominent streetcar opponent, wrote a 2012 analysis about the streetcar. On the issues of accessibility and mobility, he argues that BRT can provide the same service frequency and span (time of day, days of week) service; is faster since there would be fewer stops, signal priority, and no-step, no gap boarding/alighting; and provide faster and more reliable speeds.[160] The arguments, however, seem to reconfirm the findings of the 2005 Alternatives Analysis and provide no additional new data.
The Cato Institute also challenges the ridership capacity of streetcars compared to BRT. In its analysis, Cato cites the Portland streetcar as an example, which has a seated capacity of 39 compared to 43 seats on a 40-foot bus. The Portland streetcar, however, is supposed to have 103 standing person capacity, referred to by Cato as the “crush capacity.” Cato does not refute this figure, but states that “Americans are not likely to accept crush conditions; actual standing room capacity on a streetcar is closer to about 50 people.”[161]
Environment/Sustainability
[edit | edit source]The County’s decision on transit options was influenced by the effects of increased energy requirements. The streetcar would run on electrical power provided by Dominion Electric Power, which is produced in large part from coal burning and nuclear energy. Coal was used for 35 percent of the electricity generated by Dominion Virginia Power in 2010, with a meager 1 percent coming from renewable resources. Energy consumption through the No Build Alternative would have no negative impacts to the current electric demands by the County, as existing transit service on the corridor would continue as normal. The Articulated Bus alternative would increase energy consumption at a minimal rate, as bus service along the corridor would increase, burning more compressed natural gas (CNG); the primary source of fuel for that system.[162]
The use of Streetcars would require the most electricity from Dominion Virginia Power, since they would be operated using overhead contact systems powered by substations located roughly every mile along the corridor. Although energy output would increase, the emissions from CNG would decrease due to the reduction in number of buses.
The County also did a study on maximum carbon monoxide emissions per hour for the streetcar and alternatives. They predicted carbon monoxide output in parts per million (ppm) for one hour and 8 hours on the corridor’s two busiest intersections; Seminary Road and George Mason Drive in Fairfax County, and Army Navy Drive and Eads Street in Arlington County. The County made projections for 2016 and 2030 and in these projections there is little difference between the emission levels of the streetcar and its alternatives.[163]
Another metric the County evaluated was Regional Vehicle Miles Travelled (VMT). They calculated that, under the baseline, in 2016 the VMT on an average weekday would be 141 million miles, growing to about 160 million by 2030. In comparison, the Articulated Bus alternative is projected to reduce the VMT on an average weekday by 13,700 miles in 2016 and 15,200 miles in 2030. However, the streetcar is projected to reduce the average weekday VMT by 16,300 miles in 2016 and 18,700 miles in 2030.[164] This gives the streetcar an advantage over the BRT alternative by 2,600 less miles in 2016 and 3,500 less miles in 2030.
As mentioned, energy consumption for transit in Virginia is a point of contention as a significant amount is produced from coal and nuclear sources. The often-cited Portland streetcar, by contrast, produces fewer emissions, as Oregon’s energy source stem in large part from renewable resources, primarily hydroelectric power. According to the U.S. Energy Information Administration, in 2010 Oregon’s total electric industry was powered by 55.4 percent hydroelectric power, with an additional 8.6 percent powered by other renewable resources. In the same report Virginia’s electric industry used only 2.1 percent hydroelectric power and 3 percent other renewable resources.[165]
Safety
[edit | edit source]In terms of safety, one way to review performance of streetcar versus motorbus service is by comparing accident statistics of different modes of transit. The FTA compiled statistics in 2007 for the total amount of incidents by light rail and motorbus. The results were standardized by mileage of each mode and also included collisions (vehicles, objects, and pedestrians), injuries, and derailments/ running off the road. In one year, the total incidents by motorbus were 11,053 compared to 983 by light rail. Collisions by motorbus and light rail were 7,186 and 577 respectively. Injuries sustained by motorbus were higher as well; 12,859 compared to 838 on light rail. Light rail only lagged behind motorbus in number of derailments/ running off the road incidents with 56 versus 47.[166] However, with all of these metrics considered, the streetcar holds some advantages in safety performance.
| Category | Motorbus | Light Rail |
|---|---|---|
| Total Accidents | 11,053 | 983 |
| Collisions (vehicles, objects, pedestrians) | 7,186 | 577 |
| Injuries | 12,859 | 838 |
| Derailments | 47 | 56 |
The County notes that competition with bicyclists is a concern. One of the issues presented by streetcar tracks is the gap in the tracks for the wheel flanges. This can be problematic for bicyclists as narrow tires can get stuck in the gaps. This problem has become significant enough in Portland that the City Council is proposing a grant for $150,000 to study ways of mitigating bicycle accidents along its streetcar lines.[168] The Arlington Bicycle Advisory Committee has voiced concerns about the dangers of streetcar tracks to bicyclists, although they have not taken an official stance against the project.[169] The County has proposed several methods to mitigate these risks, including awareness and information campaigns, special signage, and lane markings to assist those crossing or approaching the tracks.[170]
Cost
[edit | edit source]Advocates promote streetcars for providing many of the transit-oriented development benefits of rail systems at an order of magnitude less cost than metro/subway systems – while critics counter that streetcars tend to be an order of magnitude more expensive than enhanced bus service.
The proposed Arlington Streetcar is no exception. Arlington’s analysis estimated capital construction costs at $4-47 million for two different improved bus alternatives vs. $214-231 million for 3 different streetcar alternatives.[171] By comparison, the recent Metro Silver line development of service to 4 new stations cost an estimated $3.14 billion.[172]
Streetcar vehicles alone would cost about $51 million, with other major costs including:
- $33-43 million for system and track elements
- $30-33 million for professional services;
- $29-39 million for systems;
- $21-22 million for unallocated contingency
The 2012 report does not define these costs in detail. Arlington’s 2005 report, however, notes that system costs include overhead contact system (OCS), guideway systems, substations, switching, protection, rectifier-transformers, feeder, grounding and bonding systems, batteries and chargers, local and/or remote controls, and equipment supervision.[173]
Estimated operations and maintenance costs are more comparable among the alternatives: $22-23 million for the bus alternatives vs. $22-29 million for the streetcar options (2016 estimates).
Clearly, cost alone is not an argument for the Arlington Streetcar. Key to the argument, however, is projected return on this investment.
Economic Development
[edit | edit source]The most powerful selling point for the Arlington Streetcar is its potential to spur economic development along the Columbia Pike corridor. Is this project indeed likely to catalyze development of a high enough level to justify its greater cost?
Arlington County commissioned a report by the consulting firm HR&A Advisors, Columbia Pike Transit Initiative: Comparative Return on Investment Study, published March 2014 (hereafter, “the ROI report”).[174] This report estimated benefits of the proposed streetcar project in comparison to the other alternatives identified, based on studies of the impacts of bus, streetcar and light rail projects in other urban and suburban areas.
The ROI report argues strongly for the projected economic benefits of the Arlington Streetcar, as opposed to enhanced bus or status quo alternatives, estimating:
- Net incremental benefits over 30 years of $2.2-3.0 billion beyond enhanced bus options, and $3.2-4.4 billion above baseline
- 4,600 additional jobs in the corridor above enhanced bus service, and 6,600 new jobs above baseline within ten years of system completion
- $315-620 million in increased tax revenues over 30 years for Arlington and Fairfax Counties (from property, business/professional/occupational license, sales and meal taxes.)
These projected benefits are based on factors found in relation to other streetcar or light rail projects including:
- Appreciation in real estate values, comparing % increases in assessments of properties near the streetcar line with those in other areas.
- Increased quantity of development, measured in terms including dollars of new investment along the corridor and use of a higher percentage of allowable floor-area ratio (FAR).
Critique
[edit | edit source]While the literature on economic impacts of transit-oriented development (TOD) is significant, the recentness of the trend of streetcars returning to cities has limited the data available on the impacts of this transportation mode. As a result, the conclusions in the ROI report depend heavily on data on the impacts of the well-studied streetcar systems in Portland, OR and Seattle, WA – the representativeness of which are questionable.
The Center for Transit-Oriented Development noted in a study that the factors most attractive to developers are connections to downtown, a waterfront or historical area – which apply to the Portland and Seattle examples, but not to Columbia Pike. Positive factors that are present in Arlington, but not exclusive to Columbia Pike, include a strong real estate market and committed local government.[175]
Another problem with the analyses in the ROI report is the common failure to factor in the dollar value of government tax breaks and other incentives provided to developers, leading to potential inflation of the ROI of the investment in the streetcar alone.[176]
A final concern generally ignored in Arlington’s reports and planning documents is the impact development is likely to have on the unique multiethnic character of the Columbia Pike corridor – arguably one of its greatest assets. Fixed rail systems have been found to attract mostly white-collar industries like government, financial and scientific organizations.[177] The successful development of Columbia Pike, then, could make it more like such transit-oriented destinations as Bethesda, MD or Arlington’s Ballston to Courthouse corridor – attracting well-established chain stores and a wealthy clientele, but potentially losing ethnic grocery stores, restaurants and other establishments that may not be able to keep pace with rising rents.[178]
Conclusion
[edit | edit source]The Columbia Pike corridor is in need of revitalization and the Arlington Streetcar project is an ambitious initiative to address this need. Several other areas, including Portland, OR and Seattle, WA have documented success in revitalizing areas where new streetcar systems were introduced. Another potentially attractive option – BRT – does not appear practical on Columbia Pike’s narrow lanes.
However, the Columbia Pike project leaves a number of critical questions unanswered, including those listed in the Discussion Questions below. It is not clear if the analogies of Portland and Seattle will hold in the case of Columbia Pike, or what additional policies and incentives will be needed to drive development in addition to a streetcar.
Overall, there are many uncertainties regarding the potential benefits of this streetcar and whether they will ultimately justify the cost when compared to potentially cheaper enhanced bus alternatives. On many criteria – mobility, safety, environmental impact – the streetcar option seemed comparable or only marginally better than the enhanced bus alternatives.
Clearly, while a streetcar can be the centerpiece of a community development plan, it should not be viewed as a magic wand – many other policies and factors are essential to successful neighborhood revitalization. As streetcars increasingly return to urban areas, more research is needed to weigh the full impact of their costs and benefits.
Discussion Questions
[edit | edit source]- Do you predict that the Streetcar will turn out to be a "Magic Bullet" that will drive the economic revitalization of Columbia Pike?
- Are there other key components that are missing from the Arlington Streetcar to ensure its success? For example, what additional incentives (e.g., tax breaks) will be needed for successful development along this corridor?
- Has Arlington made the case effectively for the streetcar, or can you identify any gaps in the County's reasoning?
- All in all, do you believe that the benefits of the streetcar outweigh its costs (vs. enhanced bus alternatives), or not?
Additional Readings
[edit | edit source]- Arlington County Government. (2012). Columbia Pike Transit Initiative Alternatives Analysis/Environmental Assessment – Executive Summary. http://arlingtonva.s3.amazonaws.com/wp-content/uploads/sites/31/2014/07/DES-Columbia-Pike-Streetcar-AA_EA-Executive-Summary.pdf (8 pgs)
- Belzer, D., Srivastava, S., Wood, J. and Greenberg, E. (2011). Transit-Oriented Development (TOD) and Employment. Center for Transit-Oriented Development. http://reconnectingamerica.org/resource-center/browse-research/2011/transit-oriented-development-tod-and-employment/Reading: Exec Summary only (web home page)
- HR&A Advisors. (2014). Columbia Pike Transit Initiative: Comparative Return on Investment Study. http://sites.arlingtonva.us/streetcar/files/2014/03/HRA-Draft-County-Management-Working-Paper-3-26-2014.pdf Reading: Exec Summary only (p. 4-8)
- Hook, W., Lotshaw, S. and Weinstock, A. (2013). More Development for Your Transit Dollar: An Analysis of 21 North American Transit Corridors. Institute for Transportation and Development Policy (ITDP). https://www.itdp.org/more-development-for-your-transit-dollar-an-analysis-of-21-north-american-transit-corridors/ Reading: Exec Summary only (p. 7-9)
- O’Toole, Randal. (2012). The Great Streetcar Conspiracy. Policy Analysis, no. 699. http://www.cato.org/Publications/policy-analysis/great-streetcar-conspiracy (20 pgs)
- Golem, R., Smith-Heimer, J., National Research Council (U.S.), Transportation Research Board, Transit Cooperative Research Program, United States, … Transit Development Corporation. (2010). Relationships between streetcars and the built environment. Washington, D.C.: Transportation Research Board. http://onlinepubs.trb.org/onlinepubs/tcrp/tcrp_syn_86.pdf
References
[edit | edit source]- ↑ Mid-Atlantic Aviation Partnership. "The Virginia/New Jersey/Maryland UAS Test Site" Presentation at FAA UAS Test Site Public Meeting, August 24, 2015, p. 3.
- ↑ Aaren Karp. "FAA Nightmare: A Million Christmas Drones." Aviation Daily, September 28, 2015.
- ↑ United States Government Accountability Office. "Unmanned Aerial Systems: FAA Continues Progress toward Integration into the National Airspace." Washington: GAO, July 2015, p. 4.
- ↑ Tom Simonite. "FAA Will Test Drones' Ability to Steer Themselves Ot of Trouble." MIT Technology Review, November 13, 2015.http://www.technologyreview.com/news/543456/faa-will-test-drones-ability-to-steer-themselves-out-of-trouble/
- ↑ | United States Senate Committee on Appropriations,“Transportation, Housing and Urban Development, and Related Agencies,"accessed Nov 13, 2015,http://www.appropriations.senate.gov/subcommittees/transportation-housing-and-urban-development-and-related-agencies.
- ↑ United States Senate Committee on Appropriations,"Integrating Unmanned Aircraft Systems Technology into the National Airspace System," accessed Nov 13, 2015,http://www.appropriations.senate.gov/subcommittees/transportation-housing-and-urban-development-and-related-agencies.
- ↑ House Committee on Transportation, "Aviation | U.S. House of Representatives,"accessed November 16, 2015, http://transportation.house.gov/subcommittees/subcommittee/?ID=107417.
- ↑ Ibid
- ↑ Ibid
- ↑ US Government Accountability Office, "About GAO,"accessed November 12, 2015,http://www.gao.gov/about/index.html/
- ↑ Ibid
- ↑ United States Government Accountability Office.“GAO-15-610, Unmanned Aerial Systems: FAA Continues Progress toward Integration into the National Airspace.” Washington DC, July 2015. http://www.gao.gov/assets/680/671469.pdf, p.2
- ↑ Congressional Research Service (Library of Congress, "About CRS,"accessed November 16, 2015, http://www.loc.gov/crsinfo/about/
- ↑ Ibid
- ↑ Bill Canis, Congressional Research Service,"Unmanned Aircraft Systems (UAS): Commercial Outlook for a New Industry", accessed November 16, 2015, http://www.loc.gov/crsinfo/
- ↑ US Department of Transportation Office of Inspector General,"About OIG,"accessed November 16, 2015,https://www.oig.dot.gov/about-oig/
- ↑ Ibid
- ↑ US Department of Transportation Office of Inspector General,"Audit Announcement- FAA’s Approval and Oversight Processes for Civil Unmanned Aircraft Systems Federal Aviation Administration ,"accessed November 16, 2015,https://www.oig.dot.gov/sites/default/files/FAA%20Approval%20and%20Oversight%20Processes%20for%20UAS%20II%20-%20Audit%20Announcement%5E8-20-15.pdf
- ↑ Federal Aviation Administration,"Mission", accessed November 16, 2015,http://www.faa.gov/about/mission/
- ↑ FAA Joint Planning and Development Office,"Unmanned Aircraft Systems (UAS) Comprehensive Plan: A Report on the Nation’s UAS Path Forward",accessed November 16, 2015,http://www.faa.gov/about/office_org/headquarters_offices/agi/reports/media/uas_comprehensive_plan.pdf
- ↑ US Department of Defense, "About Department of Defense,"accessed November 16, 2015,http://www.defense.gov/About-DoD
- ↑ US Department of Defense, “Unmanned Systems Integrated Roadmap FY2011-2036,”accessed November 16, 2015, http://www.acq.osd.mil/sts/docs/Unmanned%20Systems%20Integrated%20Roadmap%20FY2011-2036.pdf,p.52
- ↑ Department of Homeland Security, "Our Mission,"accessed November 16, 2015, http://www.dhs.gov/our-mission
- ↑ Ibid
- ↑ Federal Bureau of Prisons, "BOP: Agency Pillars,"accessed November 17, 2015, https://www.bop.gov/about/agency/agency_pillars.jsp/
- ↑ John Goglia, Forbes,"US Seeks Drone Protection Technology for Federal Prisons,"November 6, 2015,http://www.forbes.com/sites/johngoglia/2015/11/06/us-seeks-drone-protection-technology-for-federal-prisons/
- ↑ US Forest Service, "What We Believe,"accessed November 17, 2015, http://www.fs.fed.us/about-agency/what-we-believe/
- ↑ National Parks Service, "Aviation: Unmanned Aerial Systems,"accessed November 17, 2015, http://www.nps.gov/fire/aviation/safety/unmanned-aerial-systems.cfm
- ↑ National Park Service,"Mission, Vision, and Value Statement,"accessed November 17, 2015, http://www.nps.gov/subjects/uspp/mission-statement.htm
- ↑ Peter Hermann & Candice Norwood,The Washington Post "Police cite District man after drone lands on Ellipse near White House," October 9, 2015, https://www.washingtonpost.com/local/public-safety/police-cite-two-people-after-drone-lands-on-ellipse-near-white-house/2015/10/09/0cfdc428-6e77-11e5-9bfe-e59f5e244f92_story.html
- ↑ National Aeronautics and Space Administration, "NASA Strategic Plan 2014,"2014, https://www.nasa.gov/sites/default/files/files/FY2014_NASA_SP_508c.pdf, p.2
- ↑ National Aeronautics and Space Administration, " NASA UTM: Convention 2015," assessed November 17, 2015, http://utm.arc.nasa.gov/utm2015.shtml
- ↑ NAV Canada, "NAV Canada About Us-Vision, Mission & Objectives,"accessed November 17, 2015,http://www.navcanada.ca/EN/about-us/Pages/vision.aspx
- ↑ Martin F. Sheehan & Michael Parrish,"Regulation of Unmanned Aerial Vehicles (“Drones”) in Canada,"accessed November 17, 2015, http://www.fasken.com/drones-canada/
- ↑ Transportation Research Board, "Overview ACRP,"accessed November 18, 2015, http://www.trb.org/ACRP/ACRPOverview.aspx
- ↑ Ibid
- ↑ Kenneth Neubauer, Transportation Research Board, Airport Cooperative Research Program, "ACRP Report 144: Unmanned Aircraft Systems (UAS) at Airports: A Primer,"2015, http://onlinepubs.trb.org/onlinepubs/acrp/acrp_rpt_144.pdf, p.1
- ↑ The MITRE Corporation, "Mission and Values,"accessed November 18, 2015, http://www.mitre.org/about/mission-and-values
- ↑ ,Nathan M.Paczan, Joshua Cooper, and Eric Zakrzewski,"Integrating Unmanned Aircraft into Nextgen Automation Systems,"September 2012, http://www.mitre.org/sites/default/files/pdf/12_3347.pdf, p.1
- ↑ Virginia.gov, "Governor McAuliffe,"accessed November 18, 2015, https://governor.virginia.gov/about-the-governor/governor-mcauliffe/
- ↑ Virginia.gov,Governor-Newsroom "Governor McAuliffe Signs Executive Order Launching Unmanned Systems Commission,"accessed November 18, 2015
- ↑ Ibid
- ↑ Mid-Atlantic Aviation Partnership (MAAP), "About Us-Mid Atlantic Aviation Partnership,"accessed November 18, 2015, http://www.maap.ictas.vt.edu/about-us-2/
- ↑ Ibid
- ↑ Virginia.gov,Governor-Newsroom "Governor McAuliffe Signs Executive Order Launching Unmanned Systems Commission,"accessed November 18, 2015
- ↑ Ibid
- ↑ Google, "About Google,"accessed November 18, 2015,https://www.google.com/about/
- ↑ Alan Levin, Bloomburg Business, "Google Wants a Piece of Air-Traffic Control for Drones,"July 24, 2015, http://www.bloomberg.com/news/articles/2015-07-24/google-has-way-to-unclog-drone-filled-skies-like-it-did-the-web
- ↑ Amazon, "Amazon.com,"accessed November 18, 2015, https://www.facebook.com/Amazon/info?tab=page_info
- ↑ Ed Pilkington, The Guardian, "Amazon tests delivery drones at secret Canada site after US frustration," March 30, 2015,http://www.theguardian.com/technology/2015/mar/30/amazon-tests-drones-secret-site-canada-us-faa
- ↑ Ibid
- ↑ Academy of Model Aeronautics, "What is AMA,"accessed November 20, 2015, http://www.modelaircraft.org/aboutama/whatisama.aspx
- ↑ Ibid
- ↑ International Drone Racing Association, "About IDRA,"accessed November 20, 2015, http://www.idra.co/#!about-us/epqm0
- ↑ IBid
- ↑ AUVSI, "Who is AUVSI,"accessed November 20, 2015, http://www.auvsi.org/home/learnmore
- ↑ Ibid
- ↑ Air Line Pilots Association, "What We Do,"accessed November 20, 2015,https://en.wikibooks.org/w/index.php?title=Transportation_Systems_Casebook/Integrating_drones_into_civil_aviation&action=edit§ion=26
- ↑ Know Before You Fly,"Air Line Pilots Association Joins “Know Before You Fly”,"October 1, 2015, http://knowbeforeyoufly.org/2015/10/air-line-pilots-association-joins-know-before-you-fly/
- ↑ Ibid
- ↑ Competitive Enterprise Institute,"About Competitive Enterprise Institute,"accessed November 20, 2015, https://cei.org/about-cei
- ↑ Ibid
- ↑ National Corn Growers Association, "Mission/Vision,"accessed November 20, 2015
- ↑ National Corn Growers Association,"NCGA Submits Comments to Federal Agencies Regarding Use of Unmanned Aerial Systems,"April 27, 2015, http://www.ncga.com/news-and-resources/news-stories/article/2015/04/ncga-submits-comments-to-federal-agencies-regarding-use-of-unmanned-aerial-systems
- ↑ https://www.eff.org/about
- ↑ About EPIC, https://epic.org/epic/about.html (2015).
- ↑ http://skypanintl.com/about_new.html
- ↑ ABC Chicago. "FAA Proposes Nearly $2 Million Fine Against Drone Operator." October 6, 2015.http://abc7chicago.com/news/faa-proposes-nearly-$2-million-fine-against-drone-operator/1019911/
- ↑ http://www.dji.com/company
- ↑ MSN. "Drone Maker Moves to Limit Flying Over Sensitive Areas." November 18, 2015.http://www.msn.com/en-us/money/technologyinvesting/drone-maker-moves-to-limit-flying-over-sensitive-areas/ar-BBn8vpe?li=AA4Zjn
- ↑ https://www.heliguy.com/dji-agras-mg-1-p3943
- ↑ https://www.faa.gov/uas/legislative_programs/test_sites/
- ↑ Federal Aviation Administration, “Integration of Civil Unmanned Aircraft Systems (UAS) in the National Airspace System (NAS) Roadmap”, accessed 16 November 2015, https://mymasonportal.gmu.edu/courses/1/XLSBO201570/groups/_112461_1//_4869909_1/FAA%20UAS_Roadmap_2013.pdf
- ↑ Ibid.
- ↑ Ibid.
- ↑ Ibid.
- ↑ Ibid.
- ↑ FAA. "Fact Sheet - Unmanned Aircraft Systems" p. 2.
- ↑ Electronic Privacy Information Center, "EPIC-EPIC v. FAA,"accessed November 23, 2015, https://www.epic.org/privacy/litigation/apa/faa/drones/
- ↑ Ibid
- ↑ Ibid
- ↑ Marc Scribner, "Comments of the Competitive Enterprise Institute,"November 6, 2015,p.1 https://cei.org/sites/default/files/Marc%20Scribner%20-%20FAA%20sUAS%20registration%20comments%20-%2011062015.pdf
- ↑ Ibid
- ↑ Ibid
- ↑ Federal Aviation Administration, "Fact Sheet-Unmanned Aircraft Systems," January 6, 2015,https://www.faa.gov/news/fact_sheets/news_story.cfm?newsId=14153
- ↑ Paul Misener, "Amazon Petition for Exemption," July 9, 2014,
- ↑ US Congress. "FAA Modernization and Reform Act of 2012." p. 1.
- ↑ Competitive Enterprise Institute, "Keeping the Skies Open for Drones." p. 1.
- ↑ Elaine Kauh. "SkyPan to FAA: Our Drone Flights Legal, Safe." AvWeb, October 15, 2015.
- ↑ EPIC v. FAA, March 31, 2015.https://epic.org/privacy/litigation/apa/faa/drones/EPIC-v-FAA-DC-Cir-Petition.PDF
- ↑ Graham Warwick. "FAA's UAV Registration Task Force Moves Forward." Air Transport World. November 3, 2015.
- ↑ NBC News. "FAA Urges Drone Registration Task Force to 'Think Outside the Box.' November 3, 2015.
- ↑ Aaron Karp. "FAA Nightmare: A Million Christmas Drones." Aviation Daily. September 28, 2015.
- ↑ John Croft, Aviation Daily," DOT: Register Your Drones or Face FAA Penalties," October 19, 2015, http://aviationweek.com/commercial-aviation/dot-register-your-drones-or-face-faa-penalties
- ↑ FAA. "Think Twice About 'Drone Registration' Firms. November 16, 2015.
- ↑ Aaron Karp. "Task Force: UAV Owners Should Register Name, Home Address with FAA." Air Transport World. November 23, 2015
- ↑ Marc Scribner. "Problems With Mandatory Drone Registration." Competitive Enterprise Institute. November 23, 2015.https://cei.org/blog/problems-mandatory-drone-registration
- ↑ EPIC To FAA: Proposed Regestration Requirements Fall Short.https://epic.org/2015/11/epic-to-faa-proposed-registrat.html
- ↑ Ibid.
- ↑ FAA, "Office of Inspector General Audit Report," accessed November 22, 2015, https://www.oig.dot.gov/library-item/31975
- ↑ Elaine Kauh. "FAA: Drone Rules Ready By June 2016." AvWeb. October 7, 2015.
- ↑ Marc Scribner. "Keeping the Skies Open for Drones." Competitive Enterprise Institute. October 14, 2015.
- ↑ Ibid.
- ↑ Ibid.
- ↑ Graham Warwick. "First Interim Standards for Unmanned Aircraft Unveiled." Aviation Daily. October 6, 2015.
- ↑ Linda Blachly. "FAA Proposes $1.9 Million Civil Penalty Against UAS Operator." Air Transport World. October 6, 2015.
- ↑ Peter Hermann and Candice Norwood. "Police Cite District Man After Drone Lands on Ellipse Near White House." The Washington Post, October 9, 2015.
- ↑ Alan Dron. "UK Fines UAV Operator for Flying Over Central London." Air Transport World. October 9, 2015.
- ↑ AaRon Karp. "NAV Canada CEO: 'Jail Time' Needed for Reckless UAV Operators. Air Transport World. November 8, 2015.
- ↑ FAA. "Press Release-Cities Hosting Papal Visits are No Drone Zones." September 15, 2015.
- ↑ Know Before You Fly, http://knowbeforeyoufly.org
- ↑ Sally French. "Drone Maker Moves to Limit Flying Over Sensitive Areas." MSN. October 19, 2015.
- ↑ http://transportation.house.gov/uploadedfiles/2015-10-07_-_aviation_ssm.pdf
- ↑ National Corn Growers Association. October 20, 2015.http://www.ncga.com/news-and-resources/news-stories/article/2015/10/uas-good-for-farmers-consumers-and-the-environment
- ↑ Flight Global. "NBAA: UAVs Find Their Place in Business Aviation." November 18, 2015.
- ↑ Ibid.
- ↑ Graham Warwick. "FAA Back Research Into Extending Small UAS Operations." Aviation Week and Space Technology. August 5, 2015.
- ↑ Michael Whitaker. "Statement Before House Subcommittee on Aviation." October 7, 2015http://transportation.house.gov/uploadedfiles/2015-10-07-whitaker.pdf
- ↑ Ibid.
- ↑ FAA. "FAA Expands Unmanned Aircraft Pathfinder Efforts." October 7, 2015.https://www.faa.gov/news/updates/?newsId=83927
- ↑ Tom Simonite. "FAA Will Test Drone's Ability to Steer Themselves Out of Trouble." MIT Technology Review. November 13, 2015.
- ↑ NASA. "UAS Traffic Management Conference." July 28-30, 2015.http://utm.arc.nasa.gov/utm2015.shtml
- ↑ NASA. "UTM Fact Sheet." July 28, 2015.http://utm.arc.nasa.gov/docs/UTM-Fact-Sheet.pdf
- ↑ Graham Warwick. "Cellular Technology, Challenges at Heart of Small UAS Plans." Aviation Week and Space Technology. November 14, 2015.
- ↑ Amazon. "Best-Equipped, Best Served Model for Small UAS." July 2015.http://utm.arc.nasa.gov/docs/Amazon_Determining%20Safe%20Access%20with%20a%20Best-Equipped,%20Best-Served%20Model%20for%20sUAS[2].pdf
- ↑ David Eschel and John M. Doyle. "UAV Killers Gain Role Against Growing Threat." Aviation Week and Space Technology. November 6, 2015.
- ↑ Ibid.
- ↑ Federal Bureau of Prisons. "RFI for Protection from Unmanned Air Vehicles." November 4, 2015.https://www.fbo.gov/index?s=opportunity&mode=form&tab=core&id=c1c13ff92dde7d9575ad0bc67716cb81&_cview=0
- ↑ Ibid.
- ↑ Columbia Pike Transit Initiative Alternatives Analysis/Environmental Assessment – Volume I, Page 1-4 (2012).
- ↑ Arlington County. (2011). Arlington County Transportation Master Plan Streets Element, p. 7.
- ↑ ("Streetcar Transit in Arlington', n.d.)
- ↑ WMATA presentation at APTA/TRB BRT Conference. (2006) PikeRide. Retrieved from https://www.wmata.com/pdfs/planning/ColumbiaPikeFinal%20August1-2006.pdf
- ↑ Letter from VDOT Secretary Aubrey Lane to Arlington and Fairfax County Boards. (2014). Retrieved from http://sites.arlingtonva.us/streetcar/files/2014/07/Columbia_Pike_Streetcar_Project_7-10-14.pdf
- ↑ Sullivan, P. (2013). Arlington streetcar plans will proceed despite federal rejection. The Washington Post. Retrieved fromhttp://www.washingtonpost.com/local/arlington-streetcar-plans-will-proceed-despite-federal-rejection/2013/04/23/49dbdee4-ac2c-11e2-b6fd-ba6f5f26d70e_story.html
- ↑ CPRO supports the Streetcar. (n.d.). Retrieved from http://www.columbia-pike.org/?p=2997
- ↑ Goddin, Paul (2014). Columbia Pike Streetcar Would Bring Billions to Arlington and Fairfax – Retrieved from http://mobilitylab.org/2014/03/27/columbia-pike-streetcar-would-bring-billions-to-arlington-and-fairfax/#sthash.iaRAgHc9.dpuf
- ↑ Press release - Arlington and Fairfax County Choose Streetcar Program Management Team. (2014). Retrieved from http://news.arlingtonva.us/releases/arlington-and-fairfax-county-choose-streetcar-program-management-team
- ↑ Press release - Arlington County Board Awards Streetcar Engineering Contract. (2014). Retrieved from http://news.arlingtonva.us/releases/arlington-county-board-awards-streetcar-engineering-contract
- ↑ Tram. (2014, October 2). In Wikipedia, the free encyclopedia. Retrieved from http://en.wikipedia.org/w/index.php?title=Tram&oldid=627892050
- ↑ Golem, R., Smith-Heimer, J., National Research Council (U.S.), Transportation Research Board, Transit Cooperative Research Program, United States, Transit Development Corporation. (2010). Relationships between streetcars and the built environment. Washington, D.C.: Transportation Research Board.
- ↑ LeRoy, G. (2012). Transit and Transit-Oriented Development: The Sweet Spot for Jobs. Retrieved September 29, 2014 from http://www.huffingtonpost.com/greg-leroy/transit-and-transitorient_b_1858703.html
- ↑ Arlington County Award from National Academy of Sciences (2009). Retrieved October 4, 2014 from http://departments.arlingtonva.us/planning-housing-development/planning-division/awards/
- ↑ Northern Virginia trolleys. (2014, September 10). Wikipedia. Retrieved from http://en.wikipedia.org/w/index.php?title=Northern_Virginia_trolleys&oldid=615738878
- ↑ Columbia Pike Initiative – A Revitalization Plan (2005). Retrieved from Columbia Pike Planning Timeline http://projects.arlingtonva.us/neighborhoods/columbia-pike-development-history/timeline/
- ↑ Columbia Pike Transit Alternatives Analysis Final Report Screening and Selection (2005). Washington Metropolitan Area Transit Authority. Page 3-5.
- ↑ Alternatives Analysis (2005) Executive Summary. WMATA. Section 1.4.
- ↑ Columbia Pike Transit Initiative Locally Preferred Alternative Report. (2012). Retrieved from http://arlingtonva.s3.amazonaws.com/wp-content/uploads/sites/31/2014/07/DES-Columbia-Pike-Streetcar-Locally-Preferred-Alternative-Report-7-16-2012.pdf
- ↑ Letter from VDOT Secretary Aubrey Lane to Arlington and Fairfax County Boards. (2014). Retrieved from http://sites.arlingtonva.us/streetcar/files/2014/07/Columbia_Pike_Streetcar_Project_7-10-14.pdf
- ↑ Press Release - Arlington County Board Awards Streetcar Engineering Contract (2014). Retrieved from http://news.arlingtonva.us/releases/arlington-county-board-awards-streetcar-engineering-contract
- ↑ Columbia Pike Transit Alternatives Analysis Final Report (2005): Section 5.1.3 Evaluation Criteria
- ↑ Columbia Pike Transit Alternatives Analysis Final Report Table 5-1: Evaluation Criteria and Measures of Effectiveness (2005). Washington Metropolitan Area Transit Authority.
- ↑ Columbia Pike Transit Alternatives Analysis Final Report Table 5-1: Evaluation Criteria and Measures of Effectiveness (2005). Washington Metropolitan Area Transit Authority.
- ↑ Columbia Pike Transit Alternatives Analysis Final Report Impact Selection and Screening, Page 6-16. (2005). Washington Metropolitan Area Transit Authority
- ↑ Columbia Pike Transit Initiative Alternatives Analysis/Environmental Assessment – Volume I, Table 5.2-1: The need to increase transit capacity and improve transit mode share (2012).
- ↑ Columbia Pike Transit Initiative Alternatives Analysis/Environmental Assessment – Volume I, Table 5.2-1: The need to increase transit capacity and improve transit mode share (2012).
- ↑ Columbia Pike Transit Initiative Alternatives Analysis/Environmental Assessment – Volume I, Table 5.4-2: Evaluation Synthesis: Project Goals. (2012).
- ↑ Columbia Pike Transit Alternatives Analysis Final Report Table 5-1: Evaluation Criteria and Measures of Effectiveness (2005). Washington Metropolitan Area Transit Authority.
- ↑ Columbia Pike Transit Initiative Alternatives Analysis/Environmental Assessment – Volume I, Table 5.4-2: Evaluation Synthesis: Project Goals (2012).
- ↑ A Modern Bus Rapid Transit (BRT) System is Far Superior to Streetcars in the Columbia Pike Corridor | Arlingtonians for Sensible Transit. Retrieved from http://www.sensibletransit.org/get-the-facts/brt/
- ↑ R, 14, al O. J., & 2012. (n.d.). The Great Streetcar Conspiracy. Retrieved from http://www.cato.org/Publications/policy-analysis/great-streetcar-conspiracy
- ↑ Columbia Pike Transit Initiative Alternatives Analysis/Environmental Assessment – Volume II, Pg. 88 (2012).
- ↑ Columbia Pike Transit Initiative Alternatives Analysis/Environmental Assessment – Volume I, Pg. 111-112 (2012)
- ↑ Columbia Pike Transit Initiative Alternatives Analysis/Environmental Assessment – Volume I, Pg. 59-60 (2012).
- ↑ State Electricity Profiles 2010, US Energy Information Administration, January 2010 Pg. 224, 279 (2010)
- ↑ Columbia Pike Transit Initiative Alternatives Analysis/Environmental Assessment – Volume I, Pg. 126 (2012).
- ↑ Columbia Pike Transit Initiative Alternatives Analysis/Environmental Assessment – Volume I, Table 3.15-1: Transit Safety and Security Findings (2007) Pg. 126 (2012)
- ↑ Redden, Jim “Are Portland Streetcar tracks dangerous for bicycles?”- Portland Tribune, April 14th, 2014
- ↑ Pyzyk, Katie, “Proposed Streetcar Raises Concerns Over Cyclist Safety”- ARLnow, July 19th,2012
- ↑ Columbia Pike Transit Initiative Alternatives Analysis/Environmental Assessment – Volume I, Pg. 126-128 (2012).
- ↑ Arlington County Government. (2012). Columbia Pike Transit Initiative Alternatives Analysis/Environmental Assessment. Volume I, Chapter 4.
- ↑ Washington Metropolitan Area Transit Authority. (2014). Metro News Release: Metro launches Silver Line, largest expansion of region's rail system in more than two decades. http://www.wmata.com/about_metro/news/PressReleaseDetail.cfm?ReleaseID=5749)
- ↑ Columbia Pike Transit Alternatives Analysis Final Report, Section 6.43-6.49. (2005). Washington Metropolitan Area Transit Authority
- ↑ HR&A Advisors. (2014). Columbia Pike Transit Initiative: Comparative Return on Investment Study. http://sites.arlingtonva.us/streetcar/files/2014/03/HRA-Draft-County-Management-Working-Paper-3-26-2014.pdf
- ↑ Hook, W., Lotshaw, S. and Weinstock, A. (2013). More Development for Your Transit Dollar: An Analysis of 21 North American Transit Corridors. Chap. 2, p. 38-53. Institute for Transportation and Development Policy (ITDP). http://www.itdp.org/more-development-for-your-transit-dollar-an-analysis-of-21-north-american-transit-corridors/)
- ↑ O’Toole, Randal. (2012). The Great Streetcar Conspiracy. Policy Analysis, no. 699. http://www.cato.org/Publications/policy-analysis/great-streetcar-conspiracy
- ↑ Belzer, D., Srivastava, S., Wood, J. and Greenberg, E. (2011). Transit-Oriented Development (TOD) and Employment. Center for Transit-Oriented Development. http://reconnectingamerica.org/resource-center/browse-research/2011/transit-oriented-development-tod-and-employment/
- ↑ Pollack, S., Bluestone, B., Billingham, C. (2010). Maintaining Diversity In America’s Transit-Rich Neighborhoods: Tools for Equitable Neighborhood Change. Northeastern University, Dukakis Center for Urban and Regional Policy.http://www.northeastern.edu/dukakiscenter/wp-content/uploads/2011/12/TRN_Equity_final.pdf
Tolling
Summary
[edit | edit source]The United States Interstate highway system, formally established in 1944 and funded in 1956, has evolved over many decades and grown to more than 46,000 road miles. While the Interstate system only accounts for one percent of the nation’s total highway mileage, it carries 24 percent of all highway traffic.[1] The Interstate system as authorized by the Federal-Aid Highway Act of 1956 (as amended) took nearly 50 years to complete and cost over $130 billion.[2]
The prohibition on Federal-aid highway tolling started with the Federal Aid Road Act of 1916. In 1956, Congress favored a tax-funded Highway Trust Fund rather than tolls to finance construction of the Interstate system. However, there has been increased interest in toll financing in periods when Federal funding has been limited. Due to the insufficient funds in the Highway Trust Fund and political resistance to raising taxes in recent years, interest in tolling has only continued to increase.[3]
This case study provides an overview of the proposal to expand Interstate system tolling, including a timeline of key events, actors, and a brief history of the Interstate system’s evolution, while examining the most recent policy proposal by the Administration as well as the benefits and drawbacks of expanded tolling.
Background
[edit | edit source]The evolution of the Interstate was a long process. During the late 19th century, the Office of Road Inquiry -- the Federal Highway Administration's (FHWA’s) early predecessor -- was established as demand for new and better quality roads grew. The first Federal Aid Road Act was passed by Congress in 1916, establishing the Federal-aid highway program and apportioning funding to States, with a 50/50 Federal/State match requirement, for construction of rural roads.[4] In the late 1930s, President Franklin Delano Roosevelt wanted to develop a national road network and initially thought it should be a “self-liquidating” system financed in part by tolls, meaning that the tolls would help pay for the cost of the roads in order to not adversely affect the Federal budget. His interest prompted Congress to ask the U.S. Bureau of Public Roads (as FHWA was then called) to review options for developing and funding a road network. The resulting report, Toll Roads and Free Roads (1939), argued against using toll financing to build an inter-regional system because most corridors would not generate enough toll revenue to retire the bonds issued to finance them. The report recommended a toll-free express highway network.[4][5]
However, the Pennsylvania Turnpike, a toll road, was an instant financial success when it opened in 1940. Based on Pennsylvania’s model, many states planned or built turnpikes after World War II, often in corridors that had been designated as part of the Interstate system in 1947. These roads were built without any Federal funding.[6]
Years later, President Eisenhower also wanted a self-liquidating national toll highway network; however, his advisors proposed a toll-free network based on bonds to be repaid by gas tax revenue. Similar to the Toll Roads and Free Roads report, President Eisenhower’s advisory committee determined that most corridors would not have enough traffic to pay for the bonds by tolling.[5][7] Thus, policy moved away from tolling before the establishment of the Interstate system. The Federal-Aid Highway Act of 1956 established the program to build the Dwight D. Eisenhower National System of Interstate and Defense Highways (the Interstate). This Act established the Highway Trust Fund (HTF), a source of gas tax-generated revenue dedicated to funding construction of the new Interstate system.[8]

Congress considered several options for the existing or planned turnpikes in designated Interstate corridors. One option was to pay off the bonds or to give the States credit for the cost of the turnpikes. Construction of parallel toll-free expressways was also considered. Ultimately, Congress decided to incorporate the turnpikes into the Interstate System rather than spend money on payback plans or build parallel highways that would divert money from other areas that needed Interstates.[9] This is the reason some segments of the Interstate have toll facilities.
Because the Interstate was paid for by Federal gas tax revenue through the HTF, a provision was established to prohibit tolling. Existing tolls on the turnpikes that were incorporated into the Interstate system were permitted to remain in operation, such as those on the Pennsylvania Turnpike and Florida’s Sunshine State Parkway. Today, there are almost 3,000 miles of toll roads in the Interstate system, largely on the East Coast.[10] Since the 1990s, some special programs have allowed states greater flexibility for tolling the Interstate, primarily for new construction, expansion projects and to use road pricing for congestion management (for example, High Occupancy Vehicle lanes).[11] The Moving Ahead for Progress in the 21st Century Act (MAP-21) further expanded tolling by easing requirements that states get Federal approval in those cases, but it maintained the basic principle of no tolling of existing toll-free Interstate capacity.[12]
Nearly 60 years since the Interstate was established, many of these highways are in need of rehabilitation, maintenance and reconstruction. As vehicle fuel efficiency increased and the Federal gas tax remained the same (18.4 cents per gallon) for over 20 years, the HTF has become depleted to the point of near-insolvency. Since 2008, Congress has transferred $54 billion to the HTF from the Treasury general fund, with an additional transfer of $10.8 billion in July 2014.[13][14] The Federal government and states are searching for funding and innovative financing mechanisms to pay for the maintenance, repair and reconstruction of the aging Interstate system and other transportation infrastructure. In the current political environment, increasing taxes to generate revenue has been a non-starter; however, states are increasingly seeking alternative funding mechanisms, such as expanded tolling.
Timeline of Events
[edit | edit source]- 1893 – The Federal government establishes the Office of Road Inquiry as demand for new and better roads grows.[15]
- 1916 – The first Federal-Aid Road Act establishes the Federal-Aid highway program and allocates funding for construction of rural roads.[4]
- 1939 – The Bureau of Public Roads, FHWA’s predecessor, sends the report Toll Roads or Free Roads to Congress. The report highlighted the need for an inter-regional highway system and recommended against toll roads.[5]
- 1940 – The Pennsylvania Turnpike, the “Granddaddy of the Interstate” is completed. This brand new toll road is a major success and exceeds traffic forecasts. It was the first modern toll highway and many other states started to emulate its model after World War II.[15]
- 1944 – The Bureau of Public Roads submits the Interregional Highways report to Congress recommending an express highway network with no tolls, which would be built under the Federal-aid Highway Program. Congress authorized the Bureau to work with States to designate the network.[5]
- 1947 – First designations of the Interstate system.[4]

- 1956 – On June 29, 1956, President Eisenhower signed the Federal-Aid Highway Act which provided for a national highway system designed to be tax-supported through establishment of the Highway Trust Fund. This network came to be known as the Dwight D. Eisenhower National System of Interstate and Defense Highways.[1]
- 1963 - The last of the toll roads that was planned before the Federal-aid highway system was legislated opens to travel.[15]
- 1973 – President Nixon signed the Federal-Aid Highway Act of 1973. One provision of the Act was for Interstate Withdrawal/Substitution. Under this provision, at the request of a Governor and local governments in urbanized areas of more than 50,000 in population, the Secretary could withdraw an Interstate segment if it was determined that the segment was not essential to completing a unified and connected Interstate system and state officials assured they would not build a toll road in the corridor. State and local officials could use an equivalent amount of substitute funds for mass transit projects, including rapid rail systems. (This alternative option was extended to highway projects in 1976.)[16]
- 2005 - SAFETEA-LU clarifies some aspects of the operation of HOV facilities and provides more exceptions to the vehicle occupancy requirements for High Occupancy Vehicle (HOV) facilities. It also authorizes States to create High Occupancy Toll (HOT) lanes. Specifically, States can charge tolls to vehicles that do not meet the established occupancy requirements to use an HOV lane if the State establishes a program that addresses the selection of certified vehicles and procedures for enforcing the restrictions. Tolls under this section may be charged on both Interstate and non-Interstate facilities.[15]
- 2008 – The first transfer of Treasury general funds is made to the Highway Trust Fund.[13]
- April 2014 – The Obama Administration's GROW AMERICA Act, the most recent surface transportation reauthorization proposal, is submitted to Congress by USDOT. The Act contains a provision that would "mainstream two existing tolling pilot programs, providing States additional flexibility to apply for authority to toll existing Interstate highways in order to make improvements or to manage congestion." The requests must be approved by the USDOT Secretary based on specific criteria.[17]
- Summer 2014 – The Highway Trust Fund is projected to be insolvent in August. In July, Congress authorizes a $10.8 billion transfer of Treasury funds to the HTF. The policy debates about how to fund transportation continue.[18][14]
- August 2014 – President Obama signs the Highway and Transportation Funding Act of 2014, which extends MAP-21 programs and the Highway Trust Fund through May 2015.[19]
Maps: Interstate Highways & Toll Facilities
[edit | edit source]
The Interstate highway system network contains about 47,000 miles of road.

The National Highway System (NHS) has 5 categories of roads: the Interstate highway system; high-priority corridors (including some existing Interstates); the non-Interstate portion of the Strategic Highway Corridor Network (STRAHNET); the Strategic Highway Corridor Network connectors; and other arterial highways. The Interstate system comprises about 30% of the NHS.[20]
The National Conference of State Legislatures (NCSL) produced a map showing toll facilities in the U.S., including road, bridge and tunnel toll facilities, and the type of operating entity. These include tolls on and off the Interstate system. NCSL determined that “42 states, the District of Columbia and Puerto Rico have some form of tolling authorization or facility. Of those:
- 28 states and Puerto Rico have toll facilities operated by statewide entities.
- 14 states have toll facilities operated by regional entities.
- 20 states and Puerto Rico have privately operated toll facilities.
- 9 states and the District of Columbia authorize tolling but have no state or regional toll facilities at this time.”[21]
Annotated List of Actors
[edit | edit source]President Franklin Delano Roosevelt – Interested in building a transcontinental road network and initially pondered financing it through tolls.[5]
President Dwight D. Eisenhower – Authorized the national Interstate highway system and funding for its construction in 1956.[22]
FHWA – Administers Federal-aid Highway Program funding to States.[23]
USDOT – Submitted the Obama Administration’s surface transportation authorization proposal, the GROW AMERICA Act, which includes a provision to allow States to expand tolling of the Interstate system with approval of the USDOT Secretary.[24]
Policy Issues
[edit | edit source]Tolling has both advantages and disadvantages. It is seen as a way to help provide funds for repairs, replacement, and new construction of the roadways. However, in order to provide enough funds, there would have to be a significant expansion of roadway tolling in the United States. Technology allows for more efficient collection, such as electronic tolling, in order to maximize the use of the highway and decrease delays in travel time. Some of the proposed tolling approaches, such as using transponders and license plate cameras that connect wirelessly to operation centers to ensure the transactions, have caused controversies among the public, and raised fears about invasion of privacy. However, there could be other ways to ensure data security if a similar system is implemented.
The main arguments in regards to the issue include the following: [25]
Pro's
[edit | edit source]- Public-Private Partnerships: Attracting business of the private sector to create public-private partnerships, given the high levels of traffic in many highways of the Interstate Highway System. The revenues from tolls could be used to fund improvements and capacity expansion.
- Funding for reconstruction: Many of the Interstate System highways and bridges are over 50 years old and need to be rebuilt at high cost. Since the Highway Trust Fund has not been sufficient to keep up with the cost of maintaining infrastructure, tolling can be a way to rebuild what is needed.
- Congestion mitigation: Dynamic pricing could be used on urban Interstates in order to price according to the time of the day and the amount of traffic, which can help in reducing congestion and providing the necessary funds to the maintenance/reconstruction needed for urban Interstates.
- Route options: Tolling provides drivers with more options, such as the choice of paying for the benefits of using a tolled facility with a more direct route or choosing a different route, which may take longer to reach a destination.
- Earlier repair and reconstruction: Tolling of the Interstate Highway System would allow for sufficient funds in order to repair/reconstruct the facilities at an earlier date than they would be by using Highway Trust Funds.
- Electronic toll collection: Electronic collection leads to significant declines in the operating costs of toll facilities and reduces congestion at toll booths.
In summary, advocates in favor of tolling propose that it can create a revenue source for infrastructure projects, can serve as a tool to address congestion, provide drivers with reliability of travel time, help with fuel consumption by maximizing gas mileage in free-flow, and use the highway to its full efficiency.
Con's
[edit | edit source]- The issue of double taxation, since Interstate highways were originally built with funds from taxes.
- Not all Interstate highway system facilities are suited to tolling, since many highways do not have high traffic volumes; therefore, it would not make sense for the private sector to invest since the return will not cover the costs and not generate profit.
- Tolls may negatively affect interstate commerce.
- Toll facilities require higher costs to operate.
- Tolls impact low-income drivers and do not give everyone an equal opportunity.
- There are unresolved issues, such as tolls at state borders and violation of interstate commerce clause, and different rates of tolling for Interstate and In-State toll users.
- Tolls affecting businesses located at Interstate highway exits.
- Tolls can cause traffic diversion [26]
- Tolls can impact Supply-Chains [27]
Current Law
[edit | edit source]Title 23 of the United States Code (highways) states a general prohibition of imposing tolls on Federal-aid highways. However, Title 23 and other statutes also specify exceptions to this general rule by describing special programs, which allow revenue from tolling to support highway construction, as well as the use of of road pricing to better manage congestion. In order to implement tolls on a Federally funded facility, the public authority must qualify for toll authority under one of the following main four Toll Programs: [28]
Mainstream Tolling Programs
[edit | edit source]The following two programs have no restrictions on the number of projects or the number of States receiving tolling authority. These programs do not require States or local public agencies to have a tolling agreement with the FHWA before imposing tolls.
Section 129 (General Toll Program)
[edit | edit source]Under this program, Congress allows imposing tolls on new highways, new lanes added to existing highways (as long as the number of existing toll-free lanes remain the same), reconstruction of highways (non-Interstate only), reconstruction or replacement of bridges or tunnels, and capital improvements to existing toll facilities.
Section 166 (HOV/HOT Lanes)
[edit | edit source]Section 166(c) of Title 23 allows tolling for vehicles that do not meet the occupancy standards to use high occupancy vehicle (HOV) lanes; these lanes as often referred to as high occupancy toll (HOT) lanes (including Interstate facilities).
Toll Pilot Programs
[edit | edit source]Since 1991 there have been tolling programs allowed on a pilot basis through different highway authorization acts. The number of slots available have been limited for each program. An application and execution of a toll agreement with FHWA is also required from project sponsors in order to be authorized to impose tolls under these programs.
The two pilot programs are:
Interstate System Reconstruction and Rehabilitation Pilot Program (ISRRPP)
[edit | edit source]This program allows the conversion of a free facility (Interstate highway) to a toll facility only if tolls are the only way to obtain the funds needed to reconstruct and rehabilitate the facility. There is a limit of three projects and they have to be in different States. There are strict guidelines that states must adhere to and all programs must be approved by the FHWA. As of January 2014, the three states and areas identified for this program are I-95 in North Carolina, I-95 in Virginia, and I-70 in Missouri.[29] Though the program was authorized in 1998, it has yet to be fully implemented, largely due to political pushback.
Value Pricing Pilot Program (VPPP)
[edit | edit source]This program allows for tolls to be imposed on existing toll-free highways, bridges, and tunnels, as long as variable pricing is used to manage demand. There is a limit of 15 value pricing programs that can be allocated to state or local agencies; seven out of the 15 programs have been exclusively allocated to States that already have agreements for tolling using this program. The rest of the vacant programs have been reserved temporarily for State agencies currently pursuing other activities that are eligible under the program (value pricing studies and value pricing projects that are non-tolled) If agency holds a slot, it has unlimited number of value pricing projects that can be implemented under that slot.
There are other restrictions and specifications to the use of toll revenue and operational performance requirements stated under the above mentioned programs. [30]
Tolling the Interstate Highway System is only part of the larger problem of the need to upgrade the U.S.'s transportation infrastructure, and the many barriers faced, which include: political figures unwilling to identify new infrastructure funding sources, using traditional funding models that are no longer effective (gas tax), a planning system that operates in stove-pipe-like systems between different levels of government, and different industries with different ideas and goals competing against each other. [31]
GROW AMERICA Act
[edit | edit source]A four year, $302 billion surface transportation re-authorization proposal developed by the Obama Administration that was released in April 2014. The proposal would give states more liberty in deciding whether to impose tolls on their Interstate highways, require all new tolling plans to have the approval of the U.S. Secretary of Transportation, and require repairs of existing roadways and bridges to have priority over other expansion projects. [32]
Narrative of the Case
[edit | edit source]For several years, the U.S. government has sought ways to increase revenue needed to pay for transportation infrastructure. Recently, lawmakers have given this issue a more serious look as the Highway Trust Fund (HTF) is on the verge of insolvency. Since the inception of the Interstate highway system, the Federal gasoline tax has been the primary means of funding highways and tolling has been prohibited. With the gas tax no longer able to adequately fund the HTF, the question becomes, what else can be been done to finance U.S. Interstates? One plan that has recently been discussed is expanding tolling on Interstate highways, however, this proposal is fairly controversial and may be difficult to achieve.

As mentioned earlier, one of the main reasons Interstate tolling has not been implemented in most states is political opposition. There are several different opinions, both for and against the proposed expansion of Interstate tolling. Critics of the plan have stated that “tolling existing interstates is extremely inefficient, creates bloated government bureaucracy, increases business and travel costs, and diverts traffic from tolled interstates onto local roads, accelerating road degradation and causing serious safety concerns.” [33] Others have voiced concern that tolling would cause double taxation since a gas tax has already been paid by drivers at the pump. The placements of toll facilities are also a source of debate. Depending on where the tolls are placed, “states may very well be tempted to toll the parts of their highways that are most likely to be used by out-of-towners.”[12] Further, "Interstate tolling tends to get support from the political center, while lawmakers who lean heavily to the left or the right have been the biggest opponents… liberal Democrats oppose it for populist reasons, arguing that it’s an onerous fee that low-income Americans can’t afford, while hardline conservatives oppose it as just another expensive government-imposed fee.”[12]
Supporters of Interstate tolling say that roads are never truly paid for and are in constant need of repair. Tolling roads is another way to generate much needed funds to make the constant repairs needed year after year. As for drivers avoiding highways in order to avoid paying tolls, one study found that “despite the financial reasons for having toll systems in place, it is important to recognize that people do not appear to change their driving behavior in response to tolls.”[34] Work by Calfee and Wintson (1998) and Calfee et al. (2001) estimated how much automobile commuters were willing to pay to reduce travel times. Using a variety of assumptions about travel conditions and how toll revenues would be spent, the authors found that commuters did not value savings in travel time.[34] James Corless, the Director of Transportation for America also said, “When people understand where the dollars are being spent, the direct impact to their lives, they support paying their fair share.”[35] Whether you are for or against Interstate tolling, the fact remains that the funds generated would provide some of the much needed revenue to keep U.S. Interstates operational for years to come.
Conclusion
[edit | edit source]As discussed throughout this case study, funding for transportation infrastructure has not kept pace with demand for construction and maintenance over the years for a variety of reasons, including more fuel efficient vehicles that generate less gas tax revenue, and a Federal gas tax rate that has remained stagnant since 1993. The funding debate continues, and there will always be opposing ideological viewpoints. However, the common goal of all sides – regardless of their opinions on the role of government or the best funding mechanisms – is for the U.S. to have an expansive, well-connected transportation network in a state of good repair to support the national economy, access to employment and social connections. Tolling the Interstate is one component of this much larger debate and may be one of a variety of viable funding options. However, there is a ways to go until tolling existing Interstate capacity becomes more politically palatable and several areas that remain to be addressed in this debate, including the topics in the discussion questions below.
Discussion Questions
[edit | edit source]1. Do you think tolling the Interstate is politically feasible?
2. What challenges will States face in adding tolls to the Interstate?
3. What alternative funding mechanisms would you recommend to shore up the Highway Trust Fund?
4. How will tolling the Interstates affect the interchange-oriented businesses that may experience significantly decreased traffic if commercial facilities are allowed on the highways?
Additional Readings
[edit | edit source]The Future of Toll Roads in the U.S., The Diane Rehm Show (radio segment) - http://thedianerehmshow.org/shows/2014-10-22/future-toll-roads-us
The Future of Toll Roads, Eno Center for Transportation (radio segment) - https://www.enotrans.org/news/the-future-of-toll-roads
How to Toll Every Interstate Highway in America - http://www.governing.com/blogs/fedwatch/gov-how-to-toll-every-interstate-highway-in-america.html
Value Added Tolling, The Reason Foundation - http://reason.org/files/value_added_tolling.pdf
Alliance for Toll-Free Interstates, House Committee on Transportation and Infrastructure Testimony - http://www.tollfreeinterstates.com/sites/default/files/Committee%20on%20Transportation%20and%20Infrastructure%20Testimony%202014_0.pdf
Complete References
[edit | edit source]
Ride-sharing
Overview
[edit | edit source]Providing rides as a service is as old as the car. Formalized taxicab or hackney carriage services began in Europe in the mid-17th century. Modern-day “ride-sharing,” defined as transportation services provided through Transportation Network Companies (TNCs)[36], is the latest evolution in the concept of for-hire private vehicles. This new, innovative offering certainly does not come without scrutiny and opposition. Regulatory oversight has been limited, if existent at all, as ride-sharing technology using smartphones has deployed across the United States. Only in September 2013 did California become the first US state to enact formal regulation of ride-sharing services. Other states, counties and municipalities are likely to follow.[37]
Actors
[edit | edit source]Ride-sharing companies Companies that organize “prearranged” transportation services by using a smartphone application to connect for-hire drivers using their personal vehicles with riders. Industry leaders include, Uber, Lyft, and Sidecar. These companies are commonly referred to as Transportation Network Companies (TNCs), as they do not actually provide transportation services, but only serve to connect the provider with the user. Uber, Lyft and Sidecar each retain a maximum of 20% of the fare the user pays with his or her credit card through the app and forwards the remainder to the driver's account.[38][39][40]
Hailo is a British firm that employs a new mobile application platform that matches taxi drivers and passengers through its smartphone application.[41] Unlike the ride-sharing companies, Hailo uses exclusively fully licensed and regulated taxicabs in each jurisdiction in which it operates, rather than individual drivers using their private vehicles as de-facto "limousines." Hailo recently announced that it is exiting the North American market, but will continue to serve European and Asian markets.[42]
Ride-Share drivers Individuals who provide for-hire rides to ride-share users using their personally owned vehicles. Drivers choose when they want to provide their service, as long as they meet the minimum required hours per company regulations, and meet other company requirements concerning age of vehicle, insurance coverage, clean driving record, clean criminal background, etc.
Ride-Share riders Individuals who "order" a ride using the smartphone application of a ride-sharing company, seeking transportation from one point to another.
Taxi Drivers Individuals who operate fully licensed and regulated taxicabs, usually in larger cities and metropolitan areas. A driver can be the owner-operator of a single vehicle, a member of a driver-owned cooperative, an hourly employee or contractor of a taxicab firm that owns a fleet of cars, or a contractor to a firm who nevertheless uses his or her own vehicle. Taxi drivers must meet all the regulations issued by the state or municipality in which they operate, including licensing, insurance, vehicle safety, and fare and service-level regulations.[43]
Taxi riders Individuals who use the services of regulated taxicab companies and pay the established fares, usually determined by a meter installed in the taxi that charges by the distance driven, plus a minimum fare and taxes or fees. In spite of the advent of smartphone applications, most riders secure a taxi by hailing one on the street, finding one at a taxi stand, or calling for a radio-dispatched pick-up.[44]
Taxi and limousine operating companies Private firms that either own a large fleet of for-hire vehicles or contract with a number of individual drivers who own their own vehicles. They can either be owned by one or a few individuals and centrally managed, or can be driver-owned cooperatives owned by their member drivers. These firms are subject to local and state regulation where applicable, and many cities and towns are served by only one or two taxi or limousine companies.[45]
Taxicab commissions Local regulatory bodies, part of a city or county government, that issue and enforce regulations applying to taxicab (and, in many cases, limousine) operators within their geographic jurisdictions. They are governed by boards that are generally appointed by the local legislature (generally the City Council) and/or chief executive (generally the Mayor).[46]
Public Utilities Commissions The name of the state government agency in each of the eleven US states that have state-level regulations affecting taxicabs. State-level regulations are usually generalized and deal with safety, insurance and competition between taxi and limousine firms. It is usually the responsibility of local jurisdictions to enforce these regulations (in localities without a Taxicab Commission, this responsibility lies with the local police department).[47]
Timeline of Events
[edit | edit source]
- 1915 - First regulations on taxis
- 1929 - Chicago Taxi Cab Commission forms
- 1941-1945 - Modern development of car-pooling during WW2
- Mid 1970s - First organized VanPools
- 1975 - "Slugging" first appeared in Washington, D.C.
- June 2010 - Uber launched
- December 2011 - Uber launched internationally
- February 2012 - Sidecar Launched
- June 2013 - Lyft launched
- September 2013 - California becomes the first state to regulate ridesharing
- June 2014 - Colorado regulated ridesharing at the State legislature level
- October 2014 - D.C. Council passed a bill allowing ride-sharing services to operate within the law in the District
Origins
[edit | edit source]The origins of the modern taxicab date back several centuries. Practically as long as there have been vehicles that could accommodate multiple passengers, from the earliest horse-drawn carriages, there have been drivers who charged others for the privilege of being chauffeured from place to place. The first modern taxis appeared simultaneously in the United Kingdom and Germany in the late 18th century. The word “taxi” comes from the taximeter, the mechanism most taxis use to determine the fare, whose name is derived from the word “tax” because the meter determines what tax the rider will pay. The first taximeters appeared in Germany, and were soon adopted in the United Kingdom, where what became known as taxis were then called hackney carriages, a term still used today. These were originally very heavy horse-drawn carriages, but were replaced in the early 19th century by a lighter-weight carriage called the cabriolet. The "taximeter cabriolet" eventually gave us two shortened forms, "taxi" and "cab." Regulated for-hire vehicles can be divided into three types:[48]
Roving taxis can accept street hails or pick up passengers at taxi stands: generally at airports, train and bus stations, and large hotels.
Radio-dispatch cars (also sometimes referred to as limousines) can be requested only by prior arrangement or charter.
Jitneys are large cars or vans carrying groups on scheduled or pre-arranged trips. (The word “jitney” originated in Los Angeles as slang for a nickel, which is the fare that taxi-van operators there charged during an economic downturn in 1914.)[49]
In some places, “livery services,” which can only accept radio-dispatch and contract trips, are separated from limousines, and regulated differently. 75% of all taxi or limousine trips (excluding jitneys) in the US are performed by radio-dispatch cars, with the majority of the remainder coming from taxi stands, with less than 10% being street hails. In general, taxis charge by the metered distance, while limousines charge by the hour. Note that these figures exclude ridesharing services such as Uber and Lyft, as well as unlicensed and unregulated “gypsy” or “wildcat” cabs, the latter constituting an underground “black market.” Uber and Lyft’s fares factor in both distance and time, making them a hybrid between a taxi and a limousine.
Innovations
[edit | edit source]Uber, Lyft, and Sidecar have all evolved using modern technology to put a twist on the centuries-old for-hire vehicle concept. Such companies and their adopted technologies have captivated consumers and left the taxi industry facing unprecedented challenges to its dominance of the for-hire vehicle market. Riders love Uber, Lyft and Sidecar. These innovative services offer reduced costs, ease of payment, a real-time map showing nearby drivers and allowing users to track the driver they have requested, driver ratings, and -- for one company, Sidecar -- a complete profile of the driver you chose to hire. Uber, which dominates the ride-sharing market and serves more cities worldwide than any other TNC, provides service in 108 US cities and 45 countries worldwide.[50]
All three companies accept payment via stored credit card numbers -- one of the most attractive features of e-hailing. Additionally, the digital dispatch application gives riders the power to submit ratings on the reliability of individual drivers, which are visible to the driver and to other riders anonymously. Similarly, they also allow for drivers to rate riders anonymously. This two-way feedback mechanism is not in place with taxi services, thus providing ride-sharing companies with a great argument for safety.[51] The only way to submit feedback on a taxi ride is to call the taxicab company or file a comment or complaint with the local Taxicab Commission.
According to several Wall Street Journal reporters who conducted an analysis on the ridesharing and taxi industry, Sidecar came out the transportation service winner. Sidecar brought its pre-arranged driver service to the marketplace beginning in February 2014. Sidecar drivers now provide their price for the trip prior to a rider choosing the service. This gives the end user more options and a greater feeling of control.[52] While Uber has “surge” pricing and Lyft has “prime-time” pricing for rush hour periods, Sidecar drivers set their own rates based on supply and demand, as well as any other perks they may want to offer a rider.[53]
Overview of Regulations
[edit | edit source]Taxi Regulations[54]
[edit | edit source]Taxi regulations vary widely by state and locality, but can be generally categorized as those establishing or covering one of the following aspects of service:
Fare controls:
- Minimum and maximum fares
- A set base or per-mile fare
- Means of fare collection
- Method of calculating fares
- Discounts for senior citizens or those with disabilities, and allowed surcharges for such things as rush hour service, late night and weekend service, radio-dispatch service by metered cabs, service to a destination outside the municipality, bad weather, and for extra parcels or luggage.
Restrictions on the total number of firms or vehicles legally able to accept paying riders, usually through licensing or issuing medallions:
- Limitation on number of firms of vehicles
- Requirement that each firm operate a minimum number of vehicles
- Giving existing firms the right of first refusal over new taxi licenses
Restrictions on the type of service offered:
- Limits on the sharing of rides (most jurisdictions prohibit the sharing of taxi rides without the permission of both riders)
- Requiring an extra charge for additional riders
- Requirements to provide service at certain times or places
Safety and quality regulations:
- Restrictions on the type or age of vehicle
- Vehicle safety standards
- Liability insurance requirements or minimums
The criteria that regulatory bodies use to set fare controls are usually either a target operating ratio (operating expenses to gross revenues) or, less commonly, a rate of return on investment. Most jurisdictions require service to be provided to all customers who request a taxi, regardless of origin or destination or the passenger’s race, sex, age, or physical appearance.
In general, the public relies “upon the taxi regulating authority to enforce standards within the industry by regulating fares through meter inspections, safety of the vehicles through vehicle inspections, and driver integrity through background checks.”[55]
Some operators of taxi stands, particularly airport authorities, limit the ability of taxis to serve the stand to those having a franchise agreement with the airport authority, and some prohibit any non-authorized taxi from picking up a passenger at the airport, even if they are allowed to drop off a passenger there. Airports with such limits in place include those in Los Angeles, Philadelphia, Houston, Dallas (Love Field), Phoenix, Cleveland, Columbus, New Orleans, Seattle, St. Louis, Pittsburgh and Miami. Los Angeles grants exclusive franchises to one firm for the use of each taxi stand in the city, while Pittsburgh auctions its airport franchise to the highest bidder. Some cities prohibit taxi companies from entering into exclusive contracts with hotels.
Taxicab and limousine commissions usually are established by and cover only one municipality or county and have authority only within its boundaries, though some metropolitan areas have regional taxicab commissions that cover multiple jurisdictions. They can generally be divided into one of two types: those managed by bureaucrats hired by county or municipal officials through established hiring processes, and those managed by boards consisting of appointees of elected officials. Those managed by bureaucrats tend to impose fewer regulations so as to reduce the amount of work they have to do to keep tabs on all the operators under their jurisdiction, while those managed by political appointees tend to impose more regulations, because they benefit politically from doing more and by satisfying multiple constituencies.
Ride-sharing Regulations[56][57][58]
[edit | edit source]The transportation network company (Sidecar, Uber or Lyft) generally takes the place of government in enforcing standards for drivers and vehicles, though two states and the District of Columbia now have basic driver background and minimum insurance requirements in place for TNCs (see next section). Each TNC has its own regulations at the corporate level. Uber insists that state and local taxi rules should not apply to it or its drivers. TNCs' corporate rules include the following:
Safety
[edit | edit source]- Background Checks - Each TNC requires that all drivers undergo comprehensive background checks, including being screened for criminal offenses and a litany of driving incidents before becoming a certified driver. Per the Fair Credit Reporting Act, background checks can extend to a maximum of seven years. Uber's blog even mentions this criteria being more onerous than that required to become a taxi driver[59].
- Vehicle Quality - Lyft and Sidecar both require drivers' vehicles to be model year 2000 and newer. In addition, they must pass a 19-point vehicle inspection. Uber requires UberX vehicles to be model year 2004 and newer, mentioning that the average vehicle model year is 2008.
- Document Verification - Each driver is required to show proof of insurance, vehicle registration, and driver's license. These are all verified and kept on file by the respective company.
- Zero Tolerance Policy - If a rider suspects their driver is intoxicated, they are encouraged to report the violation to the TNC.
Insurance
[edit | edit source]Each network company carries its own insurance policy. Uber Lyft, and Sidecar each maintain a $1 million Liability Insurance Policy for drivers, through a third party insurance company. This coverage meets all requirements set forth by existing State and Local auto insurance regulations.[60][61]
Pricing
[edit | edit source]The cost structure for Ride-sharing companies deviates from the normal taxi cost structure, which is based on meters built into each cab that measure distance based on wheel rotations and do not use Global Positioning Systems (GPS). Most notably, tipping is neither required or even suggested for various ride-sharing companies, whereas it is customary for taxis and limousines. In fact, tipping is not authorized with UberX, whereas Lyft and Sidecar allow the rider to add an additional amount to the fare prior to credit card authorization. Once the ride is complete, and the "meter" is turned off (via the driver tapping a "ride finished" button on his or her smartphone), the rider is free to go. With payment collection through the smartphone application, the transaction is seamless and thus less burdensome to both drivers and riders, though drivers generally have to verify the rider's identity to make sure they aren't charging the wrong person for someone else's ride. The rider's verbal confirmation of his or her name is usually sufficient, though in rare cases a driver may ask to see a rider's photo identification.[62]
Uber implements "surge" pricing, and Lyft "prime-time" pricing, which raise the price to up to double the normal rate at times of high demand (based on the number of users with the app open looking to see if drivers are nearby). Ultimately, this practice ensures there is a sufficient number of drivers serving consumers. Uber has actually calculated an algorithm that gauges demand (number of users with the app open looking at available rides) against the number of drivers on the road to determine the appropriate pricing at any given moment. The impetus behind these pricing schemes is to encourage drivers to drive when demand is heaviest, such as on holidays, rush hours, after large events, and at times of inclement weather, and to ultimately serve more customers. TNCs fully disclose when surge or prime pricing is in place, requiring customers to accept prior to booking.[63]
Snapshot of State Taxi and Ride-sharing Regulations[64]
[edit | edit source]California: The California Public Utilities Commission sets overall standards for taxi companies, while municipalities handle licensing and on-the-ground oversight. The CPUC adopted regulations applying to ridesharing services in 2013 that were widely seen as victories for the ridesharing companies.[65]
Colorado: Similar to California, Regulation of taxi services, use fee and driver fines is divided between the municipal government and the state’s Public Utilities Commission. The municipality issues driver permits and taxicab stickers, while the state regulates entry, rates, service, financial dealings, and even exit. Colorado also became the first state to formally authorize UberX and Lyft and enact regulations applying to them.[66]
District of Columbia: On October 28, 2014, the DC Council passed a law formalizing the legal operation of smartphone-based ridesharing services, and essentially formally approving the regulations the TNCs had already put in place, creating one set of regulations for TNCs and one set for common carriers (traditional taxi companies that actually provide transportation services). The new law requires TNCs to provide commercial liability insurance from the moment their drivers open their apps as they cruise for rides. The minimum level of coverage will vary depending on whether there is a passenger in the car: When a driver is logged into the app but has yet to accept a ride, the TNC must provide at least $100,000 in liability coverage. When a passenger who booked a ride through the smartphone app actually is in the car, the insurance coverage climbs to $1 million. TNCs will not have to change their background check policies.[67]
Florida: State law vests county Public Transportation Commissions with the power to regulate taxis.
Maryland: The state Public Utilities Commission sets standards for taxicabs and, as of August 2014, still classified ridesharing services as common carriers, requiring they adhere to the same regulations as taxis.[68]
Massachusetts: the Commonwealth’s Division of Standards sets taxi meter standards. The Division “initially sought to shut down Uber in the state in August 2012, because it could not guarantee the company’s smartphone meters measured distance correctly. But the agency quickly reversed course, after Democratic Gov. Deval Patrick’s office publicly backed Uber.”[69]
Nevada: The state directly regulates all taxi companies operating within its borders, and municipalities have no role in oversight. As a consequence, the taxi markets in Las Vegas and Reno are dominated by single, all-encompassing companies. Hence, ridesharing services have not yet been able to enter the Las Vegas and Reno markets. Also of note is that Nevada has the single highest level of taxi company contributions to state-level political campaigns, at over $3 million in 2010, followed distantly by New York and California.[70]
Pennsylvania: The state Public Utilities Commission sets standards for taxis and limousines, and as of September 2014 has granted Uber and Lyft only temporary authority to operate.[71]
Washington State: The state legislature is currently considering enacting safety and insurance requirements that would apply to ridesharing services.[72] Seattle has enacted regulations precluding each Transportation Network Company (TNC) from having more than 150 drivers providing service at any given time.[73]
Ride-Sharing Effects and Controversies[74]
[edit | edit source]The most significant operating costs within the taxi industry are drivers’ wages and fuel. There are few economies of scale in taxi operations, so small companies can compete effectively with big ones. As local commissions usually fix fares, companies can only increase profitability by hiring the cheapest available labor. Therefore, most drivers are part-time employees paid by flat wage, by a percentage of the revenue their trips earn, or as independent contractors who pay for fuel themselves and pay the company a fixed amount per day or week.[75] The industry is labor intensive, with average annual salaries hovering around $25,000[76]. Conversely, the average UberX in New York City driver driving 40 hours/week, is pulling in approximately $90,000, while San Francisco drivers average around $74,000[77]. The recent spike in ride-sharing, unlicensed for-hire vehicles, is directly impacting the taxi economy in various cities. This trend is likely to continue unless the taxi industry advances its technology to compete with ride-sharing. Many taxi and limousine companies receive referral business from travel companies, hotels, hospitals, bars and restaurants with which they have financial arrangements.[78]
Unlike conventional taxi or limousine firms, TNCs do not own cars or employ drivers. They are funded through drivers paying a commission for the privilege of the company linking them to riders. Given that these companies do not fall under the same classifications as taxi services, they have been held to different standards and regulations. As such, taxi drivers, on a global scale, are furious that ride sharing networks and their respective drivers are not subject to the same regulations. They are conducting protests, including causing traffic jams in cities from Washington, DC to London and Paris, and demanding that ride sharing regulations mimic those of the taxi industry, or that the taxi industry be deregulated. As one cabbie said, "we just want jurisdictions to level the playing field"
Uber, Lyft and Sidecar all maintain that they are not transportation providers like taxi companies are, and are therefore precluded from various state and local regulatory requirements. Such rules and boundaries determine who can own taxis, where and how they operate, how much they charge and how they are paid, how they get riders, even their color and the brightness of their dome lights, the car's paint scheme, the type of meter to be used, and more.[79]
Regulations are in place for the general public as well, including the limitations of drivers on the road that ultimately increase traffic and greenhouse gas emissions. Many jurisdictions enforce tight emission standards for taxis, while Uber and others are not held to such standards. This has attracted complaints from environmentalists. Ride-sharing start-ups are not looking to scale back on the number vehicles on the road; this will only happen through regulatory action. Studies and reports are starting to identify cases where revenue and usage is decreasing from not only the taxi industry, but also from public transportation.[80].
The Federal Trade Commission's Frankena and Pautler identified in 1984 perhaps the key aspect of taxi regulation that allows unregulated ridesharing services to gain a competitive advantage, especially ones that are able to adjust pricing in real time to match supply with demand (as Uber and Lyft do with “surge pricing”):
[M]ost regulations impose an inefficient uniformity on the market. For example, it might be efficient to have different qualities of cab service available at different fares. However, fare or quality regulations might lead to a homogeneous service. Also, fare regulations and requirements to use meters are likely to interfere with efficient variations in fares between peak and off-peak periods, between different parts of the city, and between radio-dispatch and cruising service, and they are apt to interfere with the market's ability to reallocate resources in response to changes in costs and demand.[81]
Cooper et al. argue that “it is in the public’s interest to regulate taxicabs, the absence of regulation resulting in a lower level of service to the customer. There is the social commitment that a community has to its citizens and visitors alike that this vital public transportation service will be available, safe, and economical to use. Rates are balanced to protect the user from onerous or arbitrary fares but to still yield the provider sufficient funds to continue in business and make a modest profit.”[82]
Frankena and Pautler maintain that regulation is economically justified when it produces benefits that exceed its costs. Any other form of regulation is based on justifications other than helping the market function more efficiently. They argue that only these types of market failure provide economic justification for regulating the fares and service levels of the taxi industry (aside from safety and liability insurance requirements, and requirements to post fares conspicuously inside and outside of cabs, which do not directly affect fares):
- Over or under-production of services, production of the wrong qualities of service, or unnecessary high costs of producing a given output
- To prevent fare bargaining or haggling
- Charging taxi operators user fees to use taxi stands (in the absence of this, you get a “tragedy of the commons” situation with competing cabs jockeying for space).
The primary market failure stems from the fact that the customer has little or no informed choice among competing operators when hailing a taxi on the street or picking the first cab in line at a taxi stand. Ride-sharing companies have a distinct advantage in this regard because they make driver and service information available to customers through their smartphones. Street-hailed taxis, and those encountered at taxi stands, cannot match this level of information at the customer's fingertips. An individual hailing a taxi is not privy to that driver's insurance coverage, safety record, etc. It would be more costly and cumbersome for governments to require a plethora of information to be presented to taxi customers than simply to mandate that all taxis meet minimum insurance and driver qualification requirements.
The demand curve for taxi service relative to fares may not be perfectly elastic if potential riders cannot costlessly select the cab charging the lowest fare. Interestingly, of the ridesharing services currently available in multiple US cities, only Sidecar lets users compare fares on their smartphones before selecting a ride. With Uber and Lyft, the fare is calculated based on distance and time, which varies based on the route that is chosen, and thus can’t be determined before a ride begins. However, it should be possible for services like Hailo or FlyWheel that use regular metered taxis to estimate the fare based on the recommended route and the meter fare per mile, plus the base fare and any taxes or fees. Hailo has not yet done this.
Mobile technology is changing traditional taxis as much as it has introduced competition to them. “The pre-booked [taxi] market has developed significantly in recent years with the advent and widespread use of mobile phones allowing for faster bookings, removing many of the barriers associated with pre-booked vehicles particularly in reducing delay.”[83] Cooper et al. note, perhaps predicting the ridesharing revolution, that “If limousines, especially sedans, are permitted to provide taxi type services with no regulation as to rates and charges, then the taxi industry is effectively deregulated as to entry.”[84]
Discussion Questions
[edit | edit source]Should ride-sharing companies, such as Uber, Lyft, and Sidecar, adhere to the same regulations as the taxi Industry?
Should the taxi Industry be de-regulated? Would doing so give riders greater choice and lower prices without sacrificing safety, service quality, or an adequate geographic distribution of service?
Does the rise of ride-sharing services and the increased use of smartphone apps for requesting rides put those without access to smartphones at a disadvantage? How should they be accommodated?
Frankena and Pautler argue that most current fare and level-of-service regulations on the taxi industry are not economically justifiable, but non-economic reasons are offered for maintaining them. Are these reasons valid? If so, how else would you go about achieving goals such as guaranteeing a minimum level of for-hire vehicle service to all parts of a city, protecting public transit systems, and maintaining a city's image?
Conclusion
[edit | edit source]Many times when a more advanced, more customer-friendly product is unveiled, it poses a significant challenge to the viability of the incumbent product with which it competes. The incumbent must adapt to what has become the "new normal," or else become obsolete. While they have faced legal challenges at length, Uber, Sidecar, and Lyft continue to expand and thrive, continually adapting to the market. Diamandis states it well and to the point: "Regulation can only stay the change for a short time. And during this time of accelerating change, where the only constant is change, we will be seeing a lot of 10x improvements challenging the norm".[85]

We are hopeful that the issues of fairness in competition will work themselves out so that all individuals and companies offering for-hire vehicle services will be able to easily connect with customers -- whether through smartphones or other means -- and make a decent living or a profit, and making the overall for-hire vehicle market more efficient, reducing the amount of time that vehicles are being driven empty in search of paying riders. We also expect that state and local governments will eventually adapt to the ride-sharing model, either reducing fare and service level regulations all around so that taxi companies are able to innovate and compete with ride-sharing on the basis of price, or creating two tiers of regulation: one set of rules for TNCs that exclusively use smartphone-based haling and another for taxis that rely on street hails, radio dispatching, or serving taxi stands.
Perhaps one of the ultimate positive outcomes of the "ride-sharing revolution" will be to give more Americans (at least those living in metropolitan areas) the freedom to get around easily without a car. Along with smartphone apps that demystify transit routes and schedules and connect users with other options such as car sharing and bike sharing, ride-sharing services are part of a new wave of technology that makes getting around by means other than driving one's own car more intuitive and accessible. The ultimate outcome may be that more Americans find themselves able to go car-free or car-lite, thus reducing congestion and all the other negative social and environmental impacts associated with the majority of travelers driving alone.
Further Reading
[edit | edit source]California Public Utilities Commission. "Enforcement: Transportation Network Companies." Accessed Nov. 30, 2014. http://www.cpuc.ca.gov/PUC/Enforcement/TNC/
Cooper, James, John Nelson, and Ray Mundy. Taxi! : Urban Economies and the Social and Transport Impacts of the Taxicab. Farnham, England: Ashgate Publishing, 2010. http://eds.b.ebscohost.com/ehost/detail/detail?sid=6472bab9-b058-4641-8df3-ac5234b9f535%40sessionmgr115&vid=0&hid=102&bdata=JnNpdGU9ZWhvc3QtbGl2ZSZzY29wZT1zaXRl#db=nlebk&AN=336373.
Council of the District of Columbia. "Legislation: B20-0753 - Transportation Network Services Innovation Act of 2014." Accessed Nov. 30, 2014. http://lims.dccouncil.us/Legislation/B20-0753?FromSearchResults=true
Dent, Steve. "What you need to know about Uber, Lyft and other app-based car services." Endgaget, June 27, 2014. http://www.engadget.com/2014/06/27/uber-lyft-explainer/
Complete References
[edit | edit source]
Disease
Summary
[edit | edit source]In recent years there has been an upswing in diseases crossing international borders, often at alarming speeds. While much attention presently is devoted to Ebola, let us remind you of some of the other more recent outbreaks: Middle East respiratory syndrome (MERS), Swine Flu (H1N1), Severe Acute Respiratory Syndrome (SARS), Avian Flu (H7N9), and many earlier diseases that were once thought to be controlled through vaccination or eliminated entirely: Poliovirus, Cholera, Yellow Fever, and Measles.
Globalization and advances in technology continue to expand our horizons and bring international borders and continents closer in time than ever before. As air travel has increased so has the risk that an infectious disease could be spread to multiple destinations in a matter of hours. In fact SARS, reached pandemic level by reaching four continents in three days.[86] In light of the recent outbreak of Ebola this case study evaluates the viability of infectious disease screening at airports, specifically within the context of Ebola, and other policy proposals to contain diseases in aviation.
Annotated List of Actors
[edit | edit source]- Centers for Disease Control and Prevention (CDC): National public health institute of the United States. Its main goal is to protect public health and safety through the control and prevention of disease, injury, and disability.
- Customs and Border Control (CBP): Agency responsible for regulating and facilitating international trade, collecting import duties, and enforcing U.S. regulations, including trade, customs, and immigration.
- Ohio Department of Health: Instituted a mandatory 21 day quarantine for health care workers and travelers arriving from Sierra Leone, Liberia, and Guinea whether or not they have symptoms.
- Texas Health Presbyterian Hospital: This is the hospital that treated the first diagnosed Ebola patient in the U.S. outside of patients transported to the U.S. for treatment. Two nurses that worked at this hospital and cared for that patient later contracted the disease.
- United States Department of Health and Human Services: The U.S. government’s principal agency for protecting the health of all Americans and providing essential human services, especially for those who are least able to help themselves.
- World Health Organization (WHO): Directs and coordinates authority for health within the United Nations system. It is responsible for providing leadership on global health matters, shaping the health research agenda, setting norms and standards, articulating evidence-based policy options, providing technical support to countries, and monitoring and assessing health trends.
Timeline of Events[87]
[edit | edit source]- 1976 - September 1: Ebola was first diagnosed in Zaire now the Democratic Republic of Congo.
- 1976 – 2013 Sporadic outbreaks of less than 1800 reported human infections with 64% mortality.
- 2013 – December 6: A Guinean toddler who passed away is believed to be “Patient Zero” in current Ebola outbreak.
2014
- March 22: Guinea confirms Ebola.
- March 30: Liberia reports two Ebola cases.
- Aug. 2: First U.S. citizen (a missionary physician) infected with Ebola in is flown to Atlanta for treatment. Treated w/experimental drug. Released Aug 19 disease free.
- Aug. 5: Second U.S. missionary infected with Ebola in is flown to Atlanta for treatment. Treated w/experimental drug and released Aug 21 disease free.
- Sept. 20: A Liberian citizen (Thomas Eric Duncan) attempted to help woman infected with Ebola to seek medical attention, she died from the disease. Mr. Duncan boarded a flight from Liberia to Dallas, TX with connecting flights in Brussels Belgium and Dulles International.
- Sept. 25: Duncan goes to Dallas hospital with fever, abdominal pain and was released. He returns via ambulance on Sept. 28th
- Sept. 30: CDC confirms Duncan has Ebola; first case diagnosed in the U.S.
- Oct. 8: Duncan, dies in Dallas hospital.
- Oct. 11: J.F.K. begins screening operation.
- Oct. 9: Britain announces intent to screen passengers entering country through London's two main airports and Eurostar rail link with Europe. Begins screening at Heathrow, on Oct 14th.
- Oct. 12: Nurse who treated Duncan tests positive for Ebola, becoming first person to contract the virus in the United States.
- Oct. 15: Second Texas nurse who treated Duncan tests positive.
- Oct. 21: U.S. announces that starting Oct. 22 travel from Liberia, Sierra Leone and Guinea will be restricted entry into one of five designated airports for enhanced screening. These include: John F. Kennedy International airport, Dulles, Chicago O’Hare, Newark Airport, and Hartsfield-Jackson. Screening will include monitoring for symptoms of the virus for 21 days.
- Oct. 23: New York reports health care worker returning for Guinea infected. CDC confirms Oct. 24th.
- Oct. 24: The governors of New York and New Jersey order the quarantine of all medical workers returning from these countries.
- Oct. 25: Illinois orders the quarantine of all medical workers returning from these countries
- Oct. 26: Florida will monitor for 21 days people returning from these countries.
- Oct. 27: U.S. military begins isolating personnel returning from Ebola missions in West Africa.
- Australia closes its borders by restricting visas for citizens of Sierra Leone, Liberia and Guinea.
- Oct. 29: infections have occurred in 8 countries total 13,567 cases accounting for 4,960 deaths.[88]
Maps of Locations
[edit | edit source]
Background
[edit | edit source]On August 7th, 2014, Ebola was declared by the World Health Organization (WHO) “public health emergency of international concern”.[90] A part of this decision was based on the death rate, lack of treatments available, and lack of licensed vaccinations.
The Ebola virus is a type of hemorrhagic fever. Hemorrhagic refers to severe bleeding. The symptoms

[91] of this disease are bleeding, fever, nausea, vomiting, diarrhea, bruising, and many other symptoms. Bleeding normally occurs from the eyes, though those near death will also bleed from the nose, ears, and rectum.[92]The WHO estimates the death rate of those infected with Ebola at 50%.
Currently there is not a cure for Ebola. The treatments are supportive such as intravenous fluids and drugs that only treat symptoms. Various potential treatments are in the development process. Also, there are not any licensed vaccines available. The vaccines are in the final stages of gaining licensing approval.[94]
Patient zero of this current Ebola outbreak is believed to be a two year old from Guinea. He died on December 6, 2013. The disease then spread to his mother, sister, and grandmother. Those that attended their funerals then took the disease back to their villages.[95] As of October 27th, 2014 there have been 13,703 Ebola cases with 4,920 deaths.[96]
The first patient with Ebola to arrive in the United States, Thomas Eric Duncan, highlights some of the policy issues. He flew from Liberia to Brussels, and then Brussels to Washington Dulles Airport, and then from Washington Dulles Airport to Dallas Fort-Worth. After arriving in Dallas, Duncan went to Texas Health Presbyterian Hospital for a fever and vomiting. While in triage it was noted that Duncan had recently travelled from Liberia. It is not known if this information was appropriately communicated to the healthcare team. The physical examination found abdominal tenderness and nasal congestion. He was given an antibiotic and pain reliever, then sent home. Three days later Duncan returned to Texas Health Presbyterian Hospital and was admitted.[97] Ten days later Duncan was pronounced dead.[98]
Two nurses contracted Ebola while caring for Duncan. Exactly how the two contracted the virus is unknown. The first nurse to be diagnosed with Ebola, Nina Pham, did not travel after treating Duncan. The second nurse, Amber Vinson, travelled to Cleveland after Duncan had died. While in Cleveland Amber was not exhibiting any signs or symptoms of disease until the final day. Before she boarded a flight from Cleveland to Dallas she called the CDC and reported a 99.5 degree fever. This was below the limit set by the CDC which is 100.4. She was told it was acceptable to board the flight and return to Dallas.[99]
Entry screening began at five U.S. airports in October for travelers from affected areas of West Africa.[100] Entry screening at JFK began on October 12, 2014. The other four airports are Washington Dulles, Chicago’s O’Hare, Atlanta Hartsfield jackson, and Dallas Love Field; they started entry screening on October 16, 2014. As major international hubs, these screenings initially covered over 90 percent of flights involving travelers from West Africa. With continued concerns, a new policy requiring all travelers from West Africa to enter through these hubs was adopted October 21st. [101] [102]Exit screening in Sierra Leone, Guinea, and Liberia was also adopted, but with concerns regarding their effectiveness based on the truthfulness of travelers.[103]
Dr. Craig Allen Spencer is the most recent case of Ebola to be diagnosed on US soil. He was diagnosed on October 23, 2014. The doctor worked with Doctors Without Borders in West Africa and returned to the United States on October 17. He was not required to be under quarantine and went about normal life in New York City. He was self monitoring his temperature per the guidelines given to him by Doctors Without Borders. Between 10 a.m. and 11 a.m. the doctor found that he had a fever of 100.3. He notified Doctors Without Borders which arranged for his transportation to Bellevue Hospital.[104] The doctor had gone through the mandatory screening point at JFK International Airport which involved a temperature check and travel survey.[105]
In response to Dr. Craig Allen Spencer’s Ebola case the governors of New York and New Jersey have implemented a mandatory 21 day home quarantine for health care workers that had contact with Ebola patients and other arriving travelers that had contact with Ebola infected people.[106] On October 31, 2014 Ohio adopted the same quarantine rules.[107] A nurse in Maine was battling a quarantine order in court, which a Maine judge rejected. [108]
Clear Identification of Policy Issues
[edit | edit source]A number of policies have been either implemented or advocated for in addressing the potential spread of Ebola from West Africa. Airport screenings involving temperature checks and heightened questioning have been adopted, in addition to travel restrictions funneling West African travelers through key airports where they are subject to screenings.
- Airport Screenings
Exit screenings have been adopted for travelers leaving affected countries in West Africa, however there are concerns that travelers may not be honest in answering questions about their exposure to Ebola. Even when truthful, temperature scans are not effective earlier during the disease before temperature spikes. Similar screenings were found to be ineffective during an earlier outbreak of Swine Flu. [109] Entry screenings into the United States have also been adopted, along with requirements for travel through certain airports as part of travel restrictions.
- Travel Restrictions & Bans
A restriction on entry to the United States has been adopted for travelers originating from West Africa, funneling travelers through five major international hubs where entry screenings have been expanded. These entry screenings have the same challenges as exit screenings in West Africa, leading some to advocate for outright travel bans for travelers from West Africa or beyond. However, there are few direct flights from West Africa to the United States, with most travelers having a layover in London or Brussels. [110] A travel ban would have to determine the original point of origin for a traveler, which may be challenging and require additional resources if the traveler does not cooperate. Such a ban would also impact international travelers, including humanitarian workers, and undermine the effort to control Ebola within West Africa. [111]
An outright ban of all people with passports from the affected countries may impact students and international workers with visas who have not been back home for extended periods of time. A travel ban would significantly reduce flights in West Africa, reducing the ability of humanitarian workers to continue to not only visit the countries, but also operate within the countries where roads and other infrastructure may be poor. The U.S. humanitarian response, including Pentagon travel, currently depends on private contractors with the Pentagon working to deploy their own planes for transport in January.[112] [113]
Discussion Questions
[edit | edit source]- Is it feasible to establish infectious disease screenings at airports? If yes, which airport – origin or destination?
- Should medical workers who volunteer (or are ordered to the infected area – as in the military) and come in direct contact with the virus be involuntarily confined (quarantined) for a defined period upon their return from the infected areas? If yes, should they be compensated? Should there be different regulations for medical volunteers versus members of the military?
- Are travel restrictions or travel bans about protecting against the spread of a disease, or security theater to calm public concerns?
- While this study asks about airports, should screening procedures include other ports (sea) or points of entry?
Additional Readings
[edit | edit source]- Ebola - Signs and Symptoms. http://www.cdc.gov/vhf/ebola/symptoms/index.html
- Ebola - How is it transmitted? http://www.cdc.gov/vhf/ebola/transmission/index.html
- Ebola - Treatment. http://www.cdc.gov/vhf/ebola/treatment/index.html
- Questions and Answers about CDC’s Ebola Monitoring & Movement Guidance. http://www.cdc.gov/vhf/ebola/exposure/qas-monitoring-and-movement-guidance.html
- These scientific studies show that airport Ebola screenings are largely ineffective. http://www.washingtonpost.com/blogs/federal-eye/wp/2014/10/31/these-scientific-studies-show-that-airport-ebola-screenings-are-largely-ineffective/
- Why a travel ban wouldn't work. http://www.politico.com/story/2014/10/travel-ban-flights-ebola-111961.html
- Why an Ebola flight ban wouldn't work. http://fivethirtyeight.com/datalab/why-an-ebola-flight-ban-wouldnt-work/
References
[edit | edit source]
Crude
"Crude oil is defined as a naturally occurring, unrefined petroleum product composed of hydrocarbon molecules. The volatile and explosive nature of crude oil makes it a hazardous material requiring specialized procedures and equipment when handled or shipped to market….." [114]
Worldwide uses for the wide ranging array of petroleum products derived from crude oil permeates nearly every facet of modern life. As a result, demand for this resource is high. Countries and corporations of the world compete with one another as they secure oil reserves in order to develop infrastructure and supply chains to mine this resource and get it to market. With the maturation of hydraulic fracturing (fracking) technology,[115] the United States (US) has recently begun developing its oil reserves, most notably the Bakken Formation currently making it the leading oil producing country in the world.[116] Canada has also been developing vast oil resources as well with the addition of the Kearl Oil Sands Mining projects.
Both US and Canadian reserves are expected to produce crude oil for decades to come and plans to develop infrastructure for the transport of crude oil to market have been enacted including the Keystone Pipeline.[117] Progress on pipeline development has either stalled, like the Keystone, or is not sufficiently developed at this time for use as a viable mode to ship crude oil. As a result, the North American Oil producers have relied primarily on the freight rail system leading to a number of “growing pains” some of them costly in terms of damages to the oil market, the rail system, the environment and, unfortunately, human life. The Canadian rail line incident known as the “Lac-Mégantic rail disaster" occurring on July 6, 2013 causing the death of 47 townsfolk has become a “lightning rod” issue for the oil and rail industries to change rail safety procedures.[118] Conversely, for every disaster brought to the discussion table, rail industry officials can point to scores of safety successes and provide legitimate arguments for pacing change over time. Crude oil rail safety has, therefore, become a “hot bed” issue with no easy solutions.
The Crude Oil Rail Safety case study presents detailed information regarding a list of Actors, a Timeline, Maps and Locations, Policy Issues, and a Narrative with background information on crude classification, rail operations, tank cars, crash history, Federal oversight, and current issues followed by a section with discussion and conclusions on this complex group of issues.
Annotated List of Actors
[edit | edit source]Oil Producers
[edit | edit source]http://oilshalegas.com/shalefields.html
- Bakken Oil Fields
- Kearle Oil fields (Tar sands)
Shippers
[edit | edit source]- American Petroleum Institute (API)
- Individual Petroleum Companies and Corporations
Railroads
[edit | edit source]Class 01
[edit | edit source]Consists of rail lines with operating revenues exceeding $319.3 million annually[119]
- Canadian National (CN)
- Burlington Northern Santa Fe (BNSF)
- CSX Transportation (CSXT)
- Canadian Pacific (CP)
- Union Pacific (UP)
- Norfolk Southern (NS)
- Kansas City Southern (KCS)
Class 02 Regional Railroads
[edit | edit source]Class 03 Shortline Railroads
[edit | edit source]Regulatory Agencies
[edit | edit source]US Department of Transportation
[edit | edit source]- Federal Railroad Administration (FRA)
- Pipelines and Hazardous Materials Safety Administration (PHMSA)
Transportation Safety Board of Canada (TSB)
[edit | edit source]Transportation Canada
[edit | edit source]http://www.tc.gc.ca/eng/aboutus-menu.htm
Railroad Associations
[edit | edit source]- American Association of Railroads (AAR) https://www.aar.org/
- American Short Line and Regional Railroad Association (ASLRRA) http://www.aslrra.org/our_members/Railroad_Members/
Timeline of Events
[edit | edit source]- 1865 - The first tank car is invented by Charles P Hatch.[120]
- 1869 - Wrought Iron tanks replace wooden ones.
- 1927 - The Interstate Commerce Commission (ICC) comes up with the first tank car specifications. These are based on designs recommended by the American Association of Railroads Tank Car Committee.[121]
- 1930’s - Welding replaces riveted tank cars-this allows for pressurization.[122]
- 1950’s - The Stub Sill tank car design, which incorporates the tank itself as a structural element of the car, replaces older models where the tank rides on a beam that runs down the center of the car. Tank cars gain capacity as a result.[123]
- 1960’s - The DOT 111 Car replaces the DOT 103 as the most common non pressurized, general purpose tank car.[124]
- 1966 – DOT Act of 1966 creates Federal Rail Road Administration. The Federal Railroad Administration (FRA) was created by the Department of Transportation Act of 1966.http://www.fra.dot.gov/Page/P0010 reference [125]
- 1975 - Hazardous Materials Act of 1975 gives the United States Department of Transportation authority to regulate materials that could cause “unreasonable risk to health and safety or property when transported in commerce.” [126]
- 1980 - The Staggers Rail Act of 1980 is passed – The act “gave the railroads the freedom to determine the routes of transportation, set rates for moving freight and streamline procedures for sale of rail lines. The act did set maximum rates that railroads could charge and procedures to prevent abuses by railroad companies. Since the act was passed, railroads have become more competitive and have increased their revenues and volume of traffic significantly. “ [127]
- 2008 - Congress Passes the Rail Safety Improvement Act[128]
- 2009 - NTSB finds the DOT 111 cars have a “high incidence of failure when involved in accidents” and “…can almost always be expected to breach in derailments that involve pileups or multiple car to car impacts.” [129]
- July 6th, 2013 - An unattended crude oil train derails in Lac Megantic, Quebec, killing 47 people and destroying much of downtown.
- August 2, 2013 - FRA issues Emergency Order No. 28, requiring railroads to properly secure rolling equipment. FRA also publishes a Safety Advisory recommending additional actions. [130]
- August 2013-May 2014-Operation Classification, also called "The Bakken Blitz" takes place. [131]
- February 21, 2014 - Letter to the Association of American Railroads outlines safety agreements made between FRA and AAR. [132]
- February 25, 2014 - USDOT issues Emergency Order requiring stricter standards to transport crude oil by rail. [133]
- May 7, 2014 USDOT - issues Emergency Order requiring railroad carriers to inform first responders about crude oil being transported through their towns and communities and for the immediate development of oil spill plans. [134]
- August 1st, 2014 PHMSA issues NOPR Hazardous Materials: Enhanced Tank Car Standards and OperationalControls for High-Hazard Flammable Trains (HHFT)[135]
- September 30th, 2014 Comments period concerning PHMSA Hazardous Materials closes[136]
- October 2014 USDOT Inspector General initiates announcement of an audit of the FRA's enforcement of hazardous materials with emphasis on crude oil shipments. [137]
Maps and Locations
[edit | edit source]CSXT
[edit | edit source]Encompasses 21,000 miles of track into 23 states, DC and both Canadian provinces of Ontario and Quebec. The company boasts serving the major markets in the Eastern US including 70 marine type terminals among the Atlantic and Gulf Coasts, Mississippi River, Great Lakes and the St. Lawrence Seaway.[139] CSX operates in an array of markets including energy, industrial, construction, agricultural and consumer products. The company partners with Western rail companies to coordinate crude oil shipments Eastward.[140] The company reported for 2014 3rd quarter an 8% revenue increase up from the prior year and a total revenue of 3.2 billion. [141]Agricultural products edged a single percentage increase at 16% compared to industrial chemicals at 15% of which an apportion includes crude.[142] The C&O Line connects the Midwest to the deepwater ports of Virginia. Some of CSX's longest trains traverse this route.[143]
Burlington Northern Santa Fe(BN)
[edit | edit source]Consists of a 32,500 mile network operating in 28 US states and 2 Canadian provinces. BN delineates its business into the consumer, industrial, coal and agricultural categories. Financially, BN’s 2nd quarter report reflected total revenue of $5,735 million up a mere 5% compared to a year earlier. Surprisingly, the grain’s section was the highest increase with volumes up 8% while crude was deduced as primarily the root of increases in the industrial products market.[145]
Canadian National (CN)
[edit | edit source]Based in Quebec with 21,000 miles of track reaching three coasts in the automotive, coal, fertilizer, food and beverage, forest, dimensional, grain, metals and minerals, petroleum and chemicals and specialty crops markets.[146] CN specializes specifically to the US and Canada’s petroleum market in key regions including the Alberta Heartland, Oil Sands, Eastern Canada and the Gulf of Mexico. The company reported a 3rd quarter all time high revenue of C$3,118 million. This was a total increase of 16% with a 29% in the grain market followed by a 21% increase in the petroleum sector.[147]
Canadian Pacific Railways
[edit | edit source]A transcontinental in both the US and Canada serving 14 main markets consisting of automotive, coal, energy, ethanol, fertilizer and potash, food products, forest products, grain, industrial, intermodal, oversize, sulphur, truck and trailer and wind energy markets. Specifically to crude, the rail offers full rail transportation services to both the Oil Sands and Bakkan Shale regions as well as the Marcellas Shale deposit. Carrier offers over 15,000 track miles and access to ports on both east and west coasts. Financially reported a 2014 3rd quarter record net income of $400 million with revenues rising 9% despite a 4% increase in operating costs.[148] Crude’s share of the revenue snapshot accounted favorably at a 74% increase compared to US grain at 19% and Canadian grain at 17% increases.[149]
Union Pacific (UNP)
[edit | edit source]The rail operates in 23 states with 31,800 miles of track. The company conducts business in the following markets; agricultural products, automotive, chemical, coal, industrial products and intermodal. [150] The 2014, 3rd quarter report reflected an 11% revenue increase at $6.2 billion up from $5.6 billion in 2013’s same quarter. Crude oil was not specifically addressed in the financial record. However, industrial products were up 19% , chemicals up 6% and agricultural products up 19%.[151] [152]
Norfolk Southern (NS)
[edit | edit source]Operates among 22 states and 20,000 route miles including 10 river ports, 9 lake ports and claims the most extensive intermodal network in the East. [153] NS reported 2014 3rd quarter revenue increases of 7% at $3 billion with chemical and grain both up 14% and 5% respectively. [154]
[155]
Kansas City Southern (KCS)
[edit | edit source]One of the only class 1 rails extending well into Mexico with a total of 6,100 miles of track. The company serves grain, coal, chemicals, petroleum, industrial and consumer product markets. [156] KCS and Savage Companies announced a joint venture to build and operate a multi-user terminal in Texas designed to bring unit train rail service from the Bakken. [157]
Rail Car Product Distribution
[edit | edit source]
Policy Issues
[edit | edit source]There are three policy issues to examine:
Crude Oil Classification
[edit | edit source]Of the nine classes of hazardous materials, crude oil falls into Class 3, which consists of flammable/combustible liquids. For transport, each hazard class is divided into packing groups (PG). Flammable and combustible liquids are rated as PG I, II, or III, with I being the most volatile and III being the least. While PHMSA and NTSB have found that many shipments have been mislabeled as less volatile than they should have been, it is worth noting that the heavily scrutinized DOT 111 tank car is currently an acceptable container for all three packing groups.
New Tank Car Safety Specifications and Retrofitting or Phasing Out of Older Cars
[edit | edit source]Most of the groups involved agree that the DOT 111 cars, which represent most of the crude oil fleet, should be retrofitted with safety upgrades or retired from flammable liquids service. The parties disagree on how soon these cars need to be retrofitted or retired, and the safety specifications of the replacement cars.
Railroad Safety Operations
[edit | edit source]Modifications to Railroad operations have been proposed to enhance safety. These include more monitoring of train equipment via trackside sensors and more visual inspection, increased track inspection and maintenance, reduced speeds in all or some areas, and more personnel attending trains at all times.
Narrative of the Case
[edit | edit source]The complexity of Crude Oil Rail Safety stems from the multitude of factors that play into decision making at all levels of the crude oil supply chain. We have attempted to identify as many of the issues and provide as much reference information on the subject as possible.
Transport Canada and USDOT Proposed Regulation
[edit | edit source]Canadian and US Government agencies charged with oversight of the freight rail industry struggle with balancing regulation of the industry and allowing enough self-governance for oil and rail markets to remain competitive. Recent events have prompted swift action. Both Canada and the US have recently proposed and mandated changes to Rail operations and vehicle safety design involving crude oil shipments. Transport Canada has issued emergency and permanent directives similar to those proposed by the USDOT.[159] Similarly, the USDOT has proposed rulemaking regarding Crude oil shipments in Federal Register, vol. 79, no. 148.[160] The new rules have yet to be ratified with the comment period recently closing September 30th, 2014 and are subject to review and consideration per the rule making process.[161]
Hazardous Materials Classification/Packing Group Designation
[edit | edit source]Crude oil is packaged by shippers, who are required to test it and designate the correct Packing Group (I-III) for rail shipments for High Hazard Flammable Trains (HHFT). The Bakken region’s oil characteristics vary in volatility from well to well. When asked to comment on how crude oil is handled, Dave Galt, Executive Director of the Montana Petroleum Association noted “Crude varies significantly in viscosity, boiling point and flammability. Some of it can be as volatile as gasoline and other times you can’t get it to burn with a torch.”[162] Crude oil is defined as a naturally occurring, unrefined petroleum product composed of hydrocarbon molecules. The characterization of crude oil has traditionally been characterized by its geographic original source location. For example, Alaska North Slope Crude or the Bakken, but this does not adequately inform emergency responders, train engineers with information as to the inherent risks while in transit.
Crude oil is classified into three hazard groups and varies in boiling point and flammability. The Code of Federal Hazardous Materials Regulations 49 Part 172.101 table of hazardous materials lists crude oil specifically as “Petroleum Crude Oil, UN1267, Class 3” with packing group designated by Roman Numerals I, II, III. Packing Group I is the most volatile and generally more restrictive in its packaging requirements. Classification in itself can be difficult to determine throughout the transportation process. Shippers and oil companies are responsible for the classification testing. Regulations are being drafted and adopted to address these issues specifically to testing for boiling and flashpoint.
The emergency declaration posted February 25, 2014 prohibited the practice of re-classifying a flammable liquid as a combustible for the purposes of circumventing the rules prescribed in the packaging regulations of 49 CFR 173.[163]
Testing crude oil is the responsibility of the shipper to be conducted within a reasonable timeframe in order to determine both flash point and boiling point. Both are used to determine the proper packing group. The test consists of first performing a distillation test which determines the initial boiling point (IBP). Results of less than 95 degrees Fahrenheit (32.22 Degrees Celsius) are classed as Packing Group I. IBP testing results greater than 95 degrees Fahrenheit then are further tested for flash point. Flash points less than 74 degrees Fahrenheit (23.33 Degrees Celsius) are classed as Packing Group II. Leaving those with flash points greater than 73 degrees Fahrenheit and IBP greater than 95 degrees Fahrenheit are classed as Packing Group III. Recall that the Emergency Order mandated that all crude oil shipments with a Packing Group III must be transported in accordance with the Packing Group I or II regulations.
In addition to these mandatory tests, shippers are required to perform additional tests frequently enough to ensure proper classification using the nine UN hazard classes in 49CFR parts 171 to 180 as a guide to properly classify their hazardous materials. The DOT Emergency Order requires at a minimum, the testing of vapor pressure, percentage of flammable gases, hydrogen sulfide, sulfur, and corrosively to steel and aluminum. Crude oil may contain hydrogen sulfide, which in high concentrations is a poisonous gas. It can be determined in the vapor phase by modification of test method ASTM D5705. Sulfur content, while required by the Emergency Order, poses no immediate hazard and is a characteristic required by the EPA as a combustion property. (Authors: Scott Blakely, Laboratory Services Manager Kesavalu Bagawandoss, Corporate Technical Director [164]
After the derailments and explosions in 2013, FRA and PHMSA suspected that crude oil was not always being given the correct Packing Group designation. “Federal law requires rail customers to properly disclose and label hazmat shipments to ensure that appropriate rail cars are used and to assist emergency responders in case of an accident. To that end, in March 2013, PHMSA and FRA launched “Operation Classification,” a compliance initiative involving unannounced inspections and testing of crude oil samples from the Bakken region to verify that the oil is properly classified. In January 2014, based on data collected through Operation Classification, PHMSA issued a safety alert announcing that the type of crude oil being transported from the Bakken region may be more flammable than traditional heavy crude oil.”[165]
New Tank Car Safety Specifications and Retrofitting or Phasing Out of Older Cars
[edit | edit source]Tank cars are somewhat unique among other cars. They are often some of the most expensive, costing between $120,000-138,000.[166] They are also expensive to operate: tank cars are usually unable to be cleaned out after a shipment, so they are unable to backhaul, meaning they make their return trip empty. Partially because of this, the Interstate Commerce Commission (the railroad regulator prior to the US DOT) exempted tank cars from their common carrier model; that is, railroads were not required to make them available to shippers.[167] Since they’ve never been required to provide them, the railroads themselves own very few tank cars. Most are owned or leased by the shippers of the product. In the case of crude oil in the United States, that is the companies who make up the American Petroleum Institute. These companies can choose to buy tanker cars, or lease them from tank car builders.
Oil is typically shipped in DOT 111 tank cars, also known as CTC-111A cars in Canada. They make up about 60% of the United States tanker fleet and more than that proportion in Canada. Their safety record has come under scrutiny; an NTSB Study responding to a 2009 derailment in Illinois found a “high incidence of failure when involved in accidents.”[168] Both the FRA and the AAR support regulations requiring an increase in head and shell thickness, normalized steel, and better top fitting protection. FRA is still in the process of coming up with new tank car specifications. In July 2014 PHMSA came out with a Notice of Proposed Rulemaking that outlines the safety specification of new DOT Specification 117 cars. Since 2011, tank car builders have been producing CPC (Casualty Prevention Circular) 1232 cars, sometimes called “Good Faith” cars.[169] These cars are built above current standards but would fall below standards proposed by PHMSA in the Notice of Proposed Rulemaking issued in July 2014. Additionally, some of the older (but not oldest) DOT 111 cars are candidates for retrofits that could bring them into compliance with new regulations. It is estimated that this would cost between $20,000-$40,000 per car.[170]
Most parties involved agree that the older cars could be safer and should be retrofitted. Further, most everyone agrees that cars that cannot be retrofitted should be phased out of service. The timetable for this happening is what is being debated. DOT 111 cars have a service life of 30-40 years. Since the tank cars are usually owned by the oil producers, the API is not surprisingly the most reluctant to endorse immediately phasing these cars out. The API feels that retrofits and new tank cars are expensive. They are also ordering them anyway; they claim that there is a 24-30 month backlog on new tank cars.[171] If all non-compliant cars were forced out of service, the API believes there would not be enough existing cars to meet demand. Further, the API believes that crude oil is the railroads responsibility while it is in transit. In a twist on the National Rifle Association’s “guns don’t kill people” argument, the API asserts that as long as the cars stay on the tracks, they are perfectly safe. Recently, BNSF, a railroad company that moves much of the crude oil out of the Bakken oil fields, made two announcements. One was that they would be ordering 5,000 new cars that would go beyond any regulations set to date.[172] Their other announcement was a $1000 surcharge per pre-2011 DOT 111 car that has not been retrofitted, adding about $1.50 per barrel of oil shipped by these cars.[173]

Enhanced Braking
[edit | edit source]“The US DOT proposes to require all HHFTs to be equipped with alternative brake signal propagation systems. Depending on the outcome of the tank car standard proposal and implementation timing, all HHFTs would be operated with either electronic controlled pneumatic brakes (ECP), a two-way end of train device (EOT), or distributed power (DP).”[175]
Crude Oil Rail Operations
[edit | edit source]Rail operations vary between railroad companies. All companies are subject to Federal regulations set in title 49[176] by United States Department of Transportation (USDOT) which includes oversight from the Pipelines and Hazardous Materials Administration (PHMSA) and the Federal Railroad Administration (FRA). Rail operators with freight cars from multiple packaging groups (I-III) can be intermixed per USDOT regulations. Recent Federal regulation prohibits any crude tank cars from being classified lower than Packing Group II.[177] With the amount of crude oil being shipped by rail most carriers have no need to mix regular freight when packaging trains. Like most regular freight train packages, the number of crude oil tank cars in HHFTs varies from package to package based on the availability of locomotives and destinations and number of tank cars to be shipped. Weight, height and width also a factor into train packaging. A typical sized HHFT carries 100-110 cars in a single train although some regular freight trains have been known to have more cars.
Crude Rail Speeds
[edit | edit source]The American Association of Railroads defines a “key train” as a train that carries 20 or more carloads or portable tank loads of any combination of hazardous material. Key trains, according to AAR’s operating practices, are restricted to a maximum speed of 50 MPH.[178] Changes proposed by PHMSA would keep the speed limit at 50 MPH for any High Hazard Flammable Train (HHFT) carrying all DOT specification 117 cars. Trains that can’t comply with proposed braking requirements would be limited to 30 MPH. PHMSA also proposes three options for a 40 MPH speed limit, unless all of the cars in the train are DOT Specification 117 Cars: Option 1: 40 MPH Speed Limit All Areas Option 2: 40 MPH in Areas with More Than 100,000 People Option 3: 40 MPH in High Threat Urban Areas (HTUA)[179] “After the accident, Canadian and U.S. regulators ordered all railroads to lock trains and stop leaving them unattended on main lines. Railroads voluntarily chose to slow those carrying crude oil and ethanol to 50 miles an hour. That won't decrease derailments, says Matthew K. Rose, executive chairman of BNSF Railway Corp., but it will reduce damage if one occurs.”[180]
Route Selection
[edit | edit source]Current routes are selected by in accordance with existing regulation by the Rail Industry selecting a practicable route per the 2008 guidelines in 73 CFR 72182.[181] PHMSA has recently proposed rail carriers consider 27 safety and security factors on August 1st, 2014.

Recent Crash History
[edit | edit source]On July 6th, 2013 the town of Lac-Megantic experienced one of the worst freight train disasters in Canadian history after a 74 car runaway train carrying crude from the Bakken Formation derailed at speeds in excess of 60 MPH causing a large explosion and fires from many of the tank cars. 47 townsfolk have been confirmed dead with 30 buildings destroyed in the 1-kilometer blast radius.[183] The death toll of 47 due to the crash and resultant explosion makes it the fourth-deadliest rail accident in Canadian history,[10] and the deadliest involving a non-passenger train. It is also the deadliest rail accident since Canada's confederation in 1867. The last Canadian rail accident to have a higher death toll was the St-Hilaire train disaster in 1864.[11”[184] The investigation regarding into the chain of events leading to the cause of the derailment and the subsequent explosion revealed that a hand brake was set improperly by railroad personnel. An incident involving a fire on the engine supplying power to the air brake system holding the train in place was shut down. The hand brake was set improperly by rail officials and the train ran away from its designated parking spot. An unfortunate flaw in the rail line in the town center caused the tank cars to derail.
The disaster resulted in swift action from both the US and Canadian governments. The US issued Emergency order 28 in Federal register notice, Vol. 78, No. 152 on Wednesday, August 7, 2013 mandating, among other things, that all trains transporting hazardous materials be attended by qualified rail personnel at all times. Transport Canada later responded with recommendations. Below is a table of US Accidents involving crude oil rail trains….

Proposed Rule Responses in the table below shown in Federal Register,Vol. 79, No. 148 show us the initial responses from a varied range of stakeholders.

Discussion
[edit | edit source]Demand for Crude Oil production in North America, particularly the Bakken Formation play, has created a demand for rail shipment in the absence of other modes of transport of crude oil to market. The Keystone Pipeline, as proposed, is primarily intended for Kearl Oil Sands Project production in Canada. It has been estimated that the Keystone line can transport a small portion of Bakken Crude (100,000 Barrels per day)leaving rail as the primary mode for shipping the remaining Bakken production, estimated at 900,000 barrels per day.[187]
There are additional pros and cons to consider when comparing Rail shipments of crude to Pipeline transmission. For instance, Rail has been calculated as more destructive to human habitat than pipelines yet cheaper to clean up when accidents occur as compared to pipelines. Conversely, pipelines generally have less impact on the human environment in terms of lives lost than do rail incidents. However, pipeline spills generally cost more to clean up than do impacts form rail accidents. An article in Forbes notes “The Quebec train wreck last year killed 47 people and spilled 1.5 million gallons of crude onto land (Bloomberg.com). The Enbridge pipeline rupture in 2010 spilled over a million gallons of similar crude into the Kalamazoo River but did not kill anyone (Wikipedia).”[188] The article goes on to make a sobering point by comparing the costs for the Quebec rail disaster at $400 million for loss of human life and $150 million for clean up to the Enbridge pipeline incident having costs eclipse $1 billion.[189] Other factors for consideration when discussing crude oil rail safety initiatives include:
- the costs of the improvements proposed to the rail system.
- the costs imposed on the crude oil tank car owners for upgrades or replacement.
- the costs of time loss due to the perceived reduction in availability of rail time due the operational and vehicle specification changes proposed in the new rule making.
- the impact these costs have on the demand for Bakken Crude.
The decision makers in North America have the unenviable task of assessing the costs to implement Crude Oil Rail Safety measures and weighing this information against the risks of continuing to use rail in consideration of the known impacts to the environment, the damages to cities, damages to rail systems, and most of all, human life.
Factoids
[edit | edit source]- "In the U.S., 70% of crude oil and petroleum products are shipped by pipeline. 23% of oil shipments are on tankers and barges over water. Trucking only accounts for 4% of shipments, and rail for a mere 3%. In Canada, it’s even more lopsided. (97%) of natural gas and petroleum products are transported by pipelines (Canadian Energy Pipeline Association)."[190]
- "In the U.S., 70% of crude oil and petroleum products are shipped by pipeline. 23% of oil shipments are on tankers and barges over water. Trucking only accounts for 4% of shipments, and rail for a mere 3%. In Canada, it’s even more lopsided. Almost all (97%) of natural gas and petroleum products are transported by pipelines."[191]
- "Amid a North American energy boom and a lack of pipeline capacity, crude oil shipping on rail is suddenly increasing. The trains are getting bigger and towing more and more tanker cars. From 1975 to 2012, trains were shorter and spills were rare and small, with about half of those years having no spills above a few gallons (EarthJustice.org). Then came 2013, in which more crude oil was spilled in U.S. rail incidents than was spilled in the previous thirty-seven years."[192]
- Price Differential – Crude oil from the Bakken sells at pricing less than other market competitors and is made possible due to shipping to market by rail. Costs of new regulation and safety protocols jeopardize Bakken oil producer’s ability to compete with more accessible markets.[193]
- Crude Rail Insurance – “There is not currently enough available coverage in the commercial insurance market anywhere in the world to cover the worst-case scenario," says James Beardsley, global rail practice leader for Marsh & McLennan Cos.' Marsh Inc. insurance brokerage unit.[194]
- Congressional Research Service estimates that transporting crude oil by pipeline is cheaper than rail, about $5/barrel versus $10 to $15/barrel (www.NYTimes.com). But rail is more flexible and has 140,000 miles of track in the United States compared to 57,000 miles of crude oil pipelines. Building rail terminals to handle loading and unloading is a lot cheaper, and less of a hassle, than building and permitting pipelines.
- "In 2013, about 33% of the petroleum consumed by the United States was imported from foreign countries.1 This was the lowest level since 1985."[195]
- "In 2013, about 50% of the crude oil processed in US refineries was imported."[196]
- "The physical characteristics of crude oils can be different. In simple terms, crude oils are classified by their density and sulfur content. Less dense ("lighter") crudes generally have a higher share of light hydrocarbons from which higher-value products such as gasoline, jet fuel, and diesel can be recovered with simple distillation. The denser ("heavier") crude oils produce a greater share of lower-valued products with simple distillation and require additional processing to produce the desired range of products. Some crude oils also have a higher sulfur content, an undesirable characteristic with respect to both processing and product quality."[197]
Discussion Questions
[edit | edit source]Is rail the safest mode alternative for shipping crude oil?
What are the alternatives to rail?
Will changes to the crude oil rail safety regulations impact pricing at the pump?
Will policy changes prevent all future crude rail derailments?
Additional Readings
[edit | edit source]United States Department of Transportation-Pipeline and Hazardous Materials Safety Administration. (2014. Notice of Proposed Rulemaking). Hazardous Materials:Enhanced Tank Car Standards and Operational Controls for High Hazard Flammable Trains. Washington, DC: US Department of Transportation.
Dominus, S. (2013 , December 21). Regulars of the Musi-Cafe: A Ghost Train Devastates a Family and a Town. Retrieved from New York Times: http://www.nytimes.com/news/the-lives-they-lived/2013/12/21/regulars-of-the-musi-cafe/
Eaton, J. (2014, October 31). New Oil Train Safety Rules Divide Rail Industry. Retrieved from National Geographic: http://news.nationalgeographic.com/news/energy/2014/10/141031-rail-industry-safety-oil-standards/
Lavelle, M. (2013, July 8). Oil Train Tragedy in Canada Spotlights Rising Crude Transport by Rail. Retrieved from National Geographic: http://news.nationalgeographic.com/news/energy/2013/07/130708-oil-train-tragedy-in-canada/
PBS Newshour. (2014, July 23). DOT proposes tighter rules for oil trains. Retrieved from You Tube: https://www.youtube.com/watch?v=RC9-qsEZdWU
T.W. (2013, July 14). The Economist Explains: Why is so Much Oil Carried by Train? Retrieved from The Economist: http://www.economist.com/blogs/economist-explains/2013/07/economist-explains-8
Complete References of Cited
[edit | edit source]
Parking
Parking Innovations: Payment, Reservations, Pricing.
[edit | edit source]
Summary
[edit | edit source]Innovations in parking systems across the globe are changing how we view parking especially with major technological developments improving parking systems and strategies both from a user and an industry perspective. Transformation in major areas of parking such as payment, pricing, and reservations change how local and regional governments effectively manage congestion and alter people’s behavior when commuting in and out of central business districts.
From a user perspective, the creation of apps allow individuals to handle payment via mobile devices, locate open parking spaces, and secure parking spaces in advance with a virtual reservation system. These features have made parking in a city more efficient and convenient.
Management of parking systems from a public/private perspective has improved with various parking models that adapt pricing for users based on demand, track and monitor garage capacity with sensors, and promote usage of fuel efficient vehicles by discounting parking rates.
These recent parking strategies are geared toward creating more efficient parking systems aimed at reducing congestion, changing behaviors towards parking, reducing impacts on the environment and providing up-to-date information which allows parking officials to effectively manage the flow of traffic through urban centers.
Annotated List of Actors
[edit | edit source]Drivers - Parking innovations provide more options and accessibility for drivers. They also generate a demand for parking and play a major role in the design of forecasting models.
City Planning & Building Departments - Local Planning and Building departments play a major role in regulation, oversight and authorization of parking structures, capacity levels and oversee parking requirements and zoning tied to any building or structure.
Payment processing companies (PayPal, iPay, CC, Brainstorm, Swipe) - Companies that provide a centralized payment service for businesses (merchant services).
U.S. Department of Transportation - Federal entity that oversees safety, regulation, and development of transportation systems nationwide. Sets certain requirements and guidelines and provides funding through grants for state transit projects.
Donald Shoup - A subject matter expert in the economics and availability of parking. Shoup proposes a theory that there is no such thing as free parking and it should be priced according to demand. He is a popular figure in the urban planning/transportation community and has followers commonly referred to as “Shoupista’s”.
Carl Magee - Patented the first parking meter. The first meter was installed in Oklahoma City in 1935.
Timeline of Events
[edit | edit source]1905 First automated parking garages start to appear in the United States[198]
1935 Worlds first parking meter designed by Carl C. Magee installed in Oklahoma City[199]
1974 The first Multi-Space Meter (MSM) was believed to have been implemented in Paris, France[200][201]
1989 Parkulator, the first portable, personal parking meter introduced in Arlington, VA[202]
1999 Berkeley, CA is the first city in the United States to street test networked Multi-Space parking meters[203]
1999 Parkmobile develops and deploys cell phone payments for parking in Europe[204]
2008 City of Chicago offered the 75-year concession of the city’s metered parking system to Morgan Stanley making it first ever private operator[205]
2011 San-Francisco rolls out SFpark pilot program, a demand-responsive parking system where rates are defined by vehicle occupancy and turnover[206][207]
Policy Issues
[edit | edit source]Parking Strategies and Management
[edit | edit source]Perhaps the best way to evaluate current management strategies is to consider the market principles of supply and demand. Research indicates there are as many as 5-8 parking spaces for every car in the United States. The oversupply of parking is a major contributor to the corresponding demand for parking but many planners do not see this connection. Instead, parking minimums are required to meet a perceived demand with no association between parking supply and its ability to drive demand.
Parking requirements are generally set in zoning ordinances, which help to identify land use and subsequently the expected parking demand. There are often parking minimums that are, “intended to improve the traffic circulation pattern by getting automobiles off the street once they have arrived at their destination.” An example of these minimums might be a provision that requires a parking space for every seat in a movie theater. Many argue these parking minimums have contributed to the oversupply of parking.
The District of Columbia has recently abolished parking minimums in favor of more flexibility to provide parking that meets market demand and other cities are reevaluating zoning ordinances to determine best management practices to help reduce the oversupply of parking. Clearly there is a need to examine the relationship between parking supply and the corresponding demand.
[208][209]
San-Francisco Metropolitan Transportation Commission employed local urban planners to study parking codes and come up with suggestions related to parking reforms and innovation.
They outlined a Ten Point Program[210] that sums up the best practices:
1. Reduce or eliminate unnecessary parking requirements. Additional parking requirements for new non-residential development in Downtowns and town centers should be eliminated, wherever feasible, based on local conditions and community plans.
2. Share parking. Ideally, all new non-residential parking in Downtowns and town centers, and around rail transit stations, should be shared parking—spaces that are available for public use, rather than reserved for the tenants and visitors associated with any particular property or set of properties.
3. Promote alternative modes. Incorporate requirements or incentives for free/discounted transit passes in exchange for parking spaces, carshare incentives, and bicycle parking requirements to promote the use of alternative modes and reduce the need for car ownership.
4. Establish parking maximums in transit-served areas and expand the existing supply of parking only as warranted. Maximums can prevent over-building; parking codes also can cap the allowable amount of parking, and require additional permits if a developer believes more are required.
5. Adopt additional strategies for parking management. Some best-practice management strategies are:
- Require developers to unbundle parking costs in residential projects
- Implement parking cashout programs
- Provide transit passes
- Provide parking credits for on-site car sharing service
- Require more bike parking
6. Price on-street and off-street parking. Charging for parking is the most direct way to both reduce parking demand and ensure that end-users carry more of the cost of providing off-street accommodations. Pricing can be used to ensure availability and turnover of on-street and off-street spaces.
7. Adopt an on-street parking availability target. The targets can maintain the availability of on-street parking in Downtowns, town centers and transit corridors and prevent spillover parking impacts in surrounding areas. Parking occupancy can be monitored and paired with investment of funds into the local area (see point 10 below).
8. Manage parking to achieve the availability target using pricing or time limits. Expanding on point #7, cities can manage on-street parking demand to achieve the desired availability target either by implementing pricing or time limits, adjusting rates and/or regulations as necessary to ensure that 1-2 spaces per block are usually available.
9. Prevent spillover parking impacts in surrounding neighborhoods with residential permit parking zones. Cities can establish residential permit parking zones to prioritize curb space for local residents and/or businesses, in areas where the availability of parking in surrounding areas is seriously impacted by workers, transit riders, shoppers, business vehicles, and/or visitors.
10. Establish parking benefit districts. Net revenues collected from on-street parking pricing and permit revenues can be dedicated to funding public improvements within designated Parking Benefit Districts, ensuring that revenue is used to benefit the blocks where the money is collected.
Communication
[edit | edit source]As the parking systems evolve, public awareness campaigns that target parking options available as well as new or updated payment methods, become crucial in managing traffic flow in urban areas. Businesses in areas where new parking technologies are being implemented should work effectively with transportation authorities providing feedback and helping with disseminating useful information to customers. Any changes to parking regulations and rates should be communicated clearly to public using mass media and social media channels.
Privacy
[edit | edit source]The enforcement of parking policies with tracking systems raises privacy concerns. Two main tracking systems - License Plate Recognition (LPR) and GPS - could be considered indirectly involved in parking technology, and both have been linked with privacy concerns.
License plate recognition, mentioned in greater detail under the Payment section, is widely regarded as the most sensitive as far as privacy is concerned. For street parking in cities, parking enforcement is performed using LPR technology. Currently, only government agencies are permitted to collect and interpret data using LPR (citation needed).
The use of LPR systems and collection of license plate data implicates informational privacy interests. Informational privacy is concerned with the collection and dissemination of data, technology and the public expectation of privacy. Although U.S. courts have not recognized a reasonable privacy expectation in a license plate, the collection and use of license plate data through LPR systems raise concern for informational privacy. While the information on a license plate itself may not be private, the use of such collected information raises privacy concerns. Courts have found that drivers have a right to be free from warrantless GPS tracking. In Commonwealth v. Connolly, the Massachusetts Supreme Judicial Court barred warrantless GPS tracking on public streets, recognizing citizens' interests in keeping their travels private.[211]
Environmental Issues
[edit | edit source]The production of the materials used in the construction of parking infrastructure, including steel, cement and concrete, release significant amounts of greenhouse gases. Concrete is the second most consumed substance on earth, water being the first. It’s estimated that the production of cement used to make concrete accounts for 5% of global carbon dioxide emissions.
In urban areas, it’s estimated that 50-70% of the surface area is covered by pavement, and parking accounts for much of this pavement. In commercial areas, 31% of the pavement is dedicated to parking. During rainstorms, water that would normally infiltrate into the ground to recharge groundwater, instead runs off pavement. The stormwater runoff carries oil and other pollutants from cars that ultimately outfalls into natural streams, rivers, and lakes. The velocity and volume of water also is compounded by pavement. The EPA lists stormwater runoff as the greatest threat to clean water.[212]
Narrative of the Case
[edit | edit source]History/Background
[edit | edit source]The birth of the automobile and parking go hand in hand. Once the automobile reached mass markets, space for parking soon took priority. With Henry Ford’s model T in mass production beginning in 1908, the automobile became an affordable option for the average American family. By 1910, the number of U.S. automobiles reached $9 million, and with that came heavy traffic congestion in urban city centers.[213]
Parking space shifted from open lots, curbside, or farm land to methods such as purchasing daily parking passes or metered parking. While some of these parking management ideas worked with the evolving urban landscape, others were detrimental in preserving historical buildings and cutting down trees to make way for parking space. The initial design of parking garages provided additional services such as gas and maintenance stations. Innovations in construction materials and engineering design in the 1950s improved parking garages with features like a safer ramp system, open-air concept, and solid concrete structures.[214]
As zoning laws evolved with cities urban development, mandates were issued requiring off street parking access for new developments. Local government municipalities became involved in the issue of parking in urban areas. Concerns over unprofitable parking structures and unfavorable urban design negatively affected the city’s landscape.[215]
In the 1920’s and 30’s, major parking garages opened up in cities across the U.S. At the 1933 Chicago world fair, “The World’s Largest Parking Terminal” was put on display as a parking garage of the future. The terminal included capacity levels of 24,000 spaces, lighting and safety features as well as auto and convenience stores.[216]
After WWII, hesitance toward making space for parking garages and metering disappeared, supporting the growth and prosperity of the U.S. automobile. “In 1946, only 70 cities had parking requirements in their zoning plans; a decade later, at the dawn of the interstate age, most did. And, as urban renewal served as a tool for struggling cities to flatten themselves for parking spaces and widen roads to relieve congestion, urban officials themselves lifted up the light rail lines to provide room.”[217]
By the 1970’s the U.S.’s dependence on oil, degraded urban landscape, and consumerism became apparent, creating a backlash which led to stronger efforts in preserving a city’s architectural heritage, public space, and environmental awareness.
Moving into the 20th century, parking has been heavily targeted, especially with new developments, due to parking space saturation and the consumption of valuable real estate. Today employers are offering public transit subsidies and encouraging employees to bike or walk to work in hopes of reducing automobile dependence. Even as parking minimums and zoning requirements fuel the supply of parking, federal agencies are taking action to prohibit further development of parking structures in cities that can’t meet air quality standards.
Portland, Oregon: Imposed ordinances requiring a houses facade to be three-quarters house.
Santa Ana, California: Employers promoting alternative transit options. One company encourages employees to walk to work with an annual shoe subsidy of $50.
Houston, Texas: EPA has blocked parking development structures in Houston due to the city’s inability to meet clean air standards.[218]
Discussion
[edit | edit source]Innovations: Payment
[edit | edit source]Overview
When customers look for a place to park they usually consider the method of payment required to complete the transaction; therefore, parking and payment transactions usually go hand in hand. Ideally, customers would not need to worry about the method of payment every time they park their vehicles, and it seems like this is the direction where parking operators are trying to get to. The 2013 Emerging Trends in Parking Survey, conducted by the International Parking Institute (IPI), found the two leading emerging trends in the Parking Industry were payment related- Move toward innovative technologies to improve access control, and Payment automation and Demand for cashless or electronic payment.[219]

Limitations affecting the Parking Industry
Parking customers frequently encounter frustrations -- not having coins available for the meter, misplacing parking ticket, returning to the car for extending expired parking sessions -- mainly caused by the lack of payment flexibility of traditional Single-Space Meters (SSMs), and parking garages. These limitations not only affect customer satisfaction, they also harm parking operators by leading to increased complaints, and higher management and enforcement costs. Additionally, “it is expensive to administer the collection of cash fares. For every dollar a transit agency receives in passenger revenue, it spends approximately 6 cents on fare collection and processing. Most of the cost is associated with collecting, transporting, counting, and guarding cash. Dollar bill processing is particularly difficult and costly. Reducing the use of cash for fare payment provides a clear benefit for transit operators.”[220]
Parking operators are well aware of this, and by implementing less capital intensive or “asset-lite” solutions, they can increase revenue while reducing operating costs. The idea behind the “asset-lite” movement is to achieve more (revenue, flexibility, etc.) with less (assets, maintenance costs, etc.); parking innovation technology allows for this migration to be possible. Implementing “asset-lite” solutions is a way for parking operators to continuously work towards improving parking access control and payment automation in a more cost effective way.
Smart Cards & the Electronic Purse
A Smart Card works as an “Electronic Purse” (EP) or a prepaid card used to pay for parking. Customers add value to a card using cash, credit or debit cards; the EP card is then used to pay for future parking transactions. A smart card reduces the number of credit card transactions and associated fees for the consumer and parking operator. Often if the EP balance reaches $0, the credit card on file is charged a pre-set amount (as long as the customer has set up an account with the provider). This technology is widely used by transit providers who integrate metro, bus, and parking services into one smart card or EP; it can also be used by municipalities via networked SSMs or MSMs, and by parking garage operators via EP providers such as Parkmobile.
Pay-by-phone/Parkmobile (mobile apps)
The Pay-by-Phone apps may be the biggest parking payment innovation yet; it allows customers to pay for parking using their mobile phone. Currently, the two main providers are Pay-by-Phone and Parkmobile.
Customers set up an account using their name, license plate, credit card and mobile phone numbers, and then enter the designated lot number and the amount of time needed to complete the transaction.
Consumer benefits include increased payment flexibility, and the ability to extend parking sessions without the need of returning to the pay station. Additionally, customers have access to all the transactions and parking receipts online. Customers who don’t want to use the mobile app have the option of calling a designated number to complete the payment transaction.
Pay-by-phone apps are available for all operating mobile platforms including iOS, Droid, Windows, Blackberry, and Amazon. GPS functionality is also integrated with the app; it allows customers to save previously used parking zones for even quicker future transactions. Pay-by-phone functionality allows for other innovative services to be possible- digital parking permits, advance registration and pre-payment of event parking, airport parking reservation, etc.
License Plate-Enabled Parking
License Plate-Enabled Parking (LEP) employs license plate numbers as unique vehicle identifiers, placing them at the heart of a smoothly integrated parking ecosystem.[221]

License-plate recognition technology (LPR)
Another popular technology used for processing parking payment is License Plate Recognition (LPR), where a vehicle’s license plate number is recognized from an image taken by a color, black and white, or infrared camera[. This technology has been widely used by Law Enforcement (mainly large agencies with over 100 officers) for several years now. LPR includes four main stages - Image Acquisition, License Plate Extraction, License Plate Segmentation, and Character Recognition.
Cameras scan license plates at entry and exit points, the license plate number is then recognized and the information reconciled through a real time database or data management system that is used to confirm parking payment. LPR allows for gateless parking which improves vehicle flow by reducing congestion at entry and exit points. It also reduces operational and collection costs by eliminating the need of a cashier. LPR can also be used to issue citations by identifying unpaid vehicles.
Pay-by-License Plate (PBL) Pay Stations
Customers complete payment transactions using designated pay stations by entering their license plate number (LPR technology is not required on PBL stations to complete payment transactions). This technology eliminates the use of parking permits usually displayed on the driver or passenger side of the vehicle. Customers can also extend parking sessions using their mobile phone.
On-Street Parking
On street parking, also known as curbside parking has been defined as the space along the street between travel lanes and sidewalk.[222] Until recently parking payment options for on-street parking were limited to coin-based Single-Space Meters (SSMs). Fortunately, parking payment innovations embrace a new array of parking meters with increased payment capabilities- targeting cashless and virtual transactions- which result in increased customer satisfaction, revenue generation, and policy compliance.

The new generation of SSMs provides much evolved networked assets with increased payment options such as debit and credit cards, and pay-by-phone. Additionally, the Multi-Space Meter (MSM), believed to have been first seen in Paris in 1974, was first introduced in the United States in 1999.[223] A networked MSM is connected to a data management system that allows for multiple payment options and other capabilities like extending parking sessions remotely. The MSM follows the “asset-lite” principle by consolidating the number of assets (meters) necessary per parking space; each MSM typically manages 8-10 spaces as opposed to the SSM which requires one asset per space. Less meters required result in a reduction of maintenance, operating and collection costs.
Off-Street Parking
Off-street parking includes surface lots and parking structures; these are usually found at educational buildings, airports, offices and other commercial structures such as shopping malls. Payment innovations available for off-street parking include pay-by-foot stations and LEP technologies. Usually pay-by-foot stations are installed in multiple areas throughout the parking structure and sometimes inside the particular building. Parking operators can benefit by a reduction in operating costs since these technologies do not require a booth attendant, and a decrease in congestion at entry and exit points. Additionally, operators may see an increase in revenue resulting from customers overestimating their parking session.
Evolution of Revenue Composition/Mix
Networked meters have only been in use in the United States since 1999 and up until that point revenue composition for parking Single-Space Meters consisted of 100% cash based transactions. Cash based structured systems have a higher capital and operating cost because they traditionally require more assets which in turn require collection associated tasks- collecting, transporting, counting and guarding cash[224], while cashless parking systems are more cost-effective. Washington DC’s parking cost structure shows that credit and debit card transactions cost about 57% of what cash transactions cost; pay-by-phone transactions are even lower, only costing about 36% of cash transactions.[225] In 2009 DC started a revitalization of their curbside parking policy and ecosystem- updated non-working SSMs with networked assets that allowed payment flexibility-, in 2011 it implemented pay-by-phone capability. By 2013 the city’s revenue mix had drastically changed from 80% coin and 20% credit cards, to 43% pay-by-phone, 31% coin and 25% credit card transactions; at the same time DC’s parking revenue increased by 60%.[226]
The shift in revenue mix by Washington DC is a great example that parking operators are moving in the right direction by implementing innovative and “asset-lite” solutions that allows for increased payment capabilities, reduced cash transactions and increased credit and virtual ones.
Innovations: Reservations
[edit | edit source]Overview
In the past, parking reservations were geared toward commuters paying a monthly fee to reserve a space in urban city garages or pre-included with an event or destination. Today innovations in parking reservations have developed significantly, offering more options and flexibility when securing a parking spot. Several areas of reservation innovations will be examined, including types and methods used for reservations, reservation systems and models, major components of a reservation system and examples of innovative reservation applications across the country. A reduction in areas of traffic congestion and air pollution stress the need for reservation innovations and could improve current urban planning and environmental concerns.
“…drivers that possess information on parking availability are 45% more successful in their decisions than those without knowledge of this information when arriving at their parking facility.”[227]
Types & Methods used for parking reservations
Parking reservations can be broken down into types of reservations made as well as different methods used to secure a space. Drivers now have the ability to make reservations anywhere from minutes before finding a space to months prior to the event when parking is needed. Along with reserving a space months in advance, the user can make a reservation virtually either by using their mobile device or on a company’s website.
Types:
- En-route: Securing parking while en-route to trip destination
- Pre-trip: airport or event parking
Methods:
- Mobile Device: Downloading apps to a mobile device allows the user to make a reservation mobily in a matter of seconds.
- Online website: Most reservation management companies now operate virtually, which gives the user the ability to access reservation management systems anywhere virtually.
- Vouchers/Permits: Permits purchased in advance which allows the user to park in a specified spot for a certain amount of time. Example: Parking permits at Oakland International Airport BART station.[228]
Reservation System and Models
The basis for parking reservation systems is a prediction of anticipated demand while taking into account major factors such as capacity and pricing during peak hours. Innovations in parking reservations look at area’s of demand in parking which focus on locations such as airport parking, urban city garages or near attractions.[229]
Reservation systems
Intelligent Parking Reservation Systems (IPRS) – taking customer preferences into consideration and provide users with real time information on space availability, sometimes using a drivers navigation system.
Parking Guidance Information (PGI) - Provides drivers with real time information of available parking through a wireless device or the vehicles GPS system and directs the driver to the parking space location.
Reservation Models
Real-Time Availability Forecast algorithm (RAF)
Major Components of availability, time (peak hours), and reservation pricing are taken into account when building a reservation model. Based on these factors, a reservation fee can be applied (and determined by calculating drivers willingness to pay for available parking while decreasing search time).[230]
Staggered parking reservations
The staggered parking reservations model would disperse commute times and reduce congestion. Drivers must arrive before the expiration of the reservation in order to secure desired parking.[231]
Components factored into reservation systems
Reservation systems use a variety of methods for operational functionality. One of which is using various formulas to predict and anticipate fluctuating capacity and pricing strategies (willingness to pay for convenience-time saved looking for parking). Others include forecast parking and focuses on a discrete choice model to predict future demand.
Components impacting model:
Components of parking reservation models such as availability (capacity), time, and pricing greatly impact the outcome of a user’s parking reservation. Depending on capacity levels, time frame desired, and what the user is willing to pay, a reservation system generates the best option for the driver by using their selected criteria.
- Availability: Parking capacity levels within a certain area
- Time (peak hours): Time frame desired
- Reservation pricing: Price the user is willing to pay. Additional fees could apply during peak hours along with reservation fees.
- Pricing models: Pricing varies due to shifts availability and time. Updated prices create dynamic pricing structure.
- Reservation fees: Determining amount the user is willing to pay for convenience of removing search time.
Data components within capacity, time, and pricing variables also factor into the reservation management system which can impact the user’s reservation. Reservations take into account both the criteria of the user as well as the parking facility/curbside restrictions. Numerical values such as duration, how far in advance the reservation can be made, hold time, when reservations are applicable (sometimes only offered during peak hours) and advanced payment all generate data criteria which factor into the reservation model.
Examples of innovative reservation applications
Examples of parking reservations can be found across the country. When looking for innovations in reservation management systems, several cities stand out in their use of modeling implemented in areas such as urban city centers as well as airport or facility parking.
Parking Innovation Center - Boston, MA. Park Mobile has built a facility designed (opening 2015) to enhance all aspects of parking management using the latest technology. “The Boston facility will be the first of a series of new Parking Innovation Centers to be established across the United States, and will also serve as the flagship technology center bringing together Parkmobile's integrated platform supporting on demand and pre paid parking, parking reservations, event parking, valet parking, residential parking permits, and deep parking industry and payments integrations.”[232]
Click and Park reservation system - Click and park is owned and operated by ParkMobile and provides parking management for major sporting and entertaining events. The company recently started servicing the city of Boston and is deployed in cities/venues across the U.S. The company service’s parking for major sporting/entertainment events.[233][234]
Reagan National Airport - ePark. A virtual parking management company that allows drivers to make a reservation at DCA airport from 24 hours to 6 months in advance. The user can scan their reservation code to open garage. By combining hourly and daily parking lots into one facility, Metropolitan Washington Airports Authority (MWAA) claims that the reservation system opened up an additional 100-200 spaces.[235]
Innovations: Pricing
[edit | edit source]The True Cost of Parking
A comprehensive pricing policy must first address the costs of parking before considering pricing strategies. The following categories make up a majority of the costs associated with parking: Infrastructure Costs, Operations and Maintenance, and Environmental Costs.
Infrastructure Costs
One aspect of parking infrastructure costs that is commonly overlooked is the value of land. It’s estimated that a typical parking space requires about 300-350 square feet, including access aisles and landscaping. The value of that space is dependent on location. In central business districts, where space is at a premium, the value of land can be as high as $6,000,000 per acre.
Infrastructure costs vary depending on the type of parking. On-street parking requires the least amount of infrastructure with average costs estimated at $5,000 per space. Structured parking is more infrastructure intensive with costs averaging $19,650 per space. Estimates for the price of condominium parking, typically underground and requiring the most infrastructure, averaged $45,400 per space.[236]
Operations and Maintenance
Operations and maintenance costs for structured parking include cleaning, lighting, security, fee collection, insurance, and labor among others. Re-surfacing is required every 5-10 years and major reconstruction or replacement is required every 20-40 years, depending on the potential for harsh climate impacts. Annualized commercial operating expenses have been estimated at $500 per space.[237][238]
Environmental Costs
Direct impacts to the environment include the pavement required for on and off-street parking, which commonly impacts green space. It also increases impervious surface area, which results in increased stormwater runoff and prevents the recharge of groundwater. The production of steel, concrete, and asphalt needed for parking structures also release considerable amounts of greenhouse gases.
There are indirect environmental impacts that result from increased traffic spurred by free curbside parking. A UCLA Environmental Impact Report estimates external congestion costs of $73 per month per space and pollution costs of $44 for a total external cost of $117 per month per space.[239]
Summary of Costs
It’s difficult to estimate the total number of parking spaces within the United States but research indicates there could be as many as 8 parking spaces for every car in the US, or approximately 2 billion spaces. The estimated cost is $500 billion annually, more than three times total expenditures on public roads, and more than half as large as total expenditures on private vehicles.[240]
Pricing Methodology
When comparing the public and private management of parking, the most distinguishing characteristic is how costs are recovered. Most public parking is provided free or at a subsidized rate. In these instances, the costs associated with parking are recovered indirectly. When parking is managed privately, the cost is recovered directly with fees. The distinction has implications on parking turnover, utilization, and traffic.
Public Pricing (Indirect)
There currently is a general lack of pricing policy for parking within most cities in the United States. “Of the 95% of U.S. employees who commute by automobile, only 5% pay full parking costs, 9% pay a subsidized rate and parking is un-priced at more than 98% of non-commute trip destinations.” At commercial and retail destinations, the hidden costs of parking are recovered through higher taxes or higher retail prices. In residential construction, parking represent 5-15% of the annualized cost of a typical building. This cost is recovered indirectly through higher rents or lower returns on investment.[241][242]
Private Pricing (Direct)
In contrast to most public parking, costs of private parking are recovered directly through fees. Most users are accustomed to the up-front cost in private structures, but when asked about pricing public spaces, there is overwhelming support to keep them free. Business owners commonly support subsidized parking and fear driving away customers with high parking prices but many economically successful areas, such as large commercial centers, have limited parking and high parking prices (Martens 2006). Real estate market analysis suggests that traditional urban areas, where parking is limited and priced, often experience greater economic growth than suburban areas (LLREI 2000). This suggests that parking pricing and other management strategies are not necessarily harmful to local economic development if an area is attractive and accessible in other ways (Roth, 2004; Martens, 2006).
Pricing & Utilization
The lack of pricing policies has fed parking demand which results in overutilization and inefficient use of existing parking infrastructure. Uniform prices also keep turnover rates low in the most convenient spaces, while less convenient spaces remain empty. The search for the perfect parking space often results in increased traffic and congestion. “Surveys indicate that 8-74% of urban traffic congestion is caused by vehicles cruising for on-street parking, and motorists spend an average of 3.5 to 13.9 minutes finding a curb parking space.”[243]
Pricing & Traffic
Pricing Policies can directly impact traffic, especially when applied to commuter parking. A fee increase from $1.37 to $2.73 has been shown to reduce auto commuting 12-39%. Other studies indicate that, “about 35% of drive-alone commuters would likely switch modes in response to $20 per month parking fees.”
Reducing traffic by pricing parking may be a prudent policy in congested corridors and central business districts but in suburban areas, price hikes can shift business to surrounding areas, a common fear of many business owners. This shift can be avoided and business activity increased when parking revenues are used to improve business district street conditions or fund transportation alternatives.[244][245][246]
Pricing Innovations
The potentially high costs and lack of pricing policy have created conditions ripe for innovation. Parking within central business districts is often over utilized and there are ample opportunities to recover costs by implementing appropriate pricing policies. Cities that are ahead of the curve are considering demand-responsive pricing models to increase turnover in congested central business districts and performance criteria to ensure objective pricing policies.
Cost Recovery
Parking that is over utilized is often unevenly distributed. Implementing pricing policies in central business districts can help redistribute demand for parking and can also help recover costs associated with parking infrastructure. In other parts of the world, cities like Madrid are also recovering environmental costs by considering impacts to the environment when pricing parking.
Demand-Responsive Pricing
One of the major problems identified by research of underpriced curbside parking, is the traffic induced by drivers in search of the perfect parking spot. This is especially problematic during peak periods and research indicates demand-responsive pricing can effectively increase turnover rates, but finding the right price can be challenging.
One suggestion is to apply performance criteria so an objective price can be identified to increase turnover rates for priority users. An example of a performance criteria is ensuring 15% of parking is left unoccupied at any one time. This would ensure that users who are willing to pay an appropriate price for convenient parking can do so.
The challenge is to convey the dynamic pricing to users in real-time so and informed decision can be made. Without proper information, drivers could be left circling the block trying to figure out the current price for a particular spot, which is no different than the traffic created in search of the perfect spot.
Revenue Reinvestment
If pricing policies can be developed to meet performance criteria, additional revenue should be generated during peak periods. This revenue can be reinvested in central business districts to further drive demand and revenue. The reinvestment can also overcome the fear of driving away customers because of demand-responsive pricing. The revenue can be used for street cleaning, security, landscaping and other public improvements.[247]
Case Studies
[edit | edit source]Chicago Parking Meters, LLC: Public vs. Private Pricing Policies
[edit | edit source]There is no clearer example of the stark difference in public and private pricing of parking than the City of Chicago concession agreement with a Morgan Stanley conglomerate in 2008. The city released a Request for Qualifications in February and a bid by Morgan Stanley was chosen in December of 2008. The concession agreement leased the revenue of 36,000 parking meters for a period of 75 years in exchange for a payment of $1.2 billion. The Morgan Stanley conglomerate later formed Chicago Parking Meters (CPM), LLC to manage the 3rd largest parking system in the US, the largest under management of a Public-Private Partnership.
Benefits
Since acquiring the lease in 2009, CPM has invested $35 million to improve parking infrastructure within the city. 36,000 individual meters were replaced with 4,700 pay stations that accept debit and credit cards. In 2014, CPM introduced a new cell phone app called ParkChicago that allows users to feed and reload the pay stations offsite. In the first month of release, more than 15,000 users had downloaded the app.
A new rate-structure was introduced shortly after the lease agreement that helped increase turnover in the central business district. The new investments in infrastructure and the new rate-structure are helping to reduce traffic in congested parts of the city.[248]
Drawbacks
A new 3-tiered pricing structure was formulated: A central downtown loop was created with rates of $6.50 per hour, a second central business district was created with rates of $4 per hour, and the rest of the city retained the original average rate of $2 per hour. Some areas of the city saw immediate four-fold price increases.
The infrastructure investments were not immediate and many of the existing parking meters quickly filled with quarters and stopped working. Many drivers received tickets because of the broken meters and businesses worried the new rates would drive away customers.
In July of 2009, the Chicago Inspector General released an analysis of the lease agreement and conservatively concluded the City was underpaid approximately $974 million. In 2008, the last year parking was under management of the city, revenues from parking meters totalled $23.8 million. In 2013, CPM reported revenue of $135.6 million and many believe CPM will repay the original investment within two decades.[249][250]
Conclusion
The city had not increased parking rates in 20 years for more than 70% of the 36,000 parking meters. Rates were quickly increased after the lease agreement, suggesting the curbside parking was under priced. CPM reinvested revenue to improve parking infrastructure and released a cell phone app for mobile payment. The ease of payment has helped relegate the rate shock of the new 3-tier pricing structure. “IBM’s Global Parking Survey awarded Chicago top honors for best on-street parking based on the least “emotional and economic pain.” The global survey, which analyzed 20 of the world’s most populous cities, evaluated the length of time and amount of difficulty involved in locating a parking spot, frequency of disputes over parking, the likelihood of receiving a parking ticket, and the number of parking tickets distributed. Chicago earned the top spot in the survey’s overall parking rankings, placing at or near the top in every category.”[251]
San Francisco SFpark: a demand-responsive parking system
[edit | edit source]One of the causes of congestion in tight urban areas is drivers looking for vacant curbside parking, or “circling”. San Francisco was the first in the U.S. to try and address the circling issue by designing and implementing a pilot program called SFpark. SFpark system helps to free up curbside parking spaces by offering demand-based parking rates: higher demand areas during peak hours would become more expensive thus effectively reducing demand. Vacant curbside parking spots would in turn reduce a number of drivers circling around and looking for street parking.
Benefits[252]
Easier parking
SFpark makes finding and paying for parking faster and easier. Demand-responsive pricing information online, via text, and through smartphone apps helps drivers find a space. Longer time limits and new meters that accept credit/debit cards, SFMTA parking cards and coins make parking more convenient and result in fewer parking tickets.
Faster public transit
Decreasing the number of drivers circling and double-parking will help keep roads clear so Muni and emergency vehicles can get through streets faster and more reliably.
Safer bicyclists and pedestrians
Drivers looking for parking are frequently distracted and fail to see bicyclists and pedestrians. Less double-parking and circling means fewer accidents and safer roads.
Better businesses neighborhoods
With parking faster to find and pay for, it’s easier to enjoy the City’s commercial areas. Less congested, safer and more pleasant neighborhoods mean better business. Plus, with less smog and greenhouse gas, we’ll all breathe easier.[253]
Drawbacks
The introduction of SFpark system improved traffic and parking availability in the tourist locations of San Francisco, but out-of-pocket expenses for locals and visitors increased substantially. Another inconvenience is primarily related to city visitors as they have little understanding of the system and the best time slots when the parking rates are reasonable.
Conclusion
Demand-responsive pricing for parking could be one of the “fixes” for most congested cities with ample curbside parking, especially business districts where drivers can and will pay premiums for free-flowing traffic and a “guaranteed” spot.
Madrid: Pricing strategy based on environmental factors
[edit | edit source]Madrid has implemented a “parking based on pricing by vehicle fuel emissions strategy”, which is dependent on fuel type as well as fluctuations during high congestion periods on certain streets. “Making people think about the price of pollution.” City officials hope to bring about awareness as well as change motorist’s behavior as a way to improve the city’s congestion issues and reduce pollution levels.
Madrid is the second worst city for pollution in Europe. With an increase in air pollution of 20% over the past 20 years, Madrid is pressed to find a solution which will bring about awareness while also making an effort to decrease pollution levels. The EU has threatened Madrid with high fines/penalties due to its lack of action in reducing the city’s high pollution levels. With 1 million cars enter the city every day, Madrid faces serious environmental concerns that may require a stronger approach than the current parking strategy.[254]
Components of Parking Strategy
Madrid’s parking system uses parking meters that link license plate numbers with Spain’s DMV system. Implemented in July 1, 2014, the new fuel pricing strategy is based on engine and year of car. The pricing structure imposes a 20% increase on Diesel cars (before 2001), 20% decrease for hybrid cars and free parking for electric cars. Less congested streets in the city center will have lower parking rates vs. higher congested streets closer to the city.
Benefits
Madrid hopes to reduce nitrogen dioxide levels, which are 5 times higher than the maximum EU level. The city also hopes to bring about awareness of fuel efficiency and its environmental impact.
“While the smart meters won’t affect the majority of drivers, Madrid estimates that one in four drivers will notice an increase in price.”[255]
Drawbacks
Critics of Madrid’s environmentally conscious pricing model for parking argue that only the wealthy can afford newer, fuel efficient cars and takes advantage of people who can’t afford a newer car.
This case study brings up an underlying issue with the political attitude toward congestion. An example being the mayor of London, Boris Johnson riding his bike around the city whereas the former mayor of Madrid and now head of the country’s political party was seen parking in a bus lane to withdraw cash from an ATM.
Conclusion
Madrid is taking a step in the right direction by imposing a fuel based pricing strategy on parking in the city center. The adjusted rates based on fuel efficiency will hopefully bring about the environmental awareness the city needs in order to make improvements in consumer behavior as well as a reduction in traffic congestion and air pollution levels.
While this strategy imposes restrictions to increase awareness and alter consumer behavior, political support and city ordinances focused on improving congestion and air quality standards are necessary in order to meet EU regulations.
Innovation found elsewhere: reduce traffic instead of adding more parking
[edit | edit source]The City of London (United Kingdom) was the first megapolis in Europe to start charging private vehicles access or “congestions” fees to enter city center. The historically narrow streets and the lack of parking spots, in addition to the ever-increasing traffic flow, kept London balancing on the brink of transportation crisis, until 2003. The Conservative Mayor Ken Livingston pushed for and introduced the program of charging congestion fees for private vehicles entering the 8-mile (radius) zone in Central London.
Benefits
Congestion charge revenues contribute a substantial amount to City’s transportation budget and the funds can be used for improving public transportation, adding more bicycle routes, etc. London’s congestion fee revenues account for about 10% of total transportation revenue. “Congestion Charging revenues increased from £222m in 2012/13 to £235m in 2013/14.”[256]
Drawbacks
Introduction of congestion charge scheme for a large city is an expensive project and annual costs of maintaining the system (video cameras, etc.) are high.
Conclusion
A number of other large cities around the globe, with similar traffic problems, followed London’s example and introduced congestion control programs. Among those early and successful adopters are Singapore, Milan, Stockholm, and a few others. Moscow, one of the most congested mega-cities in the world, is considering the program but, like many other megalopolises, politics play an important role in decision making, thus postponing the adoption of congestion fees.
Conclusion
[edit | edit source]Parking availability, pricing and payment options are relevant issues affecting car owners, businesses and local governments. Parking zoning strategies are often a heated topic of debate at local town hall meetings. Parking enforcement strategies are neither inexpensive nor effective while Infrastructure Costs, Operations and Maintenance, and Environmental Costs are often left unaccounted from pricing strategies, leaving local government parking systems in a vicious cycle. Luckily, parking innovations in the areas of payment, reservations, and pricing have drastically improved efficiency in the parking industry. Parking operators- public and private- are moving towards cashless parking systems that allow for increased options and services, and result in higher revenue by reducing operational costs. Others, like the City of Chicago, have decided to implement unconventional strategies such as leasing public curbside spaces to a private company. Whether through innovative and integrated technologies or through more structured and creative strategies, the parking industry has undeniably improved the way it services customers.
Additional Readings
[edit | edit source]- http://www.streetfilms.org/mba-the-right-price-for-parking/
- http://sfpark.org/about-the-project/
- http://greatergreaterwashington.org/post/684/shoupism-arrives-in-dc/
- http://www.telegraph.co.uk/technology/news/10573651/Smart-parking-app-begins-rollout-in-Londons-West-End.html
- https://www.tfl.gov.uk/cdn/static/cms/documents/congestion-charge-factsheet.pdf
- http://www.vtpi.org/vickrey.htm
- http://www.vtpi.org/tdm/tdm26.htm
- http://www.vtpi.org/tdm/tdm72.htm
- http://www.vtpi.org/tdm/tdm83.htm
References
[edit | edit source]
- ↑ a b http://www.fhwa.dot.gov/interstate/homepage.cfm
- ↑ Gold, Jenny. “A Modern Electric Grid: The New Highway System?” NPR.org. Accessed October 23, 2014. http://www.npr.org/templates/story/story.php?storyId=103349614.
- ↑ Kirk, Robert S. "Tolling of Interstate Highways: Issues in Brief". http://fas.org/sgp/crs/misc/R42402.pdf
- ↑ a b c d https://www.fhwa.dot.gov/publications/publicroads/96spring/p96sp44.cfm
- ↑ a b c d e Weingroff, Richard. “A Vast System of Interconnected Highways.” http://www.fhwa.dot.gov/highwayhistory/vast.pdf.
- ↑ III, Ashley Halsey. “5 Things to Know About Highway Tolling.” The Washington Post, April 30, 2014. http://www.washingtonpost.com/local/trafficandcommuting/5-things-to-know-about-highway-tolling/2014/04/30/97987b6a-d075-11e3-b812-0c92213941f4_story.html
- ↑ http://www.fhwa.dot.gov/infrastructure/clay.cfm
- ↑ http://www.fhwa.dot.gov/interstate/faq.htm#question2
- ↑ http://www.fhwa.dot.gov/infrastructure/tollroad.cfm
- ↑ III, Ashley Halsey. “5 Things to Know About Highway Tolling.” The Washington Post, April 30, 2014. http://www.washingtonpost.com/local/trafficandcommuting/5-things-to-know-about-highway-tolling/2014/04/30/97987b6a-d075-11e3-b812-0c92213941f4_story.html
- ↑ http://www.fhwa.dot.gov/ipd/pdfs/fact_sheets/federal_highway_tolling_program_061813.pdf
- ↑ a b c “To Toll or Not: Could the Feds Lift a Ban on Interstate Tolling?” http://www.governing.com/blogs/fedwatch/gov-could-feds-lift-ban-interstate-tolling.html
- ↑ a b The Highway Trust Fund and the Treatment of Surface Transportation Programs in the Federal Budget. Congressional Budget Office. June 2014. http://www.cbo.gov/sites/default/files/45416-TransportationScoring.pdf
- ↑ a b Hughes, Siobhan. “Legislators Move to Replenish Highway Trust Fund.” Wall Street Journal, July 11, 2014. http://online.wsj.com/articles/lawmakers-move-to-advance-measures-to-replenish-highway-trust-fund-1405013671
- ↑ a b c d http://www.fhwa.dot.gov/policyinformation/tollpage/documents/history.pdf
- ↑ http://www.fhwa.dot.gov/publications/publicroads/13julaug/03.cfm
- ↑ http://www.dot.gov/sites/dot.gov/files/docs/GROW%20AMERICA%20Act%20-%20FHWA%20Modal%20Fact%20Sheet.pdf
- ↑ http://www.dot.gov/highway-trust-fund-ticker
- ↑ http://thomas.loc.gov/cgi-bin/query/z?c113:H.R.5021:
- ↑ http://www.fhwa.dot.gov/planning/national_highway_system/
- ↑ Workman, Simon, Jaime Rall, and Jim Reed. “Toll Facilities in the United States,” February 1, 2013. http://www.ncsl.org/research/transportation/toll-facilities-in-the-united-states.aspx
- ↑ http://www.fhwa.dot.gov/interstate/faq.htm#question2
- ↑ http://www.fhwa.dot.gov/
- ↑ http://www.dot.gov/
- ↑ Kirk, Robert S. "Tolling of Interstate Highways: Issues in Brief". http://fas.org/sgp/crs/misc/R42402.pdf
- ↑ Swan Peter and Belzer, Michael "Empirical Evidence of Toll Road Traffic Diversion and Implications for Highway Infrastructure Privatization" http://www.tollfreeinterstates.com/sites/default/files/Empirical%20Evidence%20of%20Toll%20Road%20Traffic%20Diversion.pdf/
- ↑ Hayes, Howard "Tolling Interstates impacts supply chains" http://www.tollfreeinterstates.com/sites/default/files/American%20Shipper%20-%20Op_Ed%20-%20Feb%202014.pdf/
- ↑ http://www.fhwa.dot.gov/ipd/pdfs/fact_sheets/federal_highway_tolling_program_061813.pdf/Federal Highway Tolling Programs Fact Sheets
- ↑ https://www.fhwa.dot.gov/ipd/revenue/road_pricing/tolling_pricing/interstate_rr.aspx
- ↑ http://www.fhwa.dot.gov/ipd/fact_sheets/tolling_programs.aspx/source
- ↑ Kanter, Rosabeth and Fox, Daniel "Finding the money: An Overview of Infrastructure Finance Challenges and Opportunities"
- ↑ http://t4america.org/wp-content/uploads/2014/05/T4A-GROW-AMERICA-Act-summary-4-30-14.pdf
- ↑ Thorp, F. V. May 2, 2014. Congress Puts Brakes on Obama Plan to Allow Tolls on Highways. https:www.nbcnews.com/politics/congress/congress-puts-brakes-obama-plan-allow-tolls-highways-n95986
- ↑ a b Rork, J. C. (2009). Yardstick Competition in Toll Revenues: Evidence from US States. The London School of Economics and Policy, Vol. 43, No. 1, 123-139
- ↑ Halsey, A. April 29 2014. White House Opens the Doors to Tolling Interstate Systems, Removing Long Standing Prohibition. http://www.washingtonpost.com/local/trafficandcommuting/white-house-opens-door-to-tolls-on-interstate-highways-removing-long-standing-prohibition/2014/04/29/5d2b9f30-cfac-11e3-b812-0c92213941f4_story.html
- ↑ California Public Utilities Commission, Enforcement, Transportation Network Companies. http://www.cpuc.ca.gov/PUC/Enforcement/TNC/
- ↑ Geron, Tomio. 2013. California Becomes First State To Regulate Ridesharing Services Lyft, Sidecar, UberX. Forbes. September 9. http://www.forbes.com/sites/tomiogeron/2013/09/19/california-becomes-first-state-to-regulate-ridesharing-services-lyft-sidecar-uberx/.
- ↑ Blodget, Henry. "I Just Heard Some Startling Things About Uber..." Business Insider, June 11, 2014: "Uber keeps 20% of gross revenue and gives the rest to its drivers." http://www.businessinsider.com/uber-revenue-2014-6#ixzz3HdoyOrQe
- ↑ Macmillan, Douglas. "Lyft Reintroduces Commmissions on Rides, With a Twist." The Wall Street Journal, Aug. 11, 2014. "The company on Monday notified drivers that it would begin taking a 20% commission on rides in all cities where it operates, a Lyft spokeswoman said. With a new “power driver bonus” system, drivers who log 15 or more hours a week will get some to all of that money back." http://blogs.wsj.com/digits/2014/08/11/lyft-reintroduces-commissions-on-rides-with-a-twist/
- ↑ Sidecar. "Terms of Service." Accessed Oct. 30, 2014. "For use of its technology platform, Sidecar receives 20% or less of each payment of more than zero that any passenger makes to a driver as an administrative fee (“Sidecar Fee”)." http://www.side.cr/policies/terms-of-services/
- ↑ https://en.wikipedia.org/wiki/Hailo
- ↑ Cosgrave, Jenny. "Hailo, goodbye! Taxi app quits North America." CNBC, Oct. 15, 2014. http://www.cnbc.com/id/102089821
- ↑ Cooper, James, John Nelson, and Ray Mundy. Taxi! : Urban Economies and the Social and Transport Impacts of the Taxicab. Farnham, England: Ashgate Publishing, 2010. http://eds.b.ebscohost.com/ehost/detail/detail?sid=6472bab9-b058-4641-8df3-ac5234b9f535%40sessionmgr115&vid=0&hid=102&bdata=JnNpdGU9ZWhvc3QtbGl2ZSZzY29wZT1zaXRl#db=nlebk&AN=336373.
- ↑ Ibid.
- ↑ Ibid.
- ↑ Frankena, Mark W., and Paul A. Pautler. “An Economic Analysis of Taxicab Regulation.” Federal Trade Commission, Bureau of Economics, May 1984. http://www.ftc.gov/sites/default/files/documents/reports/economic-analysis-taxicab-regulation/233832.pdf.
- ↑ Ibid.
- ↑ Wikipedia. (http://en.wikipedia.org/wiki/Taxicabs_of_the_United_Kingdom)
- ↑ Cooper, James, John Nelson, and Ray Mundy. Taxi! : Urban Economies and the Social and Transport Impacts of the Taxicab. Farnham, England: Ashgate Publishing, 2010. Page 7.
- ↑ Diamandis, Peter. 2014. "Uber vs. the Law (My Money's on Uber)." Forbes. http://www.forbes.com/sites/peterdiamandis/2014/09/08/uber-vs-the-law-my-moneys-on-uber/.
- ↑ Krohe, James, Jr. 2013. "Not Your Daddy's Taxi." Planning 79 (5) 15-17.
- ↑ Fowler, Geoffrey, A. 2014. "Testing UberX, Lyft and Sidecar Against a Cab in Six Cities." The Wall Street Journal. http://online.wsj.com/news/articles/SB10001424052702304250204579433113467536876.
- ↑ (n.d. SideCar. Accessed October 12, 2014. http://www.side.cr/about.)
- ↑ Op cit. Frankena and Pautler
- ↑ Ibid.
- ↑ n.d. Sidecar. Accessed October 12, 2014. http://www.side.cr/about
- ↑ n.d. Lyft. Accessed October 8, 2014. https://www.lyft.com/
- ↑ n.d. Uber. Accessed October 10, 2014. https://www.uber.com/about
- ↑ http://blog.uber.com/driverscreening
- ↑ http://blog.uber.com/ridesharinginsurance
- ↑ Brekke, Dan. “Taxi Drivers Want San Francisco to Crack Down on ‘Ride Share’ Insurance.” KQED, January 8, 2014. http://ww2.kqed.org/news/2014/01/08/taxi-drivers-want-insurance-crackdown-on-ride-share-companies/.
- ↑ Dent, Steve. 2014. "What you need to know about Uber, Lyft and other app-based car services." Engadget. http://www.engadget.com/2014/06/27/uber-lyft-explainer/.
- ↑ Kovach, Steve. 2014. "Uber Did Its Best To Warn You About New Year's Eve Surge Pricing, But Everyone Complained Anyway." Business Insider. http://www.businessinsider.com/uber-new-years-eve-surge-pricing-2014-1.
- ↑ Op cit. Cooper et al., unless otherwise noted
- ↑ Vock, Daniel C. “State Regulators Step In On Ridesharing Controversies.” Stateline.org, October 10, 2013. http://global.factiva.com/redir/default.aspx?P=sa&an=STLNO00020131010e9aa00002&cat=a&ep=ASE.
- ↑ Soper, Taylor. “Washington Prepares to Enact State Insurance Requirements for Uber, Lyft.” GeekWire. Accessed October 10, 2014. http://www.geekwire.com/2014/cyris-habib-state-ride-sharing/.
- ↑ Di Caro, Martin. “Ridesharing Legislation Passes D.C. Council Over Protests Of Cabbies, Teamsters.” WAMU 88.5, October 29, 2014. http://wamu.org/news/14/10/28/uberx_lyft_win_key_battle_in_dc_council.
- ↑ Witte, Brian. 2014. Maryland Lawmaker: Legislation on Web-Based Ridesharing Likely. August 12. http://www.insurancejournal.com/news/east/2014/08/12/337315.htm.
- ↑ Op cit. Vock.
- ↑ Oklobdzija, Stan. “Will Big Taxi’s Massive Political Spending Advantage Leave Ride-Sharing Groups Stranded?” Sunlight Foundation. Accessed October 10, 2014. http://sunlightfoundation.com/blog/2014/07/31/will-big-taxis-massive-political-spending-advantage-leave-ride-sharing-groups-stranded/.
- ↑ Nussbaum, Paul. “Two PUC Judges: Bar Ride-Sharing Uber from Pa.” The Philadelphia Inquirer, September 26, 2014, CITY-D edition, sec. BUSINESS.
- ↑ Op cit. Oklobdzija.
- ↑ Soper, Taylor. 2014. "Seattle City Council approves cap on Lyft, UberX, Sidecar drivers." GeekWire. http://www.geekwire.com/2014/seattle-city-council-approves-cap-lyft-uberx-sidecar-drivers/.
- ↑ Op cit. Frankena and Pautler, unless otherwise noted
- ↑ First Research Inc. Taxi & Limousine Services - Quarterly Update 7/14/2014. Austin, United States: Hoover’s Inc., July 14, 2014. http://search.proquest.com/docview/1545041605
- ↑ US Department of Labor, Bureau of Labor Statistics. "Transportation and Material Moving: Taxi Drivers and Chauffeurs." http://www.bls.gov/ooh/transportation-and-material-moving/taxi-drivers-and-chauffeurs.htm
- ↑ McFarland, M. (2014, May 27). Uber’s remarkable growth could end the era of poorly paid cab drivers. Retrieved October 2014, from http://www.washingtonpost.com/blogs/innovations/wp/2014/05/27/ubers-remarkable-growth-could-end-the-era-of-poorly-paid-cab-drivers/
- ↑ Op cit. First Research Inc.
- ↑ Krohe, James, Jr. 2013. "Not Your Daddy's Taxi." Planning 79 (5) 15-17.
- ↑ Rampell, C. (2014, June 12). Who will win the ridesharing war? Probably not consumers. The Washington Post. Retrieved from http://www.washingtonpost.com/opinions/catherine-rampell-consumers-likely-to-lose-the-uber-lyft-ride-share-war/2014/10/02/f4810f74-4a6c-11e4-a046-120a8a855cca_story.html
- ↑ Op cit. Frankena and Pautler, p. 112
- ↑ Op cit. Cooper et al., p. 16
- ↑ Op cit. Cooper et al, p. 7
- ↑ Ibid.
- ↑ Diamandis, Peter. 2014. "Uber vs. the Law (My Money's on Uber)." Forbes. http://www.forbes.com/sites/peterdiamandis/2014/09/08/uber-vs-the-law-my-moneys-on-uber/.
- ↑ Gaber, W., Goetsch, U., Diel, R., Doerr, H, & Gottschalk. (2009) Screening for Infectious Diseases at International Airports: The Frankfurt Model. [Electronic Version]. Aviation, Space and Environmental Medicine, 80(7), 595-600.
- ↑ Oatis, J. (October 28, 2014). Chronology – Worst Ebola outbreak on record tests global response. Retrieved on October 31, 2014 from http://www.reuters.com/article/2014/10/28/health-ebola-idUSL2N0SG2FH20141028.
- ↑ Centers for Disease Control (October 2014). Ebola Outbreak in West Africa – Case Counts. From http://www.cdc.gov/vhf/ebola/outbreaks/2014-west-africa/index.html.
- ↑ Centers for Disease Control (October 2014). 2014 Ebola Outbreak in West Africa – Outlook Distribution Map. From http://www.cdc.gov/vhf/ebola/outbreaks/2014-west-africa/distribution-map.html
- ↑ World Health Organization (November 2014). Statement on the 1st meeting of the IHR Emergency Committee on the 2014 Ebola outbreak in West Africa. From http://www.who.int/mediacentre/news/statements/2014/ebola-20140808/en/
- ↑ Centers for Disease Control and Prevention (November 2014). Ebola (Ebola Virus Disease). From http://www.cdc.gov/vhf/ebola/index.html
- ↑ Mayo Clinic (November 2014). Ebola virus and Marburg virus Symptons. From http://www.mayoclinic.org/diseases-conditions/ebola-virus/basics/symptoms/con-20031241
- ↑ World Health Organization (November 2014). Ebola virus disease. From http://www.who.int/mediacentre/factsheets/fs103/en/
- ↑ World Health Organization (November 2014). Ebola virus disease. From http://www.who.int/mediacentre/factsheets/fs103/en/
- ↑ Park, Madison. CNN (October 2014). Report: Ebola outbreak probably started with 2-year-old in Guinea. From http://www.cnn.com/2014/08/11/health/ebola-patient-zero/
- ↑ World Health Organization (October 2014). Ebola Response Roadmap Situation Report. From http://apps.who.int/iris/bitstream/10665/137376/1/roadmapsitrep_29Oct2014_eng.pdf?ua=1
- ↑ Botlho, Greg. CNN (October 2014). U.S. Ebola patient: The travels and travails of Thomas Eric Duncan. From http://www.cnn.com/2014/10/01/health/us-ebola-patient/
- ↑ Corcoran, Kiernan. Associated Press (October 2014). How Ebola victim Thomas Eric Duncan's organs slowly failed and he begged to be put in a diaper as he lay dying. From http://www.dailymail.co.uk/news/article-2791171/ebola-victim-thomas-eric-duncan-s-organs-slowly-failed-begged-diaper-lay-dying.html
- ↑ Snow, Kate, and Hasani Gittens. NBC News (October 2014). Ebola Nurse Amber Vinson Checked With CDC Before Flight: Source. From http://www.nbcnews.com/storyline/ebola-virus-outbreak/ebola-nurse-amber-vinson-checked-cdc-flight-source-n226961
- ↑ Centers for Disease Control and Prevention (October 2014). Enhanced Ebola Screening to Start at Five U.S. Airports and New Tracking Program for all People Entering from Ebola-affected Countries. From http://www.cdc.gov/media/releases/2014/p1008-ebola-screening.html
- ↑ Berman, Mark. Washington Post (October 2014). All travelers from countries with Ebola must now fly through U.S. airports with stricter screening. http://www.washingtonpost.com/news/post-nation/wp/2014/10/21/all-travelers-from-countries-with-ebola-must-now-fly-through-u-s-airports-with-stricter-screening/
- ↑ Christensen, Jen; Joe Sutton, and Ray Sanchez. CNN (October 2014). Ebola screenings begin at JFK, four more airports start next week. From http://www.cnn.com/2014/10/11/health/ebola/
- ↑ Centers for Disease Control and Prevention. (October 2014). Ebola Virus Disease (Ebola) Pre-Departure/Exit Screening at Points of Departure in Affected Countries. From http://wwwnc.cdc.gov/travel/pdf/ebola-exit-screening.pdf
- ↑ ABC News (October 2014). From Soffee Stand to Bowling Alley: Retracing Steps of Doctor Who Tested Positive for Ebola. From http://abcnews.go.com/Health/retracing-steps-dr-craig-spencer-ebola-diagnosis/story?id=26418093
- ↑ CBS News (October 2014). New York City Doctor Tests Positive for Ebola. From http://newyork.cbslocal.com/2014/10/23/cbs-2-officials-looking-into-possible-ebola-case-in-new-york-city/
- ↑ Marchione, Marilynn. Associated Press (October 2014). Mandatory Ebola quarantines in New York and New Jersey. http://www.myfoxny.com/story/26887903/mandatory-ebola-quarantines
- ↑ Crane, Misti. Columbus Dispatch (November 2014). Ohio adopts mandatory Ebola quarantine for exposed workers. http://www.dispatch.com/content/stories/local/2014/11/01/ohio-adopts-mandatory-ebola-quarantine-for-exposed-workers.html
- ↑ Sanchez, Ray; Catherine Shoichet, and Faith Karimi, CNN (November 2014). Ebola update: Main judge rejects quarantine for nurse Kaci Hickox. From http://www.cnn.com/2014/10/31/health/us-ebola/index.html
- ↑ Hicks, Josh. Washington Post (October 2014). Studies show airport Ebola screenings largely ineffective. From http://www.washingtonpost.com/blogs/federal-eye/wp/2014/10/31/these-scientific-studies-show-that-airport-ebola-screenings-are-largely-ineffective/
- ↑ Silver, Nate. FiveThirtyEight (October 2014). Why An Ebola Travel Ban Wouldn't Work. From http://fivethirtyeight.com/datalab/why-an-ebola-flight-ban-wouldnt-work/
- ↑ Cohn, Jonathan. The New Republic (October 2014). The CDC's New Ebola Plan Is Better Than a Travel Ban. From http://www.newrepublic.com/article/119937/cdc-announces-active-monitoring-ebola-better-travel-ban
- ↑ Berman, Mark. Washington Post (October 2014). Why new airport screening still can’t prevent more Ebola cases in the U.S. From http://www.washingtonpost.com/news/post-nation/wp/2014/10/07/why-new-airport-screening-still-cant-prevent-more-ebola-cases-in-the-u-s/
- ↑ Zoroya, Gregg. USA Today (October 2014). Pentagon builds units to transport Ebola patients. From http://www.usatoday.com/story/news/world/2014/10/26/ebola-transport-military-patients-aircraft-phoenix-air/17669025/
- ↑ http://thebakken.com/articles/642/classification-of-crude-oil-transported-by-rail-from-shale-plays
- ↑ http://www.powerincooperation.com/EN/Pages/drilling-and-completion.html
- ↑ http://www.bloomberg.com/news/2014-07-04/u-s-seen-as-biggest-oil-producer-after-overtaking-saudi.html
- ↑ http://keystone-xl.com/
- ↑ http://www.cbc.ca/news/canada/montreal/lac-m%C3%A9gantic-unsealed-documents-say-train-engineer-didn-t-follow-mm-a-rules-1.2675443
- ↑ http://www.american-rails.com/class-i-railroads.html
- ↑ "Chronology of Railroads In America." American Association of Railroads, Economics and Policy Department, 2013
- ↑ Committee for the Study of the Railroad Tank Car Design Process. (1994). Ensuring railroad tank car safety. Transportation Research Board, p 30.
- ↑ Committee for the Study of the Railroad Tank Car Design Process. (1994). Ensuring railroad tank car safety. Transportation Research Board, p 30.
- ↑ Committee for the Study of the Railroad Tank Car Design Process. (1994). Ensuring railroad tank car safety. Transportation Research Board, p 30.
- ↑ Committee for the Study of the Railroad Tank Car Design Process. (1994). Ensuring railroad tank car safety. Transportation Research Board, p 42.
- ↑ Committee for the Study of the Railroad Tank Car Design Process. (1994). Ensuring railroad tank car safety. Transportation Research Board, p 62.
- ↑ Committee for the Study of the Railroad Tank Car Design Process. (1994). Ensuring railroad tank car safety. Transportation Research Board, p 63.
- ↑ http://science.howstuffworks.com/transport/engines-equipment/train3.htm
- ↑ https://www.fra.dot.gov/Page/P0395
- ↑ National Transportation Safety Board. 2012. Derailment of CN Freight Train U70691-18 With Subsequent Hazardous Materials Release and Fire, Cherry Valley, Illinois, June 19, 2009. Railroad Accident Report NTSB/RAR-12/01. Washington, DC.
- ↑ (http://phmsa.dot.gov/hazmat/osd/chronology)
- ↑ (http://phmsa.dot.gov/portal/site/PHMSA/menuitem.6f23687cf7b00b0f22e4c6962d9c8789/?vgnextoid=4821ec1c60f23410VgnVCM100000d2c97898RCRD&vgnextchannel=0f0b143389d8c010VgnVCM1000008049a8c0RCRD&vgnextfmt=print)
- ↑ http://www.dot.gov/briefing-room/letter-association-american-railroads
- ↑ http://phmsa.dot.gov/hazmat/osd/chronology
- ↑ http://phmsa.dot.gov/hazmat/osd/chronology
- ↑ http://www.gpo.gov/fdsys/pkg/FR-2014-08-01/pdf/2014-17764.pdf
- ↑ http://www.gpo.gov/fdsys/pkg/FR-2014-08-01/pdf/2014-17764.pdf
- ↑ https://www.oig.dot.gov/sites/default/files/FRA%20Oversight%20of%20Hazmat%20by%20Rail%20Announcement%20Letter%5E10-29-14.pdf
- ↑ http://www.eia.gov/todayinenergy/detail.cfm?id=16631
- ↑ http://www.csx.com/index.cfm/about-csx/company-overview/
- ↑ http://www.csxcrudebyrail.com/index.cfm/refineries/
- ↑ http://www.csx.com/index.cfm/media/press-releases/csx-corporation-announces-record-third-quarter-results/
- ↑ http://investors.csx.com/phoenix.zhtml?c=92932&p=quarterlyearnings
- ↑ http://www.csxcrudebyrail.com/index.cfm/resources/crude-oil-network-map/
- ↑ http://commons.wikimedia.org/wiki/File:CSX_Transportation_system_map.svg
- ↑ http://www.bnsf.com/about-bnsf/financial-information/performance-summary/pdf/performance_update_2Q_2014.pdf
- ↑ http://www.cn.ca/en/our-business/transportation-services/rail
- ↑ http://www.cn.ca/-/media/Files/Investors/Investor-Financial-Quarterly/Investor-Financial-Quarterly-2014/Q3/Q3-2014-Earnings-release-en.pdf
- ↑ (http://www.cpr.ca/en/investors/cp-reports-record-q3-2014)( http://www.cpr.ca/en/our-markets/energy)
- ↑ http://www.cpr.ca/en/investors-site/Documents/cp-2014-q3-presentation.pdf
- ↑ http://www.up.com/aboutup/corporate_info/uprrover/index.htm
- ↑ http://www.uprr.com/newsinfo/releases/financial/2014/1023_3qearnings.shtml
- ↑ http://www.up.com/aboutup/reference/maps/system_map/index.htm
- ↑ http://www.nscorp.com/content/nscorp/en/get-to-know-norfolk-southern/about-ns.html
- ↑ http://www.nscorp.com/content/dam/QuarterlyEventFiles/3q-2014/3q2014_earnings_release.pdf
- ↑ http://www.nscorp.com/content/nscorp/en/ship-with-norfolk-southern/system-overview.html
- ↑ http://www.kcsouthern.com/en-us/AboutKCS/Pages/CompanyProfile.aspx
- ↑ http://www.kcsouthern.com/en-us/Services/Documents/MayJuneBeyondBorders.html
- ↑ U.S. Energy Information Administration, based on Association of American Railroads
- ↑ http://news.gc.ca/web/article-en.do?nid=841129; http://www.tsb.gc.ca/eng/medias-media/sur-safe/letter/rail/2013/r13d0054/r13d0054-617-09-13.asp
- ↑ http://www.gpo.gov/fdsys/pkg/FR-2014-08-01/pdf/2014-17764.pdf
- ↑ http://www.gpo.gov/fdsys/pkg/FR-2014-08-01/pdf/2014-17762.pdf
- ↑ Dave Galt, Executive Director of the Montana Petroleum Association - phone interview on November, 11th, 2014
- ↑ http://www.dot.gov/sites/dot.gov/files/docs/Emergency%20Restriction%20-%20Prohibition%20Order%20(Docket%20DOT-OST-2014-0025).pdf
- ↑ (http://www.thebakken.com/articles/642/classification-of-crude-oil-transported-by-rail-from-shale-plays)
- ↑ https://www.aar.org/Pages/RailSafetyPolicy.aspx
- ↑ http://csis.org/files/publication/140306_Pumphrey_SafetyCrudeOilRail_Web.pdf
- ↑ Committee for the Study of the Railroad Tank Car Design Process. (1994). Ensuring railroad tank car safety. Transportation Research Board, p 50.
- ↑ https://www.ntsb.gov/doclib/reports/2012/RAR1201.pdf
- ↑ http://csis.org/files/publication/140306_Pumphrey_SafetyCrudeOilRail_Web.pdf
- ↑ http://csis.org/files/publication/140306_Pumphrey_SafetyCrudeOilRail_Web.pdf
- ↑ http://csis.org/files/publication/140306_Pumphrey_SafetyCrudeOilRail_Web.pdf
- ↑ http://www.nytimes.com/2014/02/21/business/bnsf-buying-5000-safer-railroad-cars.html?_r=0
- ↑ http://www.bloomberg.com/news/2014-10-24/berkshire-s-bnsf-to-add-surcharge-on-older-oil-tank-cars.html
- ↑ Source-http://www.gpo.gov/fdsys/pkg/FR-2014-08-01/pdf/2014-17764.pdf
- ↑ http://www.dot.gov/briefing-room/us-dot-announces-comprehensive-proposed-rulemaking-safe-transportation-crude-oil
- ↑ http://www.ecfr.gov/cgi-bin/text-idx?SID=16f8dadac221b1dcb4e6d8ab9f8a7188&tpl=/ecfrbrowse/Title49/49tab_02.tpl
- ↑ http://www.dot.gov/sites/dot.gov/files/docs/Emergency%20Restriction%20-%20Prohibition%20Order%20(Docket%20DOT-OST-2014-0025).pdf
- ↑ http://boe.aar.com/CPC-1258%20OT-55-N%208-5-13.pdf
- ↑ Ref FR Vol 79, No. 148 CFR 49 Parts 173, 173 et al -
- ↑ http://online.wsj.com/articles/SB10001424052702304773104579268871635384130
- ↑ http://www.gpo.gov/fdsys/granule/FR-2008-11-26/E8-27826
- ↑ Source-http://www.gpo.gov/fdsys/pkg/FR-2014-08-01/pdf/2014-17764.pdf
- ↑ http://en.wikipedia.org/wiki/Lac-M%C3%A9gantic_rail_disaster
- ↑ http://en.wikipedia.org/wiki/Lac-M%C3%A9gantic_rail_disaster
- ↑ Source-http://www.gpo.gov/fdsys/pkg/FR-2014-08-01/pdf/2014-17764.pdf
- ↑ Source-http://www.gpo.gov/fdsys/pkg/FR-2014-08-01/pdf/2014-17764.pdf
- ↑ http://www.eia.gov/todayinenergy/detail.cfm?id=17391
- ↑ http://www.forbes.com/sites/jamesconca/2014/04/26/pick-your-poison-for-crude-pipeline-rail-truck-or-boat/
- ↑ http://www.forbes.com/sites/jamesconca/2014/04/26/pick-your-poison-for-crude-pipeline-rail-truck-or-boat/
- ↑ UNCLASSIFIED – CRITICAL INFRASTRUCTURE BULLETIN UNCLASSIFIED – CRITICAL INFRASTRUCTURE BULLETIN Monday, November 10, 2014 MONTANA CRITICAL INFRASTRUCTURE BULLETIN
- ↑ Canadian Energy Pipeline Association- www.cepa.com
- ↑ http://earthjustice.org/blog/2014-march/explosive-crude-by-rail-rolls-into-main-street-america
- ↑ http://www.eia.gov/todayinenergy/detail.cfm?id=10431
- ↑ http://online.wsj.com/articles/SB10001424052702304773104579268871635384130
- ↑ http://www.eia.gov/tools/faqs/faq.cfm?id=32&t=6
- ↑ http://www.eia.gov/tools/faqs/faq.cfm?id=32&t=6
- ↑ http://www.eia.gov/energyexplained/index.cfm?page=oil_refining#tab3
- ↑ Shannon McDonald, The Parking Garage: Design and Evolution of a Modern Urban Form (Washington, DC: Urban Land Institute, 2007), p.110
- ↑ http://digital.library.okstate.edu/encyclopedia/entries/p/pa015.html
- ↑ http://search.proquest.com/docview/1536168345
- ↑ Soumya Dey, “‘Asset Lite’ Payment Options AND Occupancy Detection FOR METERED CURBSIDE PARKING,” Institute of Transportation Engineers. ITE Journal 84, no. 6, 2014, p. 30
- ↑ Anne Gearan, The Free Lance - Star, May 29, 1991, p.30
- ↑ http://www.sfgate.com/bayarea/article/Parking-Meters-Going-HighTech-ln-Berkeley-2911644.php
- ↑ http://www.bcdgroup.com/en/parkmobile/
- ↑ http://www.morganstanley.com/about/press/articles/045f9d28-c142-11dd-b3a2-8df06e0b6eda.html
- ↑ http://www.collectorsweekly.com/articles/please-feed-the-meters
- ↑ http://sfpark.org/about-the-project
- ↑ http://www.vtpi.org/tca/tca0504.pdf
- ↑ http://shoup.bol.ucla.edu/ProblemsWithParkingRequirementsInZoningOrdinances.pdf
- ↑ http://www.mtc.ca.gov/planning/smart_growth/parking/6-12/Parking_Code_Guidance_June_2012.pdf
- ↑ https://epic.org/privacy/licenseplates/
- ↑ http://blogs.ei.columbia.edu/2012/05/09/emissions-from-the-cement-industry/
- ↑ http://search.proquest.com/docview/227780006/
- ↑ http://www.governing.com/columns/urban-notebook/The-Fascinating-History-of.html
- ↑ http://search.proquest.com/docview/227780006
- ↑ http://search.proquest.com/docview/227780006
- ↑ http://search.proquest.com/docview/227780006
- ↑ http://search.proquest.com/docview/227780006
- ↑ https://www.parking.org/media/245544/2013_emerging%20trends_web.pdf
- ↑ TCRP Report 32: Multipurpose Transit Payment Media, http://onlinepubs.trb.org/onlinepubs/tcrp/tcrp_rpt_32.pdf
- ↑ http://www.digitalpaytech.com/parking-solutions/applications/lep.aspx
- ↑ https://comp.ddot.dc.gov/Documents/District%20Department%20of%20Transportation%20Curbside%20Management%20Study.pdf
- ↑ Soumya Dey, “‘Asset Lite’ Payment Options AND Occupancy Detection FOR METERED CURBSIDE PARKING,” Institute of Transportation Engineers. ITE Journal 84, no. 6, 2014, p. 30.
- ↑ TCRP Report 32: Multipurpose Transit Payment Media - tcrp_rpt_32.pdf, Foreword.
- ↑ Soumya Dey, “‘Asset Lite’ Payment Options AND Occupancy Detection FOR METERED CURBSIDE PARKING,” Institute of Transportation Engineers. ITE Journal 84, no. 6, 2014, p. 22.
- ↑ Soumya Dey, “‘Asset Lite’ Payment Options AND Occupancy Detection FOR METERED CURBSIDE PARKING,” 32.
- ↑ http://www.sciencedirect.com/science/article/pii/S095741741200104
- ↑ http://www.contracostatimes.com/breaking-news/ci_26953632/bart-charging-1-parking-fee-at-oakland-airport
- ↑ http://www.sciencedirect.com/science/article/pii/S0957417412001042
- ↑ http://www.sciencedirect.com/science/article/pii/S0957417412001042
- ↑ http://www.sciencedirect.com/science/article/pii/S0968090X14000916
- ↑ http://www.broadwayworld.com/bwwgeeks/article/Parkmobile-LLC-to-Establish-Center-for-Parking-Innovation-in-Boston-20141110#
- ↑ http://www.broadwayworld.com/bwwgeeks/article/Parkmobile-LLC-to-Establish-Center-for-Parking-Innovation-in-Boston-20141110#
- ↑ http://www.lexisnexis.com/hottopics/lnacademic/?verb=sr&csi=8054&sr=HLEAD(Parkmobile,%20LLC%20to%20Establish%20Center%20for%20Parking%20Innovation%20in%20Boston)%20and%20date%20is%202014
- ↑ http://www.washingtonpost.com/blogs/dr-gridlock/wp/2014/10/27/new-parking-options-but-higher-rates-kick-in-nov-1-at-reagan-national/
- ↑ NPA (2009), Parking In America, The National Parking Association’s First Annual Review of Parking Rates in the United States and Canada, National Parking Association
- ↑ 7 ITE (1999), Transportation Planning Handbook, ITE (www.ite.org) p. 535.
- ↑ http://www.vtpi.org/tca/tca0504.pdf
- ↑ Donald Shoup (2005), The High Cost of Free Parking, Planners Press (www.planning.org). p. 197.
- ↑ Donald Shoup (2005), The High Cost of Free Parking, Planners Press (www.planning.org). p. 218.
- ↑ Summary of Travel Trends; 1990 National Personal Transportation Survey, Bureau of Transportation Statistics, USDOT (www.fhwa.dot.gov/ohim/nptspage.htm)
- ↑ http://www.vtpi.org/tdm/tdm26.htm
- ↑ Donald Shoup (2007), “Cruising For Parking,” Access 30, University of California Transportation Center (www.uctc.net), Spring 2007, pp. 16-22; at www.uctc.net/access/access30.shtml.
- ↑ ICF (1997), Guidance on the Use of Market Mechanisms to Reduce Transportation Emissions, USEPA (www.epa.gov/omswww/market.htm).
- ↑ Arun R. Kuppam, Ram M. Pendyala, and Mohan A. V. Gollakoti (1998), “Stated Response Analysis of the Effectiveness of Parking Pricing Strategies for Transportation Control,” Transportation Research Record 1649, TRB (www.trb.org), pp. 39-46.
- ↑ Douglas Kolozsvari and Donald Shoup (2003), “Turning Small Change Into Big Changes,” ACCESS 23, University of California Transportation Center (www.uctc.net), Fall 2003, pp. 2-7; athttp://shoup.bol.ucla.edu/SmallChange.pdf.
- ↑ Donald Shoup (2006), The Price of Parking On Great Streets, Planetizen (www.planetizen.com/node/19150).
- ↑ http://chicagometers.com/fact-sheet.aspx
- ↑ http://www.inthepublicinterest.org/case/chicagos-parking-meters
- ↑ http://www.chicagoreader.com/Bleader/archives/2014/05/02/private-company-rakes-in-millions-more-from-chicagos-parking-meters
- ↑ http://chicagometers.com/fact-sheet.aspx
- ↑ http://sfpark.org/about-the-project/benefits/
- ↑ http://sfpark.org/about-the-project/benefits/
- ↑ http://cities-today.com/2014/05/smart-parking-meters-madrid-hit-fuel-inefficient-cars/
- ↑ http://truthatlas.com/can-smart-parking-meters-turn-madrid-drivers-into-conscious-environmentalists/
- ↑ Transport for London Annual Report and Statement of Accounts 2013/14, p. 77, www.tfl.gov.uk