XForms/Pie Chart
Motivation[edit | edit source]
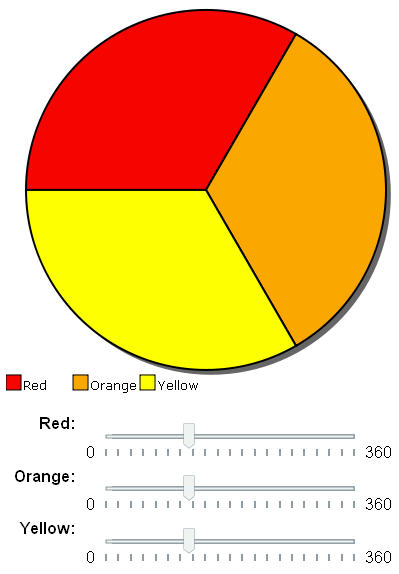
You want to use range controls to interactively change a drawing such as a pie chart. In this case we use a JavaScript library that modifies an SVG image. The data for the pie chart is kept in an instance in the model.
Screen Image[edit | edit source]

Link to Working XForms Application[edit | edit source]
XForms Example of Dynamic Labels
Sample Program[edit | edit source]
<?xml version="1.0" encoding="iso-8859-1"?>
<html xmlns="http://www.w3.org/1999/xhtml" xmlns:xf="http://www.w3.org/2002/xforms" xmlns:ev="http://www.w3.org/2001/xml-events" xmlns:xsd="http://www.w3.org/2001/XMLSchema" xmlns:xsi="http://www.w3.org/2001/XMLSchema-instance" xmlns:svg="http://www.w3.org/2000/svg" xmlns:xlink="http://www.w3.org/1999/xlink" xmlns:xi="http://www.w3.org/2001/XInclude">
   <head>
      <link rel="stylesheet" href="pie-chart.css" type="text/css" />
      <title>Pie Chart with XForms Range Controls</title>
      <script type="text/javascript" src="pie-chart.js" />
      <xf:model id="theModel">
         <xf:instance id="theData">
            <charts xmlns="">
               <piechart>
                  <wedge01>120</wedge01>
                  <wedge02>120</wedge02>
                  <wedge03>120</wedge03>
                  <wedge04>0.00</wedge04>
               </piechart>
            </charts>
         </xf:instance>
         <!-- Section 2 -->
         <xf:bind nodeset="/charts/piechart/wedge01" type="xsd:decimal" />
         <xf:bind nodeset="/charts/piechart/wedge02" type="xsd:decimal"  />
         <xf:bind nodeset="/charts/piechart/wedge03" type="xsd:decimal" />
         <xf:bind nodeset="/charts/piechart/wedge04" type="xsd:decimal" />
         <xf:bind nodeset="/charts/piechart/wedge04" calculate="/charts/piechart/wedge01 + /charts/piechart/wedge02 + /charts/piechart/wedge03" />
      </xf:model>
   </head>
   <body onload="showChart('chart')">
      <h1>Pie Chart with XForms Range Controls</h1>
      <div id="chart">
         <!-- Placeholder for chart.  Javascript will load here. -->
      </div>
       <br />
      <xf:range ref="/charts/piechart/wedge01" id="s2l1" start="0" end="360" incremental="true">
         <xf:label>Red:</xf:label>
         <xf:action ev:event="xforms-value-changed">
            <xf:load resource="javascript:updateChart('chart')" />
         </xf:action>
      </xf:range>

      <xf:range ref="/charts/piechart/wedge02" start="0" end="360" incremental="true">
         <xf:label>Orange:</xf:label>
         <xf:action ev:event="xforms-value-changed">
            <xf:load resource="javascript:updateChart('chart')" />
         </xf:action>
      </xf:range>

      <xf:range ref="/charts/piechart/wedge03" start="0" end="360" incremental="true">
         <xf:label>Yellow:</xf:label>
         <xf:action ev:event="xforms-value-changed">
            <xf:load resource="javascript:updateChart('chart')" />
         </xf:action>
      </xf:range>
   </body>
</html>
Discussion[edit | edit source]
This example a nice clean way to interactively change a value just using the mouse. No keyboard required. Here is the sample for the first range control:
<xf:range ref="/charts/piechart/wedge01" start="0" end="360" incremental="true">
    <xf:label>Red:</xf:label>
    <xf:action ev:event="xforms-value-changed">
        <xf:load resource="javascript:updateChart('chart')" />
    </xf:action>
</xf:range>
This is an example of how an instance document can be used as the interface to an external component in a form. You just have to put the data in the instance and tell the application to get the data.
Credits[edit | edit source]
This example was originally inspired by the 1040 tax form example on the Mozilla web site. The JavaScript for drawing the pie chart was taken from that example.