Trigonometry/Graphs of Sine and Cosine Functions
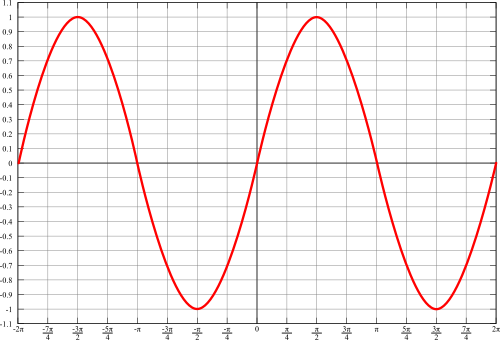
The graph of the sine function looks like this:
Careful analysis of this graph will show that the graph corresponds to the unit circle. x is essentially the degree measure (in radians), while y is the value of the sine function.
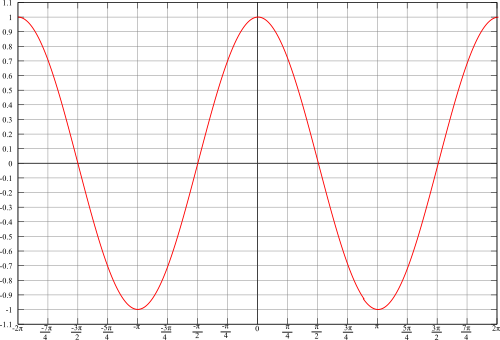
The graph of the cosine function looks like this:
As with the sine function, analysis of the cosine function will show that the graph corresponds to the unit circle. One of the most important differences between the sine and cosine functions is that sine is an odd function (i.e. while cosine is an even function (i.e. .
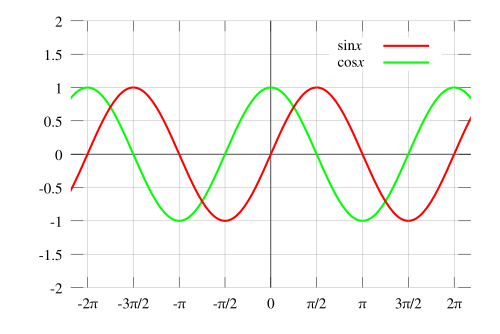
Sine and cosine are periodic functions; that is, the above is repeated for preceding and following intervals with length .
Exercises[edit | edit source]
|
When does Sine = Cosine? For what value of does ? (Choose a value between 0° and 90° or equivalently in radians between 0 and ).
|


