Using SPSS and PASW/Recoding Variables
This page shows how to facilitate statistical analysis by creating new SPSS variables via recoding, i.e., remapping values from existing variables.
Let's say you want to combine or “collapse” categories because the number of responses in one category is too small for statistical analysis.
Instead of having ages range from 1-100 and having 100 options as it does when on a ratio scale of measure, you could recode age into ordinal variable ageCategory that has just three values: 29 and under, 30-60, and 61+.
When recoding variables, it is generally a good idea to first write the desired mappings between the values of the old and new variables, as illustrated in the table below.
Here, a variable measuring frequency of religious attendance is used to demonstrate the technique:
| Old Codes | New Codes |
|---|---|
| 0=never | 1=never to infrequently |
| 1=less than once a year | 1=never to infrequently |
| 2=about once or twice a year | 1=never to infrequently |
| 3= several times a year | 1=never to infrequently |
| 4=about once a month | 2=relatively frequently |
| 5=two to three times a month | 2=relatively frequently |
| 6=nearly every week | 2=relatively frequently |
| 7=every week | 2=relatively frequently |
| 8= several times a week | 2=relatively frequently |
| 9=no answer | 9=no answer |
It is time to actually perform our recode. Drop the “Transform” menu at the top of data editor window:

Click on “Recode into Different Variables”, as choosing the “Recode into Same Variable” would destroy the values of the existing variable. (The only time you'd use that is when fixing fouled labels.)

You will now see the “Recode into Different Variables” window. Choose the source variable from the list on the left and click the arrow (which then points left) to insert the variable into the “Numeric Variable → Output Variable” box. In this example, variable "attend" is selected for recoding:

Now type the new variable name and label in the “Output Variable” box and click Change.

Now click “Old and New Values.” You'll get the following window:

For each row of our table at top, enter Old Values on the left, New Values on the right and click “Add”. That will put them into the “Old → New” list. As you can see, our screenshot shows original values 0 through 3 have been recoded as “1.” Values 4 through 8 have been recoded as “2” in the new variable. These recodings could have also been specified as ranges, by selecting the radio button next to “Range” and entering a range of source values.
When you are finished, click “Continue” and “OK.”
That will return you to the Data Editor window. In the Data View, drag the new variable from the very last column down and left until it is next to the column it recodes.
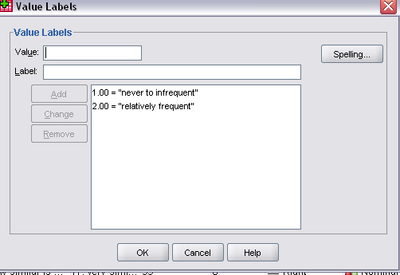
You might expect this to be done for you but the final step is to click the Variable View tab, and in the new variable's Values cell, edit the Value Labels to reflect the newly recoded values:

Click “OK” and you’re done.
Chapter contributed by Megan Hauf.
