Travel Time Reliability Reference Manual/Availability of Data
Here are some graphs and data for an 6-lane urban freeway (I-43/I-894 near Milwaukee) and 4-lane interregional (I-94 west of Eau Claire). I realize the corridor lengths are much different, but the options were limited for non-urban interstates which had more than just a couple TMC points and the urban corridors tend to be shorter. In this case, we actually have more data for I-94. The reliability indices follow what we’d expect with the more rural freeway performing better. I had to use the 70th percentile travel time for the free flow travel time on the urban freeway because using the speed limit would have led to a mean speed less than the free flow. Let me know your thoughts.
6-lane urban freeway (4.34875 miles) Free flow travel time is based on the 70th percentile travel time
| Reliability Index | Value |
|---|---|
| TTI | 1.007 |
| BI | 0.257 |
| OPT | 94.900 |
| PTI | 1.266 |
| TTI80 | 1.021 |
| MI | 1.4 |
| Travel Time in minutes | |
|---|---|
| Mean | 4.583 |
| Free Flow | 4.550 |
| 95th % | 5.762 |
| 80th % | 4.648 |
| 97.5th % | 6.466 |
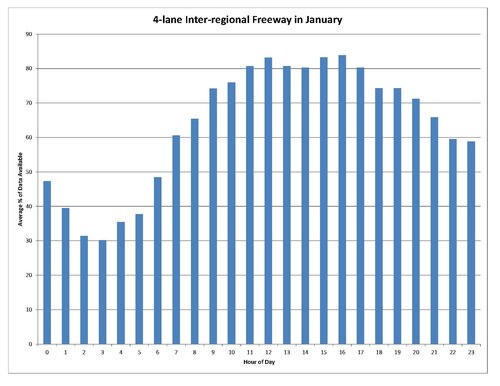
4-lane interregional freeway (20.178 miles) Free flow travel time is based on speed limit of 65mph
| Reliability Index | Value |
|---|---|
| TTI | 1.034 |
| BI | 0.058 |
| OPT | 98.400 |
| PTI | 1.094 |
| TTI80 | 1.038 |
| MI | 1.150 |
| Travel Time in minutes | |
|---|---|
| Mean | 19.261 |
| Free Flow | 18.626 |
| 95th % | 20.378 |
| 80th % | 19.327 |
| 97.5th % | 21.421 |