Transportation Deployment Casebook/2018/Australian Car Registrations
Australian Car Registrations
[edit | edit source]Mode Description
[edit | edit source]The main technology of automobiles is that most cars are powered by burning gasoline, and a small part of them are powered by electricity. All of them can be used to carry goods or people. This is the most important part of auto mobiles, engine . Without the invention of an engine, it cannot be made to move. Other important parts include chassis, body frame, tires, transmissions, etc.
Main Advantages
[edit | edit source]The advantages of cars are obvious. First, it is a point-to-point traffic mode that allows users to reach their destination without walking or switching to other public transport. At the same time, because of the popularity of automobiles, most of the areas inhabited by humans are equipped with parking lots and parking lots’ staff. It is not necessary to pay attention to if there will be a damage to the car when parking and it is very convenient to use parking systems. Second, the speed of the car is relatively fast. The speed on the expressway can reach 120km/h, and the average speed in the city is around 60km/h. It is the fastest mode of transportation except for the aircraft and the railway system. This high-speed and point-to-point transportation makes the car ideal for short or mid-range travel, and it can carry a different number of people or things depending on the size of the car.
Main Markets
[edit | edit source]The automotive market is for all people, especially those who travel a bit long daily and are not suitable for walking or cycling. No matter where people live, they need to complete their living needs through transportation. As long as it is not a long journey, the car is a very suitable choice for transportation. Even if people choose other modes of travel, it does not mean that the car is not an perfect alternative. Today, most of the car owners are working people in cities, people live in suburban homes, and companies and organizations in the car service industry.
Before Cars
[edit | edit source]In 1886, Carl Benz obtained the world's first patent for a car engine. In July, the world’s first four-wheeled car was officially sold. Before 1886, other modes of transportation included walking, cycling, horses, boats, steam trains, steamboats, etc. It can be roughly divided into two types: human or animal as motive power, and steam driven by combustion as the driving force. The limitations of these modes of transportation are very obvious. Manpower and animal pulls are slow to move and they can carry less cargo. Steam boosters cannot do the point to point transportation. For example, steam boats need rivers or oceans. Steam trains need to be prepared beforehand and can only operate on railways. The goods still need human and animal assistance on other road sections. Of course, the invention of the steam engine made people see the possibility of technological development and promoted the emergence of automobiles. The emergence of steam engines has increased the length and quantity of goods and travel, and improved the development of social communication. Therefore, the invention of the car also benefits from the convenience brought by the steam engine.
Invention of cars
[edit | edit source]The interior of the car contains a very large number of parts. Before the invention of the car, it was necessary to invent the various parts and the procedures and machines needed to produce the parts. The invention of the engine, spark ignition, water cooling cycle, steel frame, transmission, brake handle, etc., is an essential condition for automobiles. Without these inventions, the stability and safety of the car will not be guaranteed. The original car design was a steam-driven three-wheeled car that was burned with gas in 1769, which is very different from today's gasoline-burning cars. The world’s first recognized modern car was a tricycle invented by Karl Benz and used a two-stroke, single-cylinder, 0.9-hp petrol engine. The change between the two is also huge. The original one is driven by steam instead of ignition and combustion. [1] [2] [3]
Early Market Development
[edit | edit source]The earliest market development of automobiles should begin more than ten years after the invention of automobiles. Although the car was sold in the same year as it was invented, the market was not ready and the purchasing channels had not yet developed. At the same time, there are no factories that produce cars in large quantities. Only when time passes, and preparations were completed. Knowing that in 1914, Ford applied the production flow line technology to the car, and it began to sell in real terms. The market expanded from the rich class to the masses and created a huge automobile industry. At the same time as technological progress, the appearance and function of automobiles have also undergone tremendous changes. The functions have gradually catered to the needs and enjoyment of human beings, and the appearances are in line with the principles of high-speed advancement and the aesthetics of buyers. In the history of automobile development, different auto companies will also have market competition. Innovation and transformation can make products more popular and can also be sold at higher prices. Basically, these two projects have assumed the role of promoting market development and maintaining market competitiveness. [4]
Role of policy in the birthing phase
[edit | edit source]In the initial period of automobile development, there was no policy on automobiles. Therefore, it was certainly followed by all existing traffic policies. Of course, they were very unsuitable for automobiles. What remains is basically road morality, such as avoiding pedestrians. It is conceivable that the fastest land transportation in the past was horseback riding. The speed limit policy for all cars was set at an early stage instead of using the old policy. Similarly, policies that did not exist before include energy, licenses, road conditions, traffic guidance, driver's licenses, and indicators. Many policies have become part of the law, affecting the operation and development of the automotive industry. The rules for automobiles vary from country to country. The policy issues formulated by these governments all have in common, that is, for the consideration of road safety. If there is no common rule, then with the increase in the number of cars will lead an immeasurable danger. [5]
Growth of the mode
[edit | edit source]The mid-term development of the car has benefited from streamlined production, so that the production volume of automobiles can be broken out and the market scope can be extended to all people. Most of the market development is done by private companies. Of course, the government has played a very big role in the development stage. Making roads is one of the essential conditions for car travel. Without good road conditions, the use of cars will be greatly reduced. As a kind of infrastructure, pavements and roads are controlled by the government in most countries. Therefore, the early and mid-term development of the automotive industry was developed with the joint efforts of the public and private sectors. Policy issues such as environmental pollution, construction-related changes in life, and the popularity of traffic rules and traffic lights are problems that will be encountered at that time. The policy environment will also have a long-term impact on policy decisions. For example, in the First World War, all government decisions will be put into the preparations for the war, and the policy control of transportation will be reduced.
Development during the mature phase of the mode
[edit | edit source]Today, many developed countries have entered the mature stage of automobile development, and the annual sales of automobiles have gradually declined. Auto dealers will continue to adjust their performance and prices in order to sell more cars, and they will compete with each other and put their limited share into their own pockets. Since it has reached a mature stage and sales are falling, companies will consider expanding the market and keeping their interests unchanged. At the same time, policy issues limit performance development. The speed of the car has been greatly increased, but the speed limit of civilian cars is still maintained at a relatively low speed, completely different from the speed of the racing car. This is a policy for security considerations, and in the future, such a speed limit policy will not change. If reinvent the car becomes possible, then the most important thing is not the time of invention, but the structure of the car. The biggest problem that cars face today is traffic congestion. If the capacity of a car can be changed, for example, only a two-seater car, it will greatly increase the car capacity of the road, reduce traffic congestion and travel time.
Model
[edit | edit source]The logistic function used is S(t) = K/[1+exp(-b(t-t0)] where: S(t) is the status measure, (e.g. Passenger-km traveled) t is time (usually in years), t0 is the inflection time (year in which 1/2 K is achieved), K is saturation status level, b is a coefficient. [6]
There are three stages in S-curve, birthing, growth, and maturity. The last part of the S curve is symmetry to the first part, which means if the market has not reached the maturity stage, the data can be predicted by using the function and regression data analysis.
Data
[edit | edit source]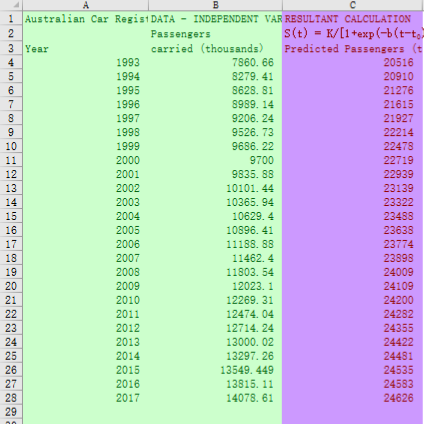
Australian Car Registrations DATA - INDEPENDENT VARIABLE RESULTANT CALCULATION Passengers S(t) = K/[1+exp(-b(t-t0)] Year carried (thousands) Predicted Passengers (thousands) 1993 7860.66 20516 1994 8279.41 20910 1995 8628.81 21276 1996 8989.14 21615 1997 9206.24 21927 1998 9526.73 22214 1999 9686.22 22478 2000 9700 22719 2001 9835.88 22939 2002 10101.44 23139 2003 10365.94 23322 2004 10629.4 23488 2005 10896.41 23638 2006 11188.88 23774 2007 11462.4 23898 2008 11803.54 24009 2009 12023.1 24109 2010 12269.31 24200 2011 12474.04 24282 2012 12714.24 24355 2013 13000.02 24422 2014 13297.26 24481 2015 13549.449 24535 2016 13815.11 24583 2017 14078.61 24626
This is the row data collected from the internet. The format of data is incorrect and needs to be seen in edit view. [7] Although this is a historical data, the accuracy of the data is not guaranteed and can only be used as reference. Human mistakes at early ages and the reliability of the website need further correction.
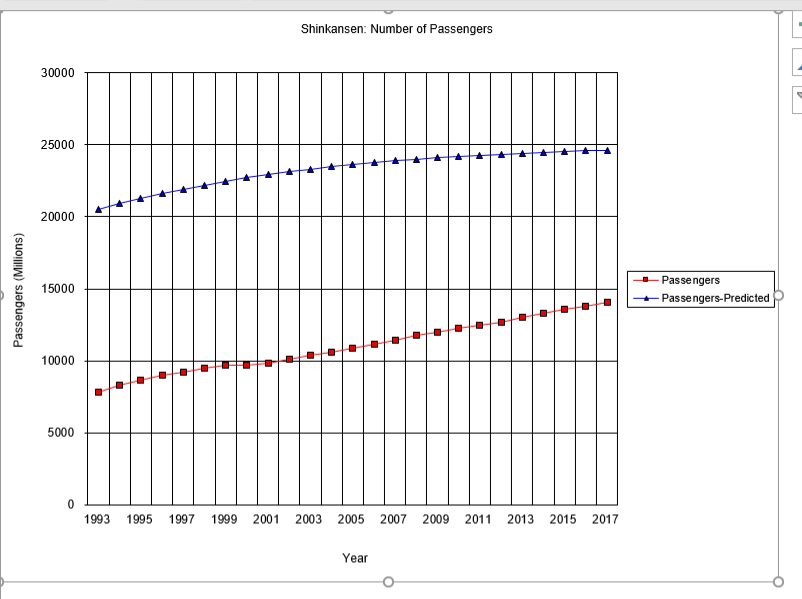
S-Curve
[edit | edit source]https://i.snag.gy/Xedgq3.jpg s-curve graph 1
https://i.snag.gy/vB9S70.jpg s-curve graph 2
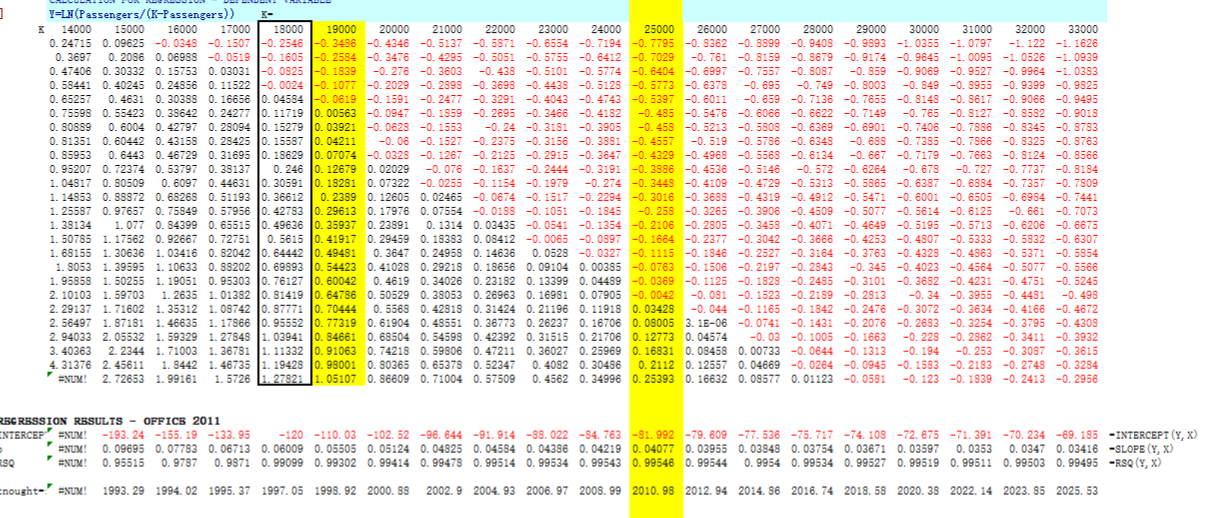
The curve is not as the shape of S. Obviously, part of the data is missing, which cause a imperfect partial curve. According to the table underneath, the K value has already reached the highest point where RSQ value is closest to one. Therefore, the market is shrinking, and it sits at the end of the mature stage.
https://i.snag.gy/sTH8Qv.jpg
table of calculations
- ↑ https://www.history.com/topics/automobiles
- ↑ https://web.archive.org/web/20111120211458/http://www.electricvehiclesnews.com/History/historyearlyII.htm
- ↑ The Transportation Experience, 2nd Edition, Garrison and Levinson
- ↑ http://amhistory.si.edu/onthemove/collection/object_1273.html
- ↑ http://www.austehc.unimelb.edu.au/tia/478.html
- ↑ https://canvas.sydney.edu.au/courses/2517/assignments/16745
- ↑ https://tradingeconomics.com/australia/car-registrations