File:AliasingSines.svg
Jump to navigation
Jump to search

Size of this PNG preview of this SVG file: 675 × 225 pixels. Other resolutions: 320 × 107 pixels | 640 × 213 pixels | 1,024 × 341 pixels | 1,280 × 427 pixels | 2,560 × 853 pixels.
Original file (SVG file, nominally 675 × 225 pixels, file size: 2 KB)
|
|
This is a file from the Wikimedia Commons |
Summary
| Description |
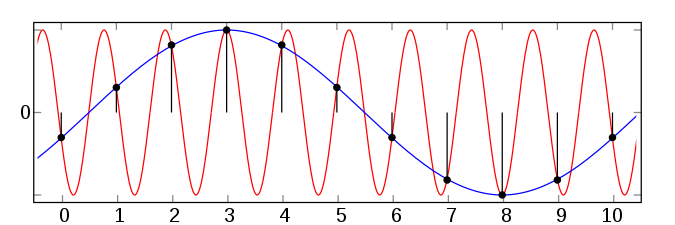
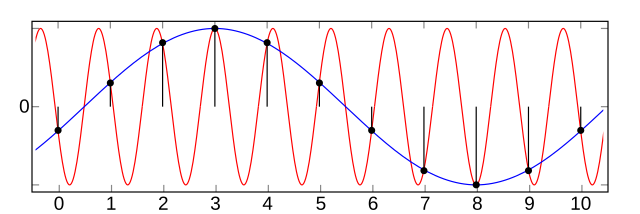
English: A graph showing aliasing of an f=0.9 sine wave by an f=0.1 sine wave by sampling at a period of T=1.0, based on the raster image File:AliasingSines.png.
Français : Une graphique qui démontre le crénelage d'un signal sinusoïdal de fréquence f=0.9, confondu avec un signal de fréquence f=0.1 lors d'un échantillonnage de période T=1.0, basée sur l'image matricielle File:AliasingSines.png. |
| Date | |
| Source | Own work |
| Author | Moxfyre |
| Other versions | File:AliasingSines.png |
| SVG development | This plot was created with Matplotlib. |
| Source code | Python code#!/usr/bin/python2.5
from pylab import *
from numpy import *
# create a figure
figure(figsize=(7.5,2.5))
rcParams.update({"figure.subplot.left":0.05, "figure.subplot.right":0.95,
"figure.subplot.bottom":0.1, "figure.subplot.top":0.9,
"svg.embed_char_paths":False})
# x coords from -1 to 11
x_fine = linspace(-0.4, 10.4, 1000)
x_coarse = linspace(0, 10, 11)
# sinewave w/ freq=0.9
y1 = sin(2*pi * 0.9 * (x_fine-0.5))
plot( x_fine, y1, "-", color="red")
# sinewave w/ freq=0.1
y2 = sin(2*pi * 0.1 * (x_fine-0.5))
plot(x_fine, y2, "-", color="blue")
# show aliasing
y3 = sin(2*pi * 0.1 * (x_coarse-0.5))
plot( x_coarse, y3, "o", color="black" )
vlines( x_coarse, 0, y3, color="black" ) # add the "lollipop" points
# set window and tick labels
axis([-0.5, 10.5, -1.1, 1.1])
yticks((-1.0,0,1.0), ('',0,''))
xticks(linspace(0,10,11))
# save it
savefig("AliasingSines.svg", transparent=True)
|
Licensing

|
Permission is granted to copy, distribute and/or modify this document under the terms of the GNU Free Documentation License, Version 1.2 or any later version published by the Free Software Foundation; with no Invariant Sections, no Front-Cover Texts, and no Back-Cover Texts. A copy of the license is included in the section entitled GNU Free Documentation License. Subject to disclaimers. |
This file is licensed under the Creative Commons Attribution-Share Alike 3.0 Unported license.
- You are free:
- to share – to copy, distribute and transmit the work
- to remix – to adapt the work
- Under the following conditions:
- attribution – You must give appropriate credit, provide a link to the license, and indicate if changes were made. You may do so in any reasonable manner, but not in any way that suggests the licensor endorses you or your use.
- share alike – If you remix, transform, or build upon the material, you must distribute your contributions under the same or compatible license as the original.
File history
Click on a date/time to view the file as it appeared at that time.
| Date/Time | Thumbnail | Dimensions | User | Comment | |
|---|---|---|---|---|---|
| current | 16:31, 10 June 2019 | 675 × 225 (2 KB) | Jarvisa | Simplified SVG source | |
| 17:51, 21 April 2009 | 675 × 225 (72 KB) | Moxfyre | a better interpretation of the original PNG version as used in the w:en:Aliasing article | ||
| 17:42, 21 April 2009 | 675 × 225 (46 KB) | Moxfyre | added "lollipop" points as in the .png version | ||
| 17:29, 21 April 2009 | 675 × 225 (41 KB) | Moxfyre | {{Information |Description={{en|1=A graph showing aliasing of an ''f=0.9'' w:sine wave by an ''f=0.1'' sine wave by sampling at a rate of 1.0, based on the raster image w:en:File:AliasingSines.png.}} |Source=Own work by uploader |Author=[[User |
File usage
The following 3 pages use this file:
Global file usage
The following other wikis use this file:
- Usage on az.wikipedia.org
- Usage on en.wikipedia.org
- Usage on en.wikiversity.org
- Usage on fi.wikipedia.org
- Usage on fr.wikipedia.org
- Usage on hi.wikipedia.org
- Usage on ms.wikipedia.org
- Usage on nl.wikipedia.org
- Usage on no.wikipedia.org
- Usage on pl.wikipedia.org
- Usage on ro.wikipedia.org
- Usage on ru.wikipedia.org
- Usage on sr.wikipedia.org
- Usage on sv.wikipedia.org
- Usage on uk.wikipedia.org
- Usage on www.wikidata.org