Fractals/Computer graphic techniques/2D: Difference between revisions
| [checked revision] | [checked revision] |
m →Programming: small edits - plural |
→Programming: new link |
||
| Line 260: | Line 260: | ||
Other implementations : |
Other implementations : |
||
* [http://www.imagemagick.org/discourse-server/viewtopic.php?f=1&t=14434&start=0 ImagMagic discussion : using a sobel operator - edge detection ] |
|||
* [http://git.gnome.org/browse/gimp/tree/plug-ins/common/edge-sobel.c Sobel in c from GIMP code] |
* [http://git.gnome.org/browse/gimp/tree/plug-ins/common/edge-sobel.c Sobel in c from GIMP code] |
||
*[http://www.jasonokane.com/tu/351cos/sobel/ Cpp code by Aaron Brooks - Brent Bolton - Jason O'Kane ] |
*[http://www.jasonokane.com/tu/351cos/sobel/ Cpp code by Aaron Brooks - Brent Bolton - Jason O'Kane ] |
||
Revision as of 19:30, 2 February 2012
Intro
All tasks can be done using :
- own programs ( GUI or console )
- own programs and graphic libraries
- graphic programs like GIMP
- fractal programs like :
- fractint
- xaos
- mandel by Wolf Jung
One can use free graphic libraries :
Creating graphic
Here are 3 targets / tasks :
- graphic file ( saving/ loading image )
- memory array ( processing image )
- screen pixels ( displaying image )
Graphic file
Memory array
Image in memory is a matrix :
- A color image is an MxNx3 matrix.
- Gray-level and black-and-white images are of size MxN.
The color depth of the image :
- 8-bit for gray
- 24 or 32-bit for color,
- 1-bit for black and white.
Screen pixels
glxinfo | grep OpenGL
glxinfo | grep "direct rendering"
DRI
Direct Rendering Infrastructure (DRI2)[9]
Color


Curve
Tracing
Tracing curve [10]
Curve rasterisation
Ray
Ray can be parametrised with radius ( r)
Closed curve
Closed curve () can be parametrized with angle ( t).
Edge detection
- Boundary scanning method for Julia set - BSM/J
- Boundary scanning method for Mandelbrot set - BSM/M
- edge detection in Matlab [11]
-
 Level curves - edge detection ( 2 filters )
 -
 Edge detection of boundaries of level sets of escape time


Sobel filter
Short introduction
Sobel filter G consist of 2 filters :
- Gh for horizontal lines
- Gv for vertical lines .
Sobel kernels
Sobel kernel ( masks) contains weghts for each pixel from neighbourhood of tested pixel. These are 3x3 kernels.
There are 2 sobel kernels, one for horizontal and one for vertical lines.
Sobel kernel for horizontal lines is :

Sobel kernel for vertical lines :

Note that :
- sum of weights of kernels are zero


- One kernel is simply the other rotated by 90 degrees [12]
- 3 weights in each kernal are zero
Pixel kernel
Pixel kernel A containing central pixel with its 3x3 neghbourhood :


Other notations for pixel kernel :

where : [13]
unsigned char ul, // upper left
unsigned char um, // upper middle
unsigned char ur, // upper right
unsigned char ml, // middle left
unsigned char mm, // middle = central pixel
unsigned char mr, // middle right
unsigned char ll, // lower left
unsigned char lm, // lower middle
unsigned char lr, // lower right

In array notation it is :[14]
![{\displaystyle \mathbf {A} ={\begin{bmatrix}A[x-1][y+1]&A[x][y+1]&A[x+1][y+1]\\A[x-1][y]&A[x][y]&A[x+1][y]\\A[x-1][y-1]&A[x][y-1]&A[x+1][y-1]\end{bmatrix}}}](https://wikimedia.org/api/rest_v1/media/math/render/svg/1b10cfb87990ef275b887f82efb22423621c36cb)
In geographic notation usede in cellular aotomats it is central pixel of Moore neighbourhood.
So central ( tested ) pixel is :
![{\displaystyle A_{5}=mm=A[x][y]\,}](https://wikimedia.org/api/rest_v1/media/math/render/svg/c9e18d6df1782c368da31d2d7d5e8297aad438cc)
Sobel filters
Compute sobel filters ( where here denotes the 2-dimensional convolution operation not matrix multiplication ). It is a sum of products of pixel and its weghts :


Because 3 weights in each kernal are zero so there are only 6 products. [15]
short Gh = ur + 2*mr + lr - ul - 2*ml - ll;
short Gv = ul + 2*um + ur - ll - 2*lm - lr;
Result
Result is computed (magnitude of gradient):

It is a color of tested pixel .
One can also approximate result by sum of 2 magnitudes :

which is much faster to compute.[16]
Algorithm
- choose pixel and its 3x3 neighberhood A
- compute sobel filter for horizontal Gh and vertical lines Gv
- compute sobel filter G
- compute color of pixel
Programming


Lets take array of 8-bit colors ( image) called data. To find borders in this image simply do :
for(iY=1;iY<iYmax-1;++iY){
    for(iX=1;iX<iXmax-1;++iX){
     Gv= - data[iY-1][iX-1] - 2*data[iY-1][iX] - data[iY-1][iX+1] + data[iY+1][iX-1] + 2*data[iY+1][iX] + data[iY+1][iX+1];
     Gh= - data[iY+1][iX-1] + data[iY-1][iX+1] - 2*data[iY][iX-1] + 2*data[iY][iX+1] - data[iY-1][iX-1] + data[iY+1][iX+1];
     G = sqrt(Gh*Gh + Gv*Gv);
     if (G==0) {edge[iY][iX]=255;} /* background */
         else {edge[iY][iX]=0;}  /* boundary */
    }
  }
Note that here points on borders of array ( iY= 0 , iY = iYmax , iX=0, iX=iXmax) are skipped
Result is saved to another array called edge ( with the same size).
One can save edge array to file showing only borders, or merge 2 arrays :
for(iY=1;iY<iYmax-1;++iY){
    for(iX=1;iX<iXmax-1;++iX){ if (edge[iY][iX]==0) data[iY][iX]=0;}}
to have new image with marked borders.
Above example is for 8-bit or indexed color. For higher bit colors "the formula is applied to all three color channels separately" ( from RoboRealm doc).
Other implementations :
- ImagMagic discussion : using a sobel operator - edge detection
- Sobel in c from GIMP code
- Cpp code by Aaron Brooks - Brent Bolton - Jason O'Kane
- rosettacode : Image convolution
- C and opencl by royger
- C++ by Glenn Fiedler
- Convolution and Deconvolution
Filling contour

Quality of image
Interval arithemthic
Antialiasing

- TechInfo -AntiAliasing by Michael Condron
- Fract ( Lisp code) by Yannick Gingras
- Spatial anti aliasing at wikipedia [22]
- fractalforums discussion : Antialiasing fractals - how best to do it? [23]
Supersampling


Other names :
- antigrain geometry
- Supersampling ( downsampling) [24]
- subpixel accuracy
Examples :
- command line version of Aptus ( python and c code ) by Ned Batchelder [25] ( see aptuscmd.py ) is using a high-quality downsampling filter thru PIL function resize [26]
- Java code by Josef Jelinek [27]: supersampling with grid algorithm, computes 4 new points (corners), resulting color is an avarage of each color component :
//Created by Josef Jelinek
// http://java.rubikscube.info/
Color c0 = color(dx, dy); // color of central point
// computation of 4 new points for antialiasing
if (antialias) { // computes 4 new points (corners)
  Color c1 = color(dx - 0.25 * r, dy - 0.25 * r);
  Color c2 = color(dx + 0.25 * r, dy - 0.25 * r);
  Color c3 = color(dx + 0.25 * r, dy + 0.25 * r);
  Color c4 = color(dx - 0.25 * r, dy + 0.25 * r);
 // resulting color; each component of color is an avarage of 5 values ( central point and 4 corners )
  int red = (c0.getRed() + c1.getRed() + c2.getRed() + c3.getRed() + c4.getRed()) / 5;
  int green = (c0.getGreen() + c1.getGreen() + c2.getGreen() + c3.getGreen() + c4.getGreen()) / 5;
  int blue = (c0.getBlue() + c1.getBlue() + c2.getBlue() + c3.getBlue() + c4.getBlue()) / 5;
  color = new Color(red, green, blue);
}
- one can make big image ( like 10 000 x 10 000 ) and convert/resize it ( downsize ). For example using ImageMagic :
convert big.ppm -resize 2000x2000 m.png.
Plane
Description
2D plane can be described by :
- corners ( 4 points )
- center and width
- center and magnification ("If you use the center, you can change the zoom level and the plot zooms in/out smoothly on the same center point. " Duncan C)
Standard description in Fractint, Ultra Fractal, ChaosPro and Fractal Explorer are corners. For example initial plane for Mandelbrot set is
 Corners:                X                     Y
 Top-l          -2.5000000000000000    1.5000000000000000
 Bot-r           1.5000000000000000   -1.5000000000000000
 Ctr -0.5000000000000000   0.0000000000000000  Mag 6.66666667e-01
 X-Mag-Factor     1.0000   Rotation    0.000   Skew    0.000
Display window of parameter plane has :
- a horizontal width of 4 (real)
- a vertical width (height) of 3 (imag)
- an aspect ratio (proportion) 4/3 ( also in pixels 640/480 so ther is no distorsion)
- center z=-0.5
For julia set/ dynamic plane has :
Corners:                X                     Y
Top-l          -2.0000000000000000    1.5000000000000000
Bot-r           2.0000000000000000   -1.5000000000000000
Ctr  0.0000000000000000   0.0000000000000000  Mag 6.66666667e-01
X-Mag-Factor     1.0000   Rotation    0.000   Skew    0.000
Description from documentation of Fractint :
CORNERS=[xmin/xmax/ymin/ymax[/x3rd/y3rd]]
Example: corners=-0.739/-0.736/0.288/0.291
Begin with these coordinates as the range of x and y coordinates, rather than the default values of (for type=mandel) -2.0/2.0/-1.5/1.5. When you specify four values (the usual case), this defines a rectangle: x- coordinates are mapped to the screen, left to right, from xmin to xmax, y-coordinates are mapped to the screen, bottom to top, from ymin to ymax. Six parameters can be used to describe any rotated or stretched parallelogram: (xmin,ymax) are the coordinates used for the top-left corner of the screen, (xmax,ymin) for the bottom-right corner, and (x3rd,y3rd) for the bottom-left. Entering just "CORNERS=" tells Fractint to use this form (the default mode) rather than CENTER-MAG (see below) when saving parameters with the [B] command.
CENTER-MAG=[Xctr/Yctr/Mag[/Xmagfactor/Rotation/Skew]]
This is an alternative way to enter corners as a center point and a magnification that is popular with some fractal programs and publications. Entering just "CENTER-MAG=" tells Fractint to use this form rather than CORNERS (see above) when saving parameters with the [B] command. The [TAB] status display shows the "corners" in both forms. When you specify three values (the usual case), this defines a rectangle: (Xctr, Yctr) specifies the coordinates of the center of the image while Mag indicates the amount of magnification to use.
Six parameters can be used to describe any rotated or stretched parallelogram: Xmagfactor tells how many times bigger the x- magnification is than the y-magnification,
Rotation indicates how many degrees the image has been turned, and Skew tells how many degrees the image is leaning over. Positive angles will rotate and skew the image counter-clockwise.
Parameters can be saved to parmfile called fractint.par
Wolf Jung uses :
/*
   from mndlbrot.cpp  by Wolf Jung (C) 201
   These classes are part of Mandel 5.7, which is free software; you can
   redistribute and / or modify them under the terms of the GNU General
   Public License as published by the Free Software Foundation; either
   version 3, or (at your option) any later version. In short: there is
   no warranty of any kind; you must redistribute the source code as well
*/
void mndlbrot::startPlane(int sg, double &xmid, double &rewidth) const
{  if (sg > 0)
     { xmid = -0.5; rewidth = 1.6; } // parameter plane
     else { xmid = 0; rewidth = 2.0; } // dynamic plane
Orientation
Check orientation of the plane by marking first quadrant of Cartesian plane :
if (x>0 && y>0) Color=MaxColor-Color;
It should be in upper right position.
Zoom

- optimizing zoom animations by Claude Heiland-Allen
- Xaos - algorithm description
- A Simple Optimization of Fractal Animation by Wei-Yin Chen, You-Sheng Yang and Kun-Mao Liang
- Maximal zoom is correlated with precision ( single , double, Quadruple precision, multiple-precision (MP) )[28]
- zoom factor for video [29]
- zoom factor [30]
Scanning
See :
- Fractint Drawing Methods[31]
All the pixels
Here plane is scaned pixel by pixel in Lisp
; common lisp. Here float values can be used,  there is no mapping
(loop for y from -1.5 to 1.5 by 0.1 do
      (loop for x from -2.5 to 0.5 by 0.05 do
            (princ (code-char 42))) ; print char
      (format t "~%")) ; new line
and in C
/* c */
/* screen coordinate = coordinate of pixels */
int iX, iY,
iXmin=0, iXmax=1000,
iYmin=0, iYmax=1000,
iWidth=iXmax-iXmin+1,
iHeight=iYmax-iYmin+1;

/* world ( double) coordinate = parameter plane*/
const double ZxMin=-5;
const double ZxMax=5;
const double ZyMin=-5;
const double ZyMax=5;

/* */
double PixelWidth=(ZxMax-ZxMin)/iWidth;
double PixelHeight=(ZyMax-ZyMin)/iHeight;
double Zx, Zy,    /* Z=Zx+Zy*i   */
       Z0x, Z0y,  /* Z0 = Z0x + Z0y*i */

 for(iY=0;iY<iYmax;++iY)
      { Z0y=ZyMin + iY*PixelHeight; /* mapping from screen to world; reverse Y  axis */
        if (fabs(Z0y)<PixelHeight/2) Z0y=0.0; /* Zy = 0 is a special value  */
        for(iX=0;iX<iXmax;++iX)
         {    /* initial value of orbit Z0 */
           Z0x=ZxMin + iX*PixelWidth;
          }
      }
Optimization
"premature optimization is the root of all evil" - Donald Knuth in paper "Structured Programming With Go To Statements"
Parallel computing
In Mandelbrot and Julia sets each point/pixel is calculated independently, so it can be easly divided into an smaller tasks and carried out simultaneously.[32]
Vectorisation
.gif)
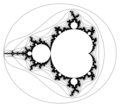
Here is R code of above image with comments : [35]
## based on the R code by Jarek Tuszynski
## http://commons.wikimedia.org/wiki/File:Mandelbrot_Creation_Animation_%28800x600%29.gif

iMax=20; # number of frames and iterations

## world coordinate ( float )
cxmin = -2.2;
cxmax = 1.0;
cymax = 1.2;
cymin = -1.2;

## screen coordinate ( integer)

dx=800; dy=600 ;           # define grid size

## sequences of  values = rows and columns
cxseq = seq(cxmin, cxmax, length.out=dx);
cyseq = seq(cymin, cymax, length.out=dy);
## sequences of  values = rows * columns
cxrseq = rep(cxseq, each = dy);
cyrseq = rep(cyseq,  dx);
C = complex( real=cxrseq, imag = cyrseq); # complex vector
C = matrix(C,dy,dx)       # convert from vector to matrix
# Now C is a matrix of c points coordinates (cx,cy)

# allocate memory for all the frames
F = array(0, dim = c(dy,dx,iMax)) # dy*dx*iMax array filled with zeros

Z = 0                     # initialize Z to zero
for (i in 1:iMax)         # perform iMax iterations
{
  Z = Z^2+C               # iteration; uses n point to compute n+1 point

  F[,,i]  = exp(-abs(Z))              # an omitted index is used to represent an entire column or row
     # store magnitude of the complex number, scale it using an exponential function to emphasize fine detail,
}


# color and save F array to the file
library(caTools)          # load library with write.gif function
# mapped to color palette jetColors . Dark red is a very low number, dark blue is a very high number
jetColors = colorRampPalette(c("#00007F", "blue", "#007FFF", "cyan", "#7FFF7F", "yellow", "#FF7F00", "red", "#7F0000"))
write.gif(F, "Mandelbrot.gif", col=jetColors, delay=100, transparent=0)
Classes of parallel computers
Wikipedia description[36]
- Multi-core (computing) : "I always create as many worker threads as I have cores. More than that and your system spends too much time task switching" - Duncan C[37]
- General-purpose computing on graphics processing units (GPGPU):
References
- ↑ ImageMagick image processing libraries
- ↑ GEGL (Generic Graphics Library)
- ↑ http://openil.sourceforge.net/
- ↑ http://freeimage.sourceforge.net/
- ↑ GD Graphics Library
- ↑ graphics magick
- ↑ OpenCv
- ↑ OpenImageIO
- ↑ w:Direct Rendering Infrastructure (DRI)
- ↑ Curve sketching in wikipedia
- ↑ matrixlab - line-detection
- ↑ Sobel Edge Detector by R. Fisher, S. Perkins, A. Walker and E. Wolfart.
- ↑ NVIDIA Forums , CUDA GPU Computing discussion by kr1_karin
- ↑ Sobel Edge by RoboRealm
- ↑ forum nvidia : Sobel Filter Don't understand a little thing in the SDK example
- ↑ Sobel Edge Detector by R. Fisher, S. Perkins, A. Walker and E. Wolfart.
- ↑ ON THE NUMERICAL CONSTRUCTION OF HYPERBOLIC STRUCTURES FOR COMPLEX DYNAMICAL SYSTEMS by Jennifer Suzanne Lynch Hruska
- ↑ "Images of Julia sets that you can trust" by Luiz Henrique de Figueiredo and Joao Batista Oliveira
- ↑ adaptive algorithms for generating guaranteed images of Julia sets by Luiz Henrique de Figueiredo
- ↑ Drawing Fractals With Interval Arithmetic - Part 1 by Dr Rupert Rawnsley
- ↑ Drawing Fractals With Interval Arithmetic - Part 2 by Dr Rupert Rawnsley
- ↑ Spatial anti aliasing at wikipedia
- ↑ fractalforums discussion : Antialiasing fractals - how best to do it?
- ↑ Supersampling at wikipedia
- ↑ Aptus ( python and c code ) by Ned Batchelder
- ↑ Pil function resize
- ↑ Java code by Josef Jelinek
- ↑ No_mention_of_Double-double - talk
- ↑ fractalforums : problem with zooming transform one view rect-to another
- ↑ fractalforums "basic-location-and-zoom-question
- ↑ Fractint Drawing Methods
- ↑ embarrassingly parallel problem
- ↑ Vectorization (parallel computing)
- ↑ Matlab - Code Vectorization Guide
- ↑ mandelbrot set in r by J.D. Long
- ↑ wikipedia : Parallel_computers - Classes_of_parallel_computers
- ↑ /programming/what-is-the-general-approach-to-threading-for-2d-plotting/ Fractal forums discussion : What is the general approach to threading for 2d plotting
- ↑ parallel mandelbrot set (C Code with Message Passing Interface (MPI) library) by Omar U. Florez
- ↑ Guide into OpenMP: Easy multithreading programming for C++ by Joel Yliluoma
- ↑ Parallel Mandelbrot with OpenMP by dcfrogle
- ↑ claudiusmaximus : exponential mapping and openmp
- ↑ A Mandelbrot Set on the GPU in Matlab by Loren Shure
- ↑ progressive-julia-fractal using webgl by Felix Woitzel
- ↑ glsl sandbox at heroku.com