Simulation with AnyLogic/Discrete Event Simulation/Ophthalmology Department Model/Step 2. Creating a model animation
Step 2. Creating a Model Animation
[edit | edit source]Now we will draw the model animation since the logical structure of the model is generated from the animation you draw. To simplify drawing, we will add the model layout first. You can draw the department layout using AnyLogic presentation shapes, or you can import any picture as the layout. The drawing approach is good for prototyping, when you want to experiment with draft layouts. The image approach is excellent for working with an existing layout.
- First, open the Presentation stencil of the Palette view. This stencil contains shapes and controls you can add on your presentation. To open some stencil of the Palette view, just click on the corresponding tab of the view.

- Drag the Image
 element from the Presentation palette into the graphical editor (right in the place shown in the figure below).
- Set up the image properties in the Properties view. Click Add Image button and navigate to layout picture. You can find the layout here: <AnyLogic folder>\plugins\com.xj.anylogic.examples.<build number>\models\Ophthalmology Department\layout.png

- To preserve necessary picture size, select the Original Size option.
- The image should look like this:

Now we will draw the model animation. Drawing an animation, we define the transportation network, where rectangles represent network nodes and polylines — network links.
We will draw a rectangle for each department room and connect rectangles with polylines playing the role of moving paths in our model.
- Draw rectangles representing department rooms. Ophthalmology department has the following functional areas: waiting room, three procedure rooms, storage room for ophthalmoscopes and private office space for medical staff.
- To draw a rectangle, drag the Rectangle
 element from the Presentation page of the Palette view into the graphical editor.
 - Resize rectangles by dragging to fit into the corresponding areas of the layout as shown in the figure below. To simplify drawing, switch binding to grid off by clicking the Enable/Disable Grid toolbar button.

- Name rectangles as shown in the figure. It is important since we will refer to nodes by their names in future.
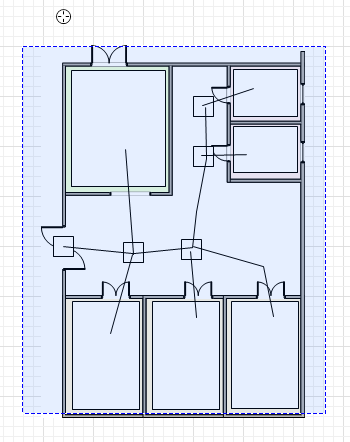
- To make moving in our model more sophisticated, we will also add some additional rectangles to represent intermediate moving destinations. Draw four additional rectangles standing for intermediate network nodes and place them as shown in the figure:

Now we will define network segments by drawing polylines. In network-based model polylines represent moving paths.
- Using the Polyline
 drawing tool, draw polylines as shown in the following figure:
- To draw a polyline, drag the Polyline
 element from the Presentation page of the Palette view into the graphical editor. Then double-click the drawn polyline to switch to editing points mode. In this mode you can add new points by double-clicking on the polyline and move points by dragging them.
 - Note that all end points of polylines should necessarily lie inside the connected rectangles.
The logical structure of the network will be constructed from the presentation shapes added to the group we will specify as the Group of the network shapes. So now we should create a group and add all just drawn shapes to it.
- Drag the Group
 element from the Presentation palette into the graphical editor.
 - Name the group networkGroup.

- Add all created shapes to the group. First, select shapes. The best way is to drag the mouse with the left button pressed over the area containing the shapes you want to select.

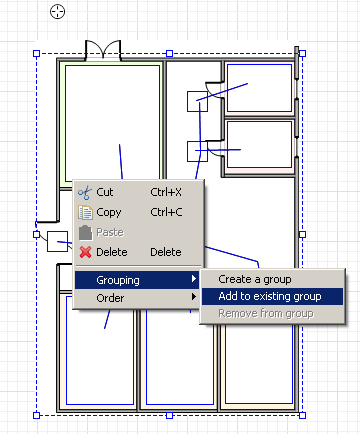
- The selected shapes will be highlighted in blue (see the figure below). If some shape has not been selected, you can press Ctrl and while holding it, click this shape with the left mouse button. The shape will be added to the selection.

- When finished selecting shapes, right-click the selection (you should click exactly on the outline of some selected shape), and then choose Grouping|Add to existing group from the popup menu.

- Finally, click on the networkGroup.
![]() Define procedure rooms location
Define procedure rooms location
- Draw a polyline connecting rectangles representing the procedure rooms. We will use it later on.
Place polyline points exactly inside the procRoom1, procRoom2 and procRoom3 rectangles.
- Name it roomsLocation and set custom line color.

- Make the polyline invisible. Go to the Dynamic page of the polyline's Properties and type false in the Visible field.


