High School Earth Science/Weather Forecasting
Weather forecasts are better than they ever have been. According to the World Meteorological Organization (WMO), a 5-day weather forecast today is as reliable as a 2-day forecast was 20 years ago! This is because forecasters now use advanced technologies to gather weather data, along with the world’s most powerful computers. Together, the data and computers produce complex models that more accurately represent the conditions of the atmosphere. These models can be programmed to predict how the atmosphere and the weather will change. Despite these advances, weather forecasts are still often incorrect. Weather is extremely difficult to predict, because it is a very complex and chaotic system.
Lesson Objectives
[edit | edit source]- List some of the instruments that meteorologists use to collect weather data.
- Describe how these instruments are used to collect weather data from many geographic locations and many altitudes.
- Discuss the role of satellites and computers in modern weather forecasting.
- Describe how meteorologists develop accurate weather forecasts.
Collecting Weather Data
[edit | edit source]
To make a weather forecast, the conditions of the atmosphere must be known for that location and for the surrounding area. Temperature, air pressure, and other characteristics of the atmosphere must be measured and the data collected. Thermometers measure temperature. One way to do this is to use a temperature-sensitive material, like mercury, placed in a long, very narrow tube with a bulb. When the temperature is warm, the mercury expands, causing it to rise up the tube. Cool temperatures cause the mercury to contract, bringing the level of the mercury lower in the tube. A scale on the outside of the thermometer matches up with the air temperature.
Because mercury is toxic, most meteorological thermometers no longer use mercury in a bulb. There are many ways to measure temperature. Some digital thermometers use a coiled strip composed of two kinds of metal, each of which conducts heat differently. As the temperature rises and falls, the coil unfolds or curls up tighter. Other modern thermometers measure infrared radiation or electrical resistance. Modern thermometers usually produce digital data that can be fed directly into a computer.
Meteorologists use barometers to measure air pressure (Figure 16.38). A barometer may contain water, air, or mercury. Like thermometers, barometers are now mostly digital. Air pressure measurements are corrected so that the numbers are given as though the barometer were at sea level. This means that only the air pressure is measured instead of also measuring the effect of altitude on air pressure.
A change in barometric pressure indicates that a change in weather is coming. If air pressure rises, a high pressure cell is on the way and clear skies can be expected. If pressure falls, a low pressure is coming and will likely bring storm clouds. Barometric pressure data over a larger area can be used to identify pressure systems, fronts and other weather systems.
Other instruments measure different characteristics of the atmosphere. Below is a list of a few of these instruments, along with what they measures:
- anemometers: wind speed
- hygrometers: humidity
- wind vane: wind direction
- rain gauge: the amount of liquid precipitation over a period of time
- snow gauge: the amount of solid precipitation over a period of time

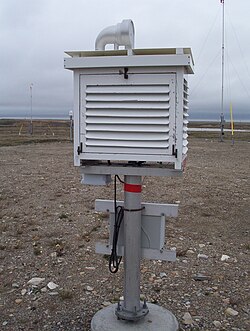
These instruments are placed in various locations so that they can check the atmospheric characteristics of that location. Weather stations are located on land, the surface of the sea, and in orbit all around the world (Figure 16.39). According to the WMO, weather information is collected from 15 satellites, 100 stationary buoys, 600 drifting buoys, 3,000 aircraft, 7,300 ships and some 10,000 land-based stations.
Instruments are also sent into the atmosphere in weather balloons filled with helium or hydrogen. As the balloon ascends into the upper atmosphere, the gas in the balloon expands until the balloon bursts. The specific altitude at which the balloon bursts depends on its diameter and thickness, but is ordinarily about 40 km (25 miles) in altitude. The length of the flight is ordinarily about 90 minutes. Weather balloons are intended to be used only once, and the equipment they carry is usually not recovered.

Weather balloons contain radiosondes that measure atmospheric characteristics, such as temperature, pressure and humidity (Figure 16.40). Radiosondes in flight can be tracked to obtain wind speed and direction. Radiosondes use a radio to communicate the data they collect to a computer.
Radiosondes are launched from around 800 sites around the globe twice daily (at 0000 and 1200 UTC; UTC is Coordinated Universal Time; it is the same as Greenwich Mean Time—the time in the city of Greenwich, England) at the same time to provide a profile through the atmosphere. Special launches are done when needed for special projects. Radiosondes can be dropped from a balloon or airplane to make measurements as they fall. This is done to monitor storms, for example, since they are dangerous places for airplanes to fly.
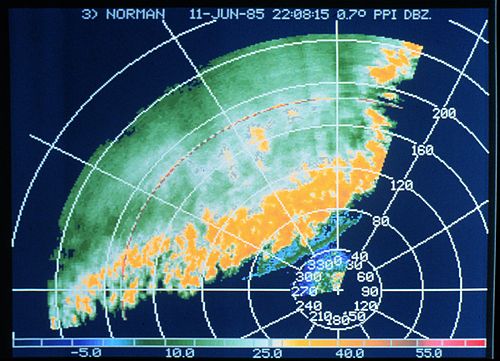
Weather information can also come from remote sensing, particularly radar and satellites (Figure 16.41). Radar stands for Radio Detection and Ranging. In radar, a transmitter sends out radio waves. The radio waves bounce off the nearest object and then return to a receiver. Weather radar can sense many characteristics of precipitation: its location, motion, intensity, and the likelihood of future precipitation. Most weather radar is Doppler radar, which can also track how fast the precipitation falls. Radar can outline the structure of a storm and in doing so estimate the possibility that it will produce severe weather.

Weather satellites have been increasingly important sources of weather data since the first one was launched in 1952. Weather satellites are the best way to monitor large scale systems, like storms. Satellites can also monitor the spread of ash from a volcanic eruption, smoke from fires, and pollution. They are able to record long-term changes, such as the amount of ice cover over the Arctic Ocean in September each year.
Weather satellites may observe all energy from all wavelengths in the electromagnetic spectrum. Most important are the visible light and infrared (heat) frequencies. Visible light images record images the way we would see them, including storms, clouds, fires, and smog. Infrared images measure heat. These images can record clouds, water and land temperatures, and features of the ocean, such as ocean currents. Weather patterns like the El Niño are monitored in infrared images of the equatorial Pacific Ocean.
Two types of weather satellites are geostationary and polar orbiting (Figure 16.42). Geostationary satellites orbit the Earth at the same rate that the Earth rotates; therefore, they remain fixed in a single location above the equator at an altitude of about 36,000 km (22,000 miles). This allows them to constantly monitor the hemisphere where they are located. A geostationary satellite positioned to monitor the United States will have a constant view of the mainland, plus the Pacific and Atlantic Oceans, as it looks for hurricanes and other potential hazards.

Polar orbiting satellites orbit much lower in the atmosphere, at about 850 km (530 miles) in altitude. They are not stationary but continuously orbit making loops around the poles, passing over the same point at around the same time twice each day. Since these satellites are lower, they get a more detailed view of the planet.
Forecasting Methods
[edit | edit source]There are many ways to create a forecast, some simple and some complex. Some use only current, local observations, while others deal with enormous amounts of data from many locations at different times. Some forecasting methods are discussed below.
Perhaps the easiest way to forecast weather is with the 'persistence' method. In this method, we assume that the weather tomorrow will be like the weather today. The persistence method works well if a region is under a stationary air mass or if the weather is consistent from day to day. For example, Southern California is nearly always warm and sunny on summer days, and so that is a fairly safe prediction to make. The persistence method can also be used for long-term forecasts in locations where a warm, dry month is likely to lead to another warm dry month, as in a Southern California summer.
The 'climatology' method assumes that the weather will be the same on a given date as it was on that date in past years. This is often not very accurate. It may be snowing in Yosemite one New Year's Day and sunny and relatively warm on the next. Using the 'trend' method, forecasters look at the weather upwind of their location. If a cold front is moving in their direction at a regular speed, they calculate when the cold front will arrive. Of course, the front could slow down, speed up, or shift directions, so that it arrives late, early, in a strengthened or weakened state, or never arrives at all. Forecasters use the 'analog' method when they identify a pattern. Just like an analogy compares two similar things, if last week a certain pattern of atmospheric circulation led to a certain type of weather, the forecaster assumes that the same pattern this week will lead to the same weather. There are lots of possible variations in patterns and changes often occur, so this method is also not entirely accurate.
Numerical Weather Prediction
[edit | edit source]The most accurate weather forecasts are made by advanced computers, with analysis and interpretation added by experienced meteorologists. These computers have up-to-date mathematical models that can use much more data and make many more calculations than would ever be possible by scientists working with just maps and calculators. Meteorologists can use these results to give much more accurate weather forecasts and climate predictions.
In Numerical Weather Prediction (NWP), atmospheric data from many sources are plugged into supercomputers running complex mathematical models. The models then calculate what will happen over time at various altitudes for a grid of evenly spaced locations. The grid points are usually between 10 and 200 kilometers apart. Using the results calculated by the model, the program projects that weather further into the future. It then uses these results to project the weather still further into the future and so on, as far as the meteorologists want to go. The final forecast is called a prognostic chart or prog.
Certain types of progs are better at particular types of forecasts and experienced meteorologists know which to use to predict different types of weather. In addition to the prog, scientists use the other forecasting methods mentioned above. With so much data available, meteorologists use a computerized system for processing, storage, display and telecommunications. Once a forecast is made, it is broadcast by satellites to more than 1,000 sites around the world.
NWP produces the most accurate weather forecasts, but as anyone knows, even the best forecasts are not always right. Some of the reasons for this are listed below:
- Not enough data was initially entered into the program. This is most likely to happen for a region near an ocean or a remote area.
- The computer program makes certain assumptions about how the atmosphere operates, which may not always be correct.
- The programs only deal with weather locally, which means errors are likely at the edges of the area studied. A global model would be more accurate, but producing one would require an incredible number of calculations.
- The weather system may be too small to show up on the grid. If a system is small, like a thunderstorm, it will not be modeled. If distances between grid points are reduced, many more calculations and therefore more powerful computers are needed.
- There is always the possibility that conditions change unpredictably. Weather is a chaotic system and small, unpredictable things always happen. The farther into the future a model tries to forecast, the more unpredictable things arise to change the forecast.
Weather Maps
[edit | edit source]Weather maps simply and graphically depict meteorological conditions in the atmosphere. Weather maps may display only one feature of the atmosphere or multiple features. They can depict information from computer models or from human observations. Weather maps are found in newspapers, on television, and on the Internet.
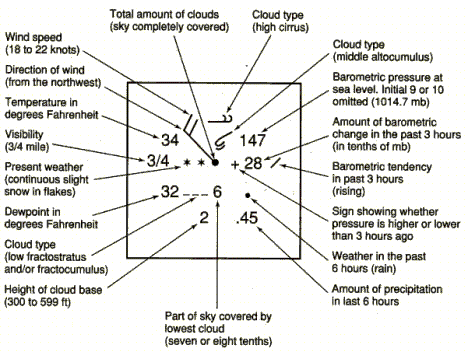
On a weather map, each weather station will have important meteorological conditions plotted. These conditions may include temperature, current weather, dew point, the amount of cloud cover, sea level air pressure, and the wind speed and direction. On a weather map, meteorologists use many different symbols. These symbols give them a quick and easy way to put information onto the map. Figure 16.43 shows some of these symbols and Figure 16.44 explains what they mean.

Once conditions have been plotted, points of equal value can be connected. This is like the contour line on a topographic map, in which all points at a certain elevation are joined.
Weather maps can have many types of connecting lines. For example:
- Lines of equal temperature are called isotherms. Isotherms show temperature gradients and can indicate the location of a front. The 0°C (32°F) isotherm will show where rain is likely to give way to snow.
- Isobars are lines of equal average air pressure at sea level. Closed isobars represent the locations of high and low pressure cells. High pressure cells are shown as Hs and low pressure cells as Ls. A thick, brown dashed line is often placed inside a long low pressure trough.
- Isotachs are lines of constant wind speed. Where the minimum values occur high in the atmosphere, tropical cyclones may develop. The highest wind speeds can be used to locate the jet stream.
Surface weather analysis maps are weather maps that only show conditions on the ground (Figure 16.45). These maps show sea level mean pressure, temperature and amount of cloud cover. This information will reveal features such as high and low pressure cells.

Weather maps can also depict conditions at higher altitudes. Aviation maps show conditions in the upper atmosphere, particularly those that are of interest to pilots. These include current weather, cloud cover, and regions where ice is likely to form.
Lesson Summary
[edit | edit source]- Weather forecasts are more accurate than ever before. Older instruments and data collection methods such as radiosondes and weather balloons are still used.
- These techniques have now been joined by satellites and computers to create much more detailed and accurate forecasts.
- Still, forecasts are often wrong, particularly those that predict the weather for several days.
- Meteorologists are working hard to improve weather forecasts one to two weeks in advance of potentially hazardous weather.
Review Questions
[edit | edit source]- What types of instruments would you expect to find at a weather station and what do these instruments measure?
- How does a thermometer work?
- How could a barometer at a single weather station be used to predict an approaching storm?
- Why are weather balloons important for weather prediction? What information do they give that isn't obtainable in other ways?
- How does radar work, and what is its value in weather prediction?
- What type of weather satellite is best to use for monitoring hurricanes that may cause problems in the United States and why?
- Imagine that your teacher asks you to predict what the weather will be like tomorrow. You can go outside, but can't use a TV or computer. What method will you use?
- Imagine that you need to predict tomorrow's weather and you are allowed to use a telephone, but no other electronics. Who will you call and what method will you use?
- Okay, now you need to predict tomorrow's weather and you have access to electronics, but not to weather forecasts. That is, you can look at information such as weather maps and radar images but you cannot look at the interpretations made by a meteorologist. Now what method are you using?
- No rain is in the forecast, but it's pouring outside. How could the NWP weather forecast have missed this weather event?
- What does it mean to say that weather is a chaotic system? How does this affect the ability to predict the weather?
Vocabulary
[edit | edit source]- barometer
- An instrument for measuring atmospheric pressure.
- isobars
- Lines connecting locations that have equal air pressure.
- isotachs
- Lines connecting locations that have equal wind speed.
- isotherms
- Lines connecting locations that have equal temperatures.
- prognostic chart (prog)
- A chart showing the state of the atmosphere at a given time in the future.
- radar
- Radio detection and ranging device that emits radio waves and receives them after they bounce on the nearest surface. This creates an image of storms and other nearby objects.
- radiosonde
- A group of instruments that measure the characteristics of the atmosphere—temperature, pressure, humidity, etc.—as they move through the air.
- weather map
- A map showing weather conditions over a wide area at a given time, it collects data from many locations.
- weather satellite
- A human made object that orbits the Earth and senses electromagnetic waves, mostly in the visible light and infrared spectra.
- thermometers gather the amount of heat in an area
Points to Consider
[edit | edit source]- With so much advanced technology available, what is the role of meteorologists in creating accurate weather forecasts?
- With so much advanced technology available, why are weather forecasts so often wrong?
- What advances do you think will be necessary for meteorologists to create accurate weather forecasts one to two weeks in advance of a major weather event?


