
File:CPT-Structured Chart Average.svg

Size of this PNG preview of this SVG file: 633 × 437 pixels. Other resolutions: 320 × 221 pixels | 640 × 442 pixels | 1,024 × 707 pixels | 1,280 × 884 pixels | 2,560 × 1,767 pixels.
Original file (SVG file, nominally 633 × 437 pixels, file size: 18 KB)
|
|
This is a file from the Wikimedia Commons |
Summary
| Description |
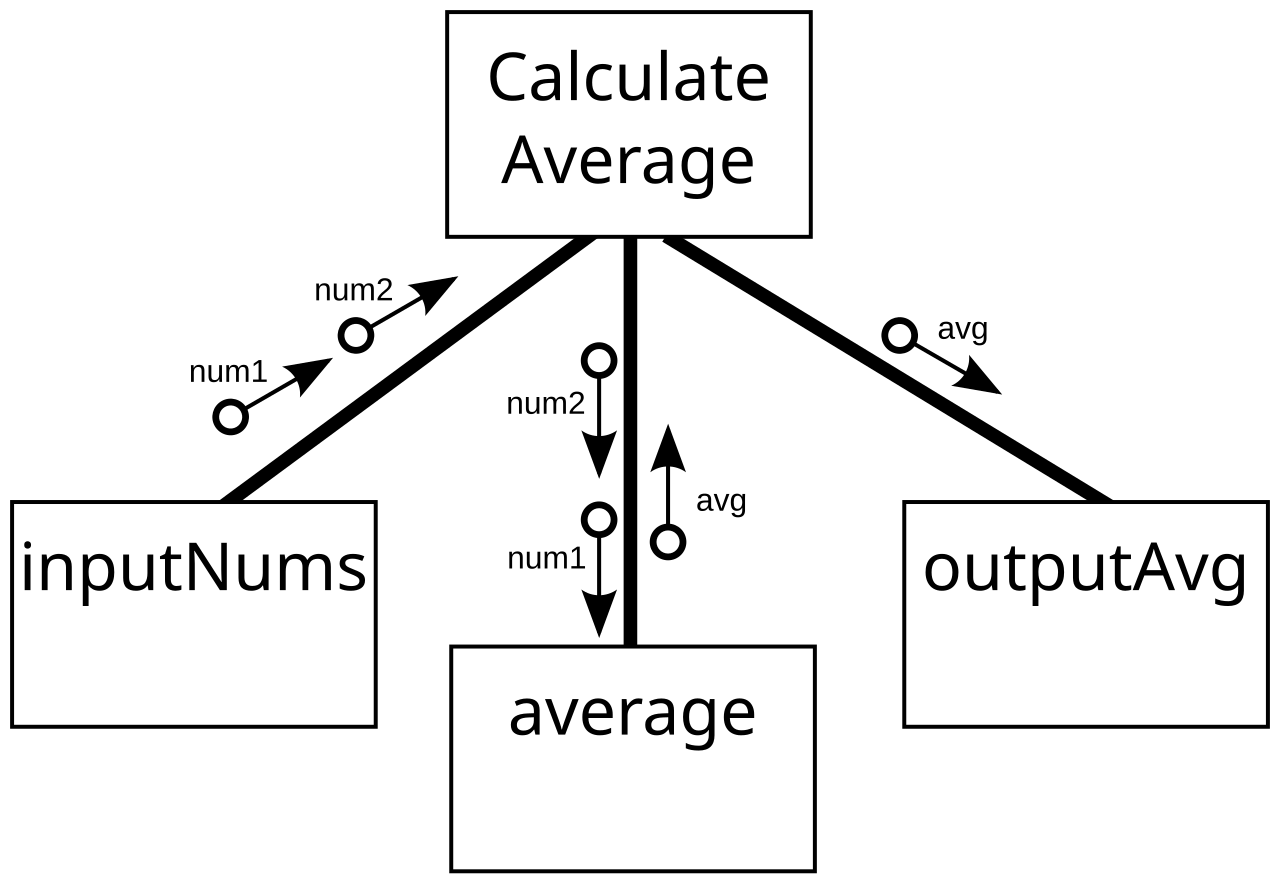
English: A structure chart showing the calculation of an average of two numbers |
| Date | |
| Source | Own work |
| Author | Pluke |
This W3C-unspecified vector image was created with Inkscape .
Licensing
I, the copyright holder of this work, hereby publish it under the following license:
| This file is made available under the Creative Commons CC0 1.0 Universal Public Domain Dedication. | |
| The person who associated a work with this deed has dedicated the work to the public domain by waiving all of their rights to the work worldwide under copyright law, including all related and neighboring rights, to the extent allowed by law. You can copy, modify, distribute and perform the work, even for commercial purposes, all without asking permission.
|
File history
Click on a date/time to view the file as it appeared at that time.
| Date/Time | Thumbnail | Dimensions | User | Comment | |
|---|---|---|---|---|---|
| current | 00:29, 16 April 2012 | | 633 × 437 (18 KB) | Pluke | phantom rectangle gone now? |
| 00:22, 16 April 2012 |  | 633 × 437 (19 KB) | Pluke | fixed phantom square | |
| 00:19, 16 April 2012 |  | 633 × 437 (19 KB) | Pluke | {{Information |Description ={{en|1=A structure chart showing the calculation of an average of two numbers}} |Source ={{own}} |Author =Pluke |Date =2012-04-16 |Permission = |other_versions = }} {{inkscape}... |
File usage
The following 4 pages use this file:
- A-level Computing/AQA/Print version/Unit 1
- A-level Computing/AQA/Problem Solving, Programming, Data Representation and Practical Exercise/Problem Solving/Structure charts
- A-level Computing 2009/AQA/Print version/Unit 1
- A-level Computing 2009/AQA/Problem Solving, Programming, Data Representation and Practical Exercise/Problem Solving/Structure charts