File:AYool GLODAP del pH.png
Jump to navigation
Jump to search

Size of this preview: 800 × 539 pixels. Other resolutions: 320 × 215 pixels | 640 × 431 pixels | 1,024 × 689 pixels | 1,280 × 862 pixels | 1,683 × 1,133 pixels.
Original file (1,683 × 1,133 pixels, file size: 232 KB, MIME type: image/png)
|
|
This is a file from the Wikimedia Commons |
Summary
| Description |
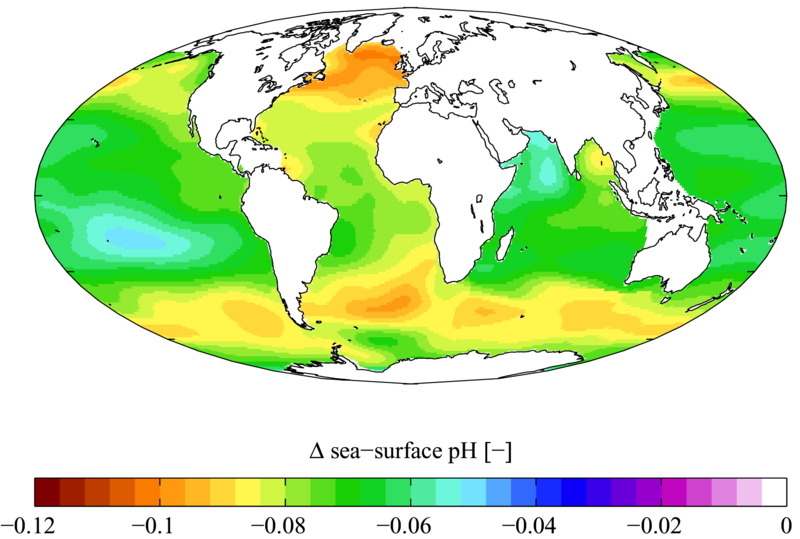
English: Estimated change in sea surface pH from the pre-industrial period (1700s) to the present day (1990s). Δ pH here is in standard pH units. This change is caused by the invasion of anthropogenic CO2 (see Ocean acidification). Calculated using Richard Zeebe's csys package with data from the Global Ocean Data Analysis Project[1][2] and World Ocean Atlas[3] climatologies. Δ pH is plotted here using a Mollweide projection (using MATLAB and the M_Map package).
Note that the GLODAP climatology is missing data in certain oceanic provinces including the Arctic Ocean, the Caribbean Sea, the Mediterranean Sea and the Malay Archipelago.
Română: Variaţia estimativă a pH-ului de la suprafaţa apei începând cu perioada pre-industrială (anii 1700) şi terminând cu anii 1990. Δ pH este indicată în unităţi standarte. Schimbarea valorii pH-ului a fost determinată preponderent de cantitatea mare de CO2 produsă de factorul antropogen. Valoriule au fost calculate utilizând pachetul csys al lui Richard Zeebe cu date de la Global Ocean Data Analysis Project[1][2] şi din World Ocean Atlas.[3] Imaginea a fost executată prin proiecţie Mollweide (fiind utilizate MATLAB şi pachetul M_Map).
Notă: climatologii de la GLODAP nu dispun de date privind unele zone ale oceanului planetar, şi anume din Oceanul Arctic, Marea Caraibilor, Marea Mediterană. |
| Date | |
| Source | English Wikipedia |
| Author | Plumbago |
| Other versions |
|

References
- ↑ a b Gruber, N., Sarmiento, J.L. and Stocker, T.F. (1996). An improved method for detecting anthropogenic CO2 in the oceans, Global Biogeochemical Cycles 10:809–837
- ↑ a b Using estimated pre-industrial (1700s) and measured present day (1990s) fields of DIC
- ↑ a b In the absence of estimated pre-industrial (1700s) fields of temperature and salinity, present day (1990s) fields were used (although these contain a small signal from global warming)
Licensing
I, the copyright holder of this work, hereby publish it under the following licenses:

|
Permission is granted to copy, distribute and/or modify this document under the terms of the GNU Free Documentation License, Version 1.2 or any later version published by the Free Software Foundation; with no Invariant Sections, no Front-Cover Texts, and no Back-Cover Texts. A copy of the license is included in the section entitled GNU Free Documentation License. |
| This file is licensed under the Creative Commons Attribution-Share Alike 3.0 Unported license. | ||
| ||
| This licensing tag was added to this file as part of the GFDL licensing update. |
This file is licensed under the Creative Commons Attribution 2.5 Generic license.
- You are free:
- to share – to copy, distribute and transmit the work
- to remix – to adapt the work
- Under the following conditions:
- attribution – You must give appropriate credit, provide a link to the license, and indicate if changes were made. You may do so in any reasonable manner, but not in any way that suggests the licensor endorses you or your use.
You may select the license of your choice.
File history
Click on a date/time to view the file as it appeared at that time.
| Date/Time | Thumbnail | Dimensions | User | Comment | |
|---|---|---|---|---|---|
| current | 16:16, 2 April 2007 | | 1,683 × 1,133 (232 KB) | Nils Simon | == Summary == Change in sea surface pH from the pre-industrial period (1700s) to the present day (1990s). Calculated using [http://www.soest.hawaii.edu/oceanography/faculty/zeebe.html Richard Zeebe]'s [http://www.soe |
File usage
The following page uses this file:
Global file usage
The following other wikis use this file:
- Usage on ast.wikipedia.org
- Usage on de.wikipedia.org
- Usage on en.wikipedia.org
- Usage on es.wikipedia.org
- Usage on eu.wikipedia.org
- Usage on fa.wikipedia.org
- Usage on fi.wikipedia.org
- Usage on fr.wikipedia.org
- Usage on gl.wikipedia.org
- Usage on hi.wikipedia.org
- Usage on hy.wikipedia.org
- Usage on it.wikipedia.org
- Usage on ja.wikipedia.org
- Usage on lt.wikipedia.org
- Usage on pl.wikipedia.org
- Usage on pt.wikipedia.org
- Usage on si.wikipedia.org