File:Implication Chart Setup.svg
Jump to navigation
Jump to search

Size of this PNG preview of this SVG file: 600 × 275 pixels. Other resolutions: 320 × 147 pixels | 640 × 293 pixels | 1,024 × 469 pixels | 1,280 × 587 pixels | 2,560 × 1,173 pixels.
Original file (SVG file, nominally 600 × 275 pixels, file size: 37 KB)
|
|
This is a file from the Wikimedia Commons |
| Description |
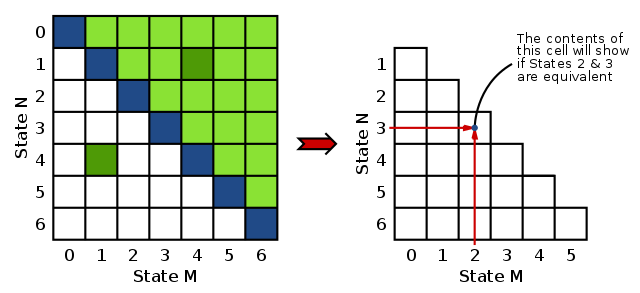
English: A diagram showing how Implication charts are derived. The ocntents so cell (M,N) show if states M and N are equivalent or not. |
||
| Date | |||
| Source | Own work | ||
| Author | Inductiveload | ||
| Permission (Reusing this file) |
|
||
| SVG development | This W3C-invalid diagram was created with Inkscape, or with something else. This diagram uses embedded text that can be easily translated using a text editor. |
File history
Click on a date/time to view the file as it appeared at that time.
| Date/Time | Thumbnail | Dimensions | User | Comment | |
|---|---|---|---|---|---|
| current | 22:30, 30 April 2009 | | 600 × 275 (37 KB) | Inductiveload | fix bad border on green squares |
| 22:30, 30 April 2009 |  | 600 × 275 (36 KB) | Inductiveload | {{Information |Description={{en|1=A diagram showing how en:Implication charts are derived. The ocntents so cell (M,N) show if states M and N are equivalent or not.}} |Source=Own work by uploader |Author=Inductiveload |Date=200 |
File usage
The following page uses this file: