File:Gaussianprocess gapMean.svg
Jump to navigation
Jump to search

Size of this PNG preview of this SVG file: 360 × 180 pixels. Other resolutions: 320 × 160 pixels | 640 × 320 pixels | 1,024 × 512 pixels | 1,280 × 640 pixels | 2,560 × 1,280 pixels.
Original file (SVG file, nominally 360 × 180 pixels, file size: 26 KB)
|
|
This is a file from the Wikimedia Commons |
Summary
| Description |
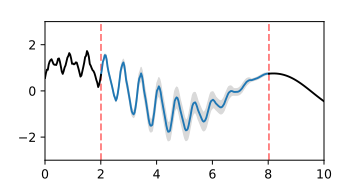
English: Gaussian process posterior of function with gap visualized by mean function and confidence interval |
| Date | |
| Source | Own work |
| Author | Physikinger |
| SVG development | This plot was created with Matplotlib. |
| Source code | Python code#This source code is public domain
#Author: Christian Schirm
import numpy, scipy.spatial
import matplotlib.pyplot as plt
import imageio
def covMat(x1, x2, covFunc, noise=0): # Covariance matrix
cov = covFunc(scipy.spatial.distance_matrix(numpy.atleast_2d(x1).T, numpy.atleast_2d(x2).T))
if noise: cov += numpy.diag(numpy.ones(len(cov))*noise)
return cov
numpy.random.seed(107)
covFunc1 = lambda d: 2*numpy.exp(-numpy.abs(numpy.sin(1.55*numpy.pi*d))**1.9/3 - d**2/7.)
covFunc2 = lambda d: 1*numpy.exp( - d**2/6.)
covFunc = lambda d: 1.5*numpy.exp(-numpy.abs(numpy.sin(1.55*numpy.pi*d))**1.9/3 - d**2/10.)
n=60
x = numpy.linspace(0, 10, 300)
y1 = numpy.random.multivariate_normal(x.ravel()*0, covMat(x, x, covFunc1, noise=0.00))
y2 = numpy.random.multivariate_normal(x.ravel()*0, covMat(x, x, covFunc2, noise=0.00))
x_known = numpy.concatenate([x[:n+1], x[-n:]])
y_known = numpy.concatenate([y1[:n+1], y2[-n:]])
x_unknown = x[n:-n+1]
Ckk = covMat(x_known, x_known, covFunc, noise=0.000001)
Cuu = covMat(x_unknown, x_unknown, covFunc, noise=0.00)
CkkInv = numpy.linalg.inv(Ckk)
Cuk = covMat(x_unknown, x_known, covFunc, noise=0.0)
m = 0 #numpy.mean(y)
covPost = Cuu - numpy.dot(numpy.dot(Cuk,CkkInv),Cuk.T)
y_unknown = numpy.dot(numpy.dot(Cuk,CkkInv),y_known)
fig = plt.figure(figsize=(4.0,2))
sigma = numpy.sqrt(numpy.diag(covPost))
plt.plot(x_unknown, y_unknown, label=u'Prediction')
plt.fill_between(x_unknown.ravel(), y_unknown - sigma, y_unknown + sigma, color = '0.85')
plt.plot(x[:n+1], y1[:n+1],'k-')
plt.plot(x[-n:], y2[-n:],'k-')
plt.vlines([x[n], x[-n]],-3,3,colors='r', linestyles='--', alpha=0.5)
plt.axis([0,10,-3,3])
plt.savefig('Gaussianprocess_gapMean.svg')
fig = plt.figure(figsize=(4.0,2))
for c in 'C1 C4 C2'.split():
y_random = numpy.random.multivariate_normal(x_unknown.ravel()*0, covPost)
plt.plot(x_unknown, y_unknown + y_random, c, label=u'Prediction')
sigma = numpy.sqrt(numpy.diag(covPost))
plt.plot(x[:n+1], y1[:n+1],'k-')
plt.plot(x[-n:], y2[-n:],'k-')
plt.vlines([x[n], x[-n]],-3,3,colors='r', linestyles='--', alpha=0.5)
plt.axis([0,10,-3,3])
plt.savefig('Gaussianprocess_gap.svg')
# Uncertainty animation
numpy.random.seed(1)
t = numpy.arange(0, 1, 0.02)
covFunc = lambda d: numpy.exp(-(3*numpy.sin(d*numpy.pi))**2) # Covariance function
chol = numpy.linalg.cholesky(covMat(t, t, covFunc, noise=1E-5))
r = chol.dot(numpy.random.randn(len(t), len(covPost)))
cov = covPost+1E-5*numpy.identity(len(covPost))
rSmooth = numpy.linalg.cholesky(cov).dot(r.T)
images = []
fig = plt.figure(figsize=(4.0,2))
for ti in [0]+list(range(len(t))):
plt.plot(x_unknown, y_unknown + rSmooth[:,ti], label=u'Prediction',alpha=1)
#plt.fill_between(x_unknown.ravel(), y_unknown - sigma, y_unknown + sigma, color = '0.85')
plt.plot(x[:n+1], y1[:n+1],'k-')
plt.plot(x[-n:], y2[-n:],'k-')
plt.vlines([x[n], x[-n]],-3,3,colors='r', linestyles='--', alpha=0.5)
plt.axis([0,10,-3,3])
plt.xlabel('t')
#plt.tight_layout()
fig.canvas.draw()
s, (width, height) = fig.canvas.print_to_buffer()
images.append(numpy.fromstring(s, numpy.uint8).reshape((height, width, 4)))
fig.clf()
# Save GIF animation
imageio.mimsave('Gaussianprocess_gapUncertainty.gif', images[1:])
|
Licensing
I, the copyright holder of this work, hereby publish it under the following license:
| This file is made available under the Creative Commons CC0 1.0 Universal Public Domain Dedication. | |
| The person who associated a work with this deed has dedicated the work to the public domain by waiving all of their rights to the work worldwide under copyright law, including all related and neighboring rights, to the extent allowed by law. You can copy, modify, distribute and perform the work, even for commercial purposes, all without asking permission.
|
File history
Click on a date/time to view the file as it appeared at that time.
| Date/Time | Thumbnail | Dimensions | User | Comment | |
|---|---|---|---|---|---|
| current | 12:06, 1 December 2019 | | 360 × 180 (26 KB) | Physikinger | Random Seed |
| 22:53, 27 February 2018 |  | 360 × 180 (32 KB) | Physikinger | Shifted line | |
| 21:49, 27 February 2018 |  | 360 × 180 (26 KB) | Physikinger | new | |
| 21:11, 27 February 2018 |  | 360 × 180 (26 KB) | Physikinger | Asymmetric interpolation | |
| 23:13, 26 February 2018 |  | 360 × 180 (27 KB) | Physikinger | User created page with UploadWizard |
File usage
The following page uses this file:
Global file usage
The following other wikis use this file:
- Usage on de.wikipedia.org