File:Benztol phase calc example.PNG
Jump to navigation
Jump to search
Size of this preview: 585 × 600 pixels. Other resolutions: 234 × 240 pixels | 594 × 609 pixels.
Original file (594 × 609 pixels, file size: 21 KB, MIME type: image/png)
|
|
This is a file from the Wikimedia Commons |

|
This file was moved to Wikimedia Commons from en.wikibooks using a bot script. All source information is still present. It requires review. Additionally, there may be errors in any or all of the information fields; information on this file should not be considered reliable and the file should not be used until it has been reviewed and any needed corrections have been made. Once the review has been completed, this template should be removed. For details about this file, see below. Check now! |
Summary
| Description |
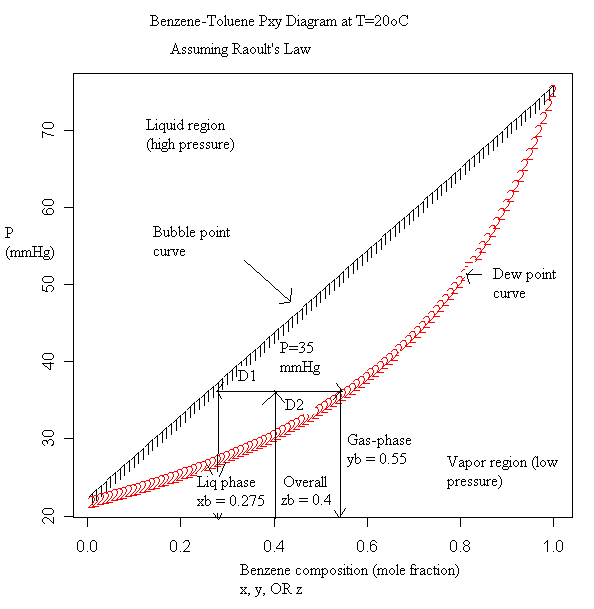
English: I edited the example from R to show how to use tie lines to calculate percent composition as well as the amount in each phase. |
| Date | 12 July 2007 (original upload date) |
| Source | Transferred from en.wikibooks to Commons. |
| Author | Mattb112885 at English Wikibooks |
Licensing
Mattb112885 at English Wikibooks, the copyright holder of this work, hereby publishes it under the following license:

|
Permission is granted to copy, distribute and/or modify this document under the terms of the GNU Free Documentation License, Version 1.2 or any later version published by the Free Software Foundation; with no Invariant Sections, no Front-Cover Texts, and no Back-Cover Texts. A copy of the license is included in the section entitled GNU Free Documentation License. |
| This file is licensed under the Creative Commons Attribution-Share Alike 3.0 Unported license. | ||
| Attribution: Mattb112885 at English Wikibooks | ||
| ||
| This licensing tag was added to this file as part of the GFDL licensing update. |
Original upload log
The original description page was here. All following user names refer to en.wikibooks.
| Date/Time | Dimensions | User | Comment |
|---|---|---|---|
| 2007-07-12 01:23 | 594×609× (21714 bytes) | Mattb112885 | I edited the example from R to show how to use tie lines to calculate percent composition as well as the amount in each phase. |
File history
Click on a date/time to view the file as it appeared at that time.
| Date/Time | Thumbnail | Dimensions | User | Comment | |
|---|---|---|---|---|---|
| current | 14:14, 19 August 2017 | | 594 × 609 (21 KB) | JackPotte | {{BotMoveToCommons|en.wikibooks|year={{subst:CURRENTYEAR}}|month={{subst:CURRENTMONTHNAME}}|day={{subst:CURRENTDAY}}}} == {{int:filedesc}} == {{Information |Description={{en|I edited the example from R to show how to use tie lines to calculate percent... |
File usage
The following 2 pages use this file: