File:WOA09 1000m AOU AYool.png
Jump to navigation
Jump to search

Size of this preview: 800 × 551 pixels. Other resolutions: 320 × 221 pixels | 640 × 441 pixels | 1,024 × 706 pixels | 1,280 × 882 pixels | 2,560 × 1,764 pixels | 3,217 × 2,217 pixels.
Original file (3,217 × 2,217 pixels, file size: 181 KB, MIME type: image/png)
|
|
This is a file from the Wikimedia Commons |
Summary
| Description |
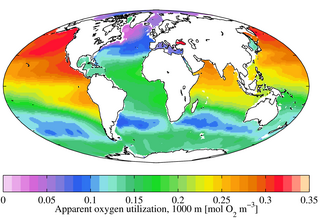
English: Annual mean apparent oxygen utilisation at 1000 m depth from the World Ocean Atlas 2009. Apparent oxygen utilisation here is in mmol O2 m-3. It is plotted here using a Mollweide projection (using MATLAB and the M_Map package). |
| Date | |
| Source | Own work |
| Author | Plumbago |
This diagram was created with MATLAB.
Licensing
I, the copyright holder of this work, hereby publish it under the following license:
This file is licensed under the Creative Commons Attribution-Share Alike 3.0 Unported license.
- You are free:
- to share – to copy, distribute and transmit the work
- to remix – to adapt the work
- Under the following conditions:
- attribution – You must give appropriate credit, provide a link to the license, and indicate if changes were made. You may do so in any reasonable manner, but not in any way that suggests the licensor endorses you or your use.
- share alike – If you remix, transform, or build upon the material, you must distribute your contributions under the same or compatible license as the original.
File history
Click on a date/time to view the file as it appeared at that time.
| Date/Time | Thumbnail | Dimensions | User | Comment | |
|---|---|---|---|---|---|
| current | 11:20, 5 December 2012 | | 3,217 × 2,217 (181 KB) | Plumbago | User created page with UploadWizard |
File usage
The following page uses this file:
Global file usage
The following other wikis use this file:
- Usage on ar.wikipedia.org
- Usage on ba.wikipedia.org
- Usage on cv.wikipedia.org
- Usage on en.wikipedia.org
- Usage on fa.wikipedia.org
- Usage on it.wikipedia.org
- Usage on mk.wikipedia.org
- Usage on pt.wikipedia.org
- Usage on ru.wikipedia.org
- Usage on vi.wikipedia.org