File:Two-Slit Experiment Approximation.svg
Jump to navigation
Jump to search

Size of this PNG preview of this SVG file: 400 × 375 pixels. Other resolutions: 256 × 240 pixels | 512 × 480 pixels | 819 × 768 pixels | 1,092 × 1,024 pixels | 2,185 × 2,048 pixels.
Original file (SVG file, nominally 400 × 375 pixels, file size: 35 KB)
|
|
This is a file from the Wikimedia Commons |
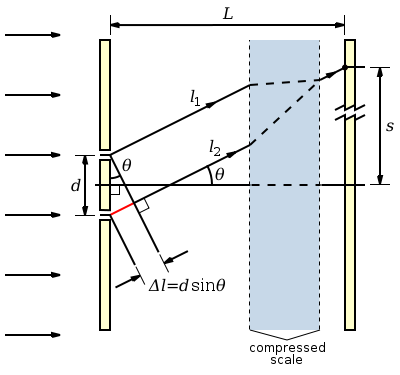
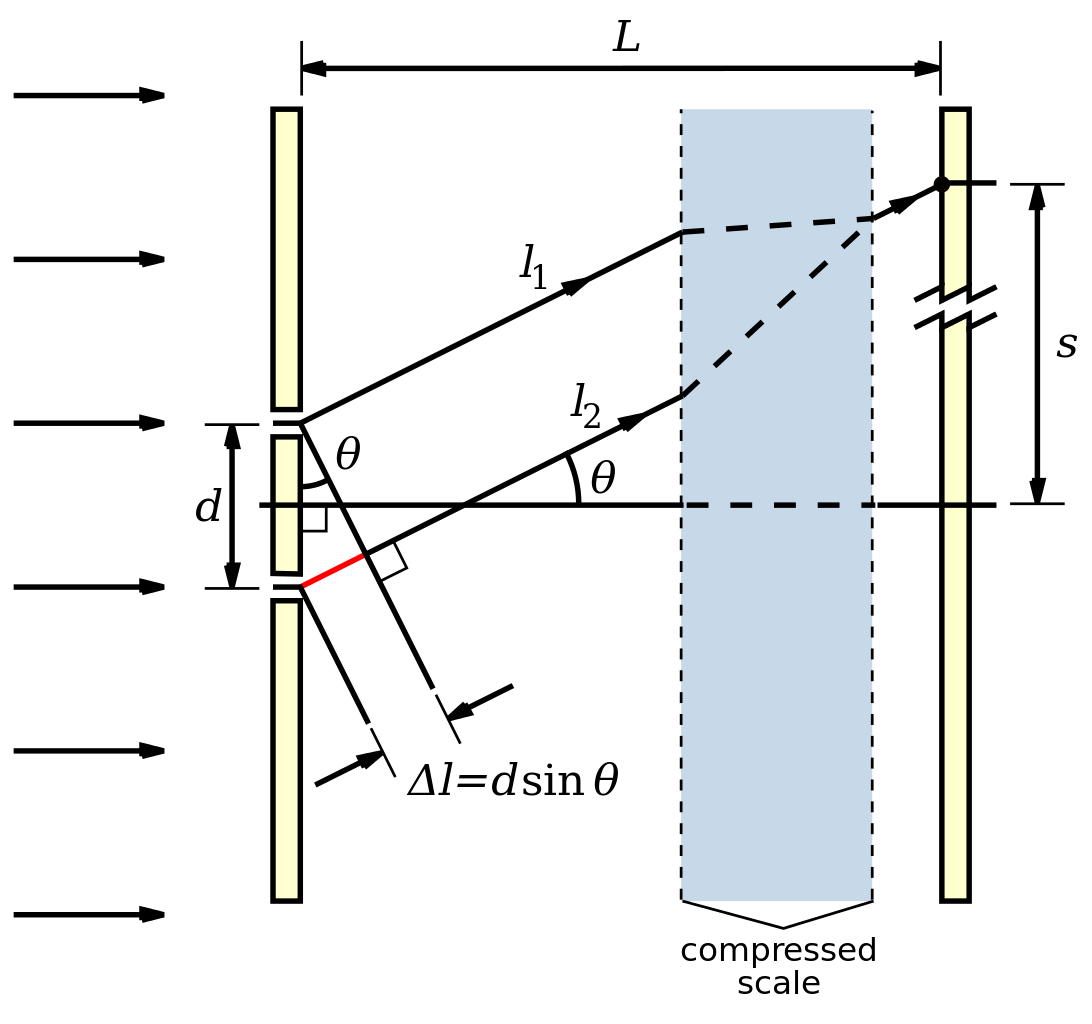
| Description | A diagram to show the construction use to deduce the necessary angle for maxima or minima to occur in the two-slit experiment. | ||
| Date | |||
| Source |
Own work This W3C-unspecified vector image was created with Inkscape . |
||
| Author | Inductiveload | ||
| Permission (Reusing this file) |
|
File history
Click on a date/time to view the file as it appeared at that time.
| Date/Time | Thumbnail | Dimensions | User | Comment | |
|---|---|---|---|---|---|
| current | 17:56, 12 May 2009 | | 400 × 375 (35 KB) | Inductiveload | added ray lables |
| 17:37, 12 May 2009 |  | 400 × 375 (33 KB) | Inductiveload | added imcoming rays and chenged to text rather than paths | |
| 02:56, 14 June 2007 |  | 350 × 375 (31 KB) | Inductiveload | ||
| 02:28, 14 June 2007 |  | 300 × 375 (28 KB) | Inductiveload | Added arrows to the rays | |
| 02:25, 14 June 2007 |  | 300 × 375 (27 KB) | Inductiveload | {{Information |Description=A diagram to show the construction use to deduce the necessary angle for maxima or minima to occur in the two-slit experiment. |Source=self-made {{Inkscape}} |Date=14/06/2007 |Author= Inductiveload |Permis |
File usage
The following 2 pages use this file:
Global file usage
The following other wikis use this file:
- Usage on hu.wikipedia.org