File:Network externalities expectation vs demand dynamic 04.svg
Jump to navigation
Jump to search

Size of this PNG preview of this SVG file: 443 × 348 pixels. Other resolutions: 306 × 240 pixels | 611 × 480 pixels | 978 × 768 pixels | 1,280 × 1,006 pixels | 2,560 × 2,011 pixels.
Original file (SVG file, nominally 443 × 348 pixels, file size: 30 KB)
|
|
This is a file from the Wikimedia Commons |
Summary
| Description |
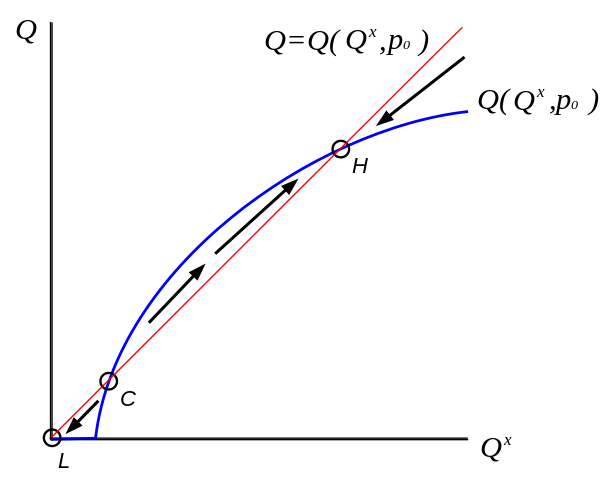
English: Graph of actual quantity versus expected quantity for a good with strong network externalities, with flipped overlay of same. Demand equilibria labeled, showing generalized dynamics. |
| Date | |
| Source | Own work |
| Author | Cretog8 |
| Other versions | File:Network externalities expectation vs demand overlay 02.svg |
Licensing
I, the copyright holder of this work, hereby publish it under the following licenses:
This file is licensed under the Creative Commons Attribution-Share Alike 3.0 Unported license.
- You are free:
- to share – to copy, distribute and transmit the work
- to remix – to adapt the work
- Under the following conditions:
- attribution – You must give appropriate credit, provide a link to the license, and indicate if changes were made. You may do so in any reasonable manner, but not in any way that suggests the licensor endorses you or your use.
- share alike – If you remix, transform, or build upon the material, you must distribute your contributions under the same or compatible license as the original.

|
Permission is granted to copy, distribute and/or modify this document under the terms of the GNU Free Documentation License, Version 1.2 or any later version published by the Free Software Foundation; with no Invariant Sections, no Front-Cover Texts, and no Back-Cover Texts. A copy of the license is included in the section entitled GNU Free Documentation License. |
You may select the license of your choice.
File history
Click on a date/time to view the file as it appeared at that time.
| Date/Time | Thumbnail | Dimensions | User | Comment | |
|---|---|---|---|---|---|
| current | 22:50, 7 October 2010 | | 443 × 348 (30 KB) | Cretog8 | re-dimensioned |
| 21:35, 4 October 2010 |  | 530 × 460 (30 KB) | Cretog8 | switched from flipped curves to single curve and 45-degree line | |
| 02:23, 3 October 2010 |  | 530 × 460 (20 KB) | Cretog8 | {{Information |Description={{en|1=Graph of actual quantity versus expected quantity for a good with strong network externalities, with flipped overlay of same. Demand equilibria labeled, showing generalized dynamics.}} |Source={{own}} |Author=[[User:Creto |
File usage
The following page uses this file: