File:Ethanol near IR spectrum.png
Jump to navigation
Jump to search
Size of this preview: 800 × 558 pixels. Other resolutions: 320 × 223 pixels | 640 × 447 pixels | 1,024 × 714 pixels | 1,280 × 893 pixels | 2,560 × 1,786 pixels | 3,500 × 2,442 pixels.
Original file (3,500 × 2,442 pixels, file size: 243 KB, MIME type: image/png)
|
|
This is a file from the Wikimedia Commons |
| Description |
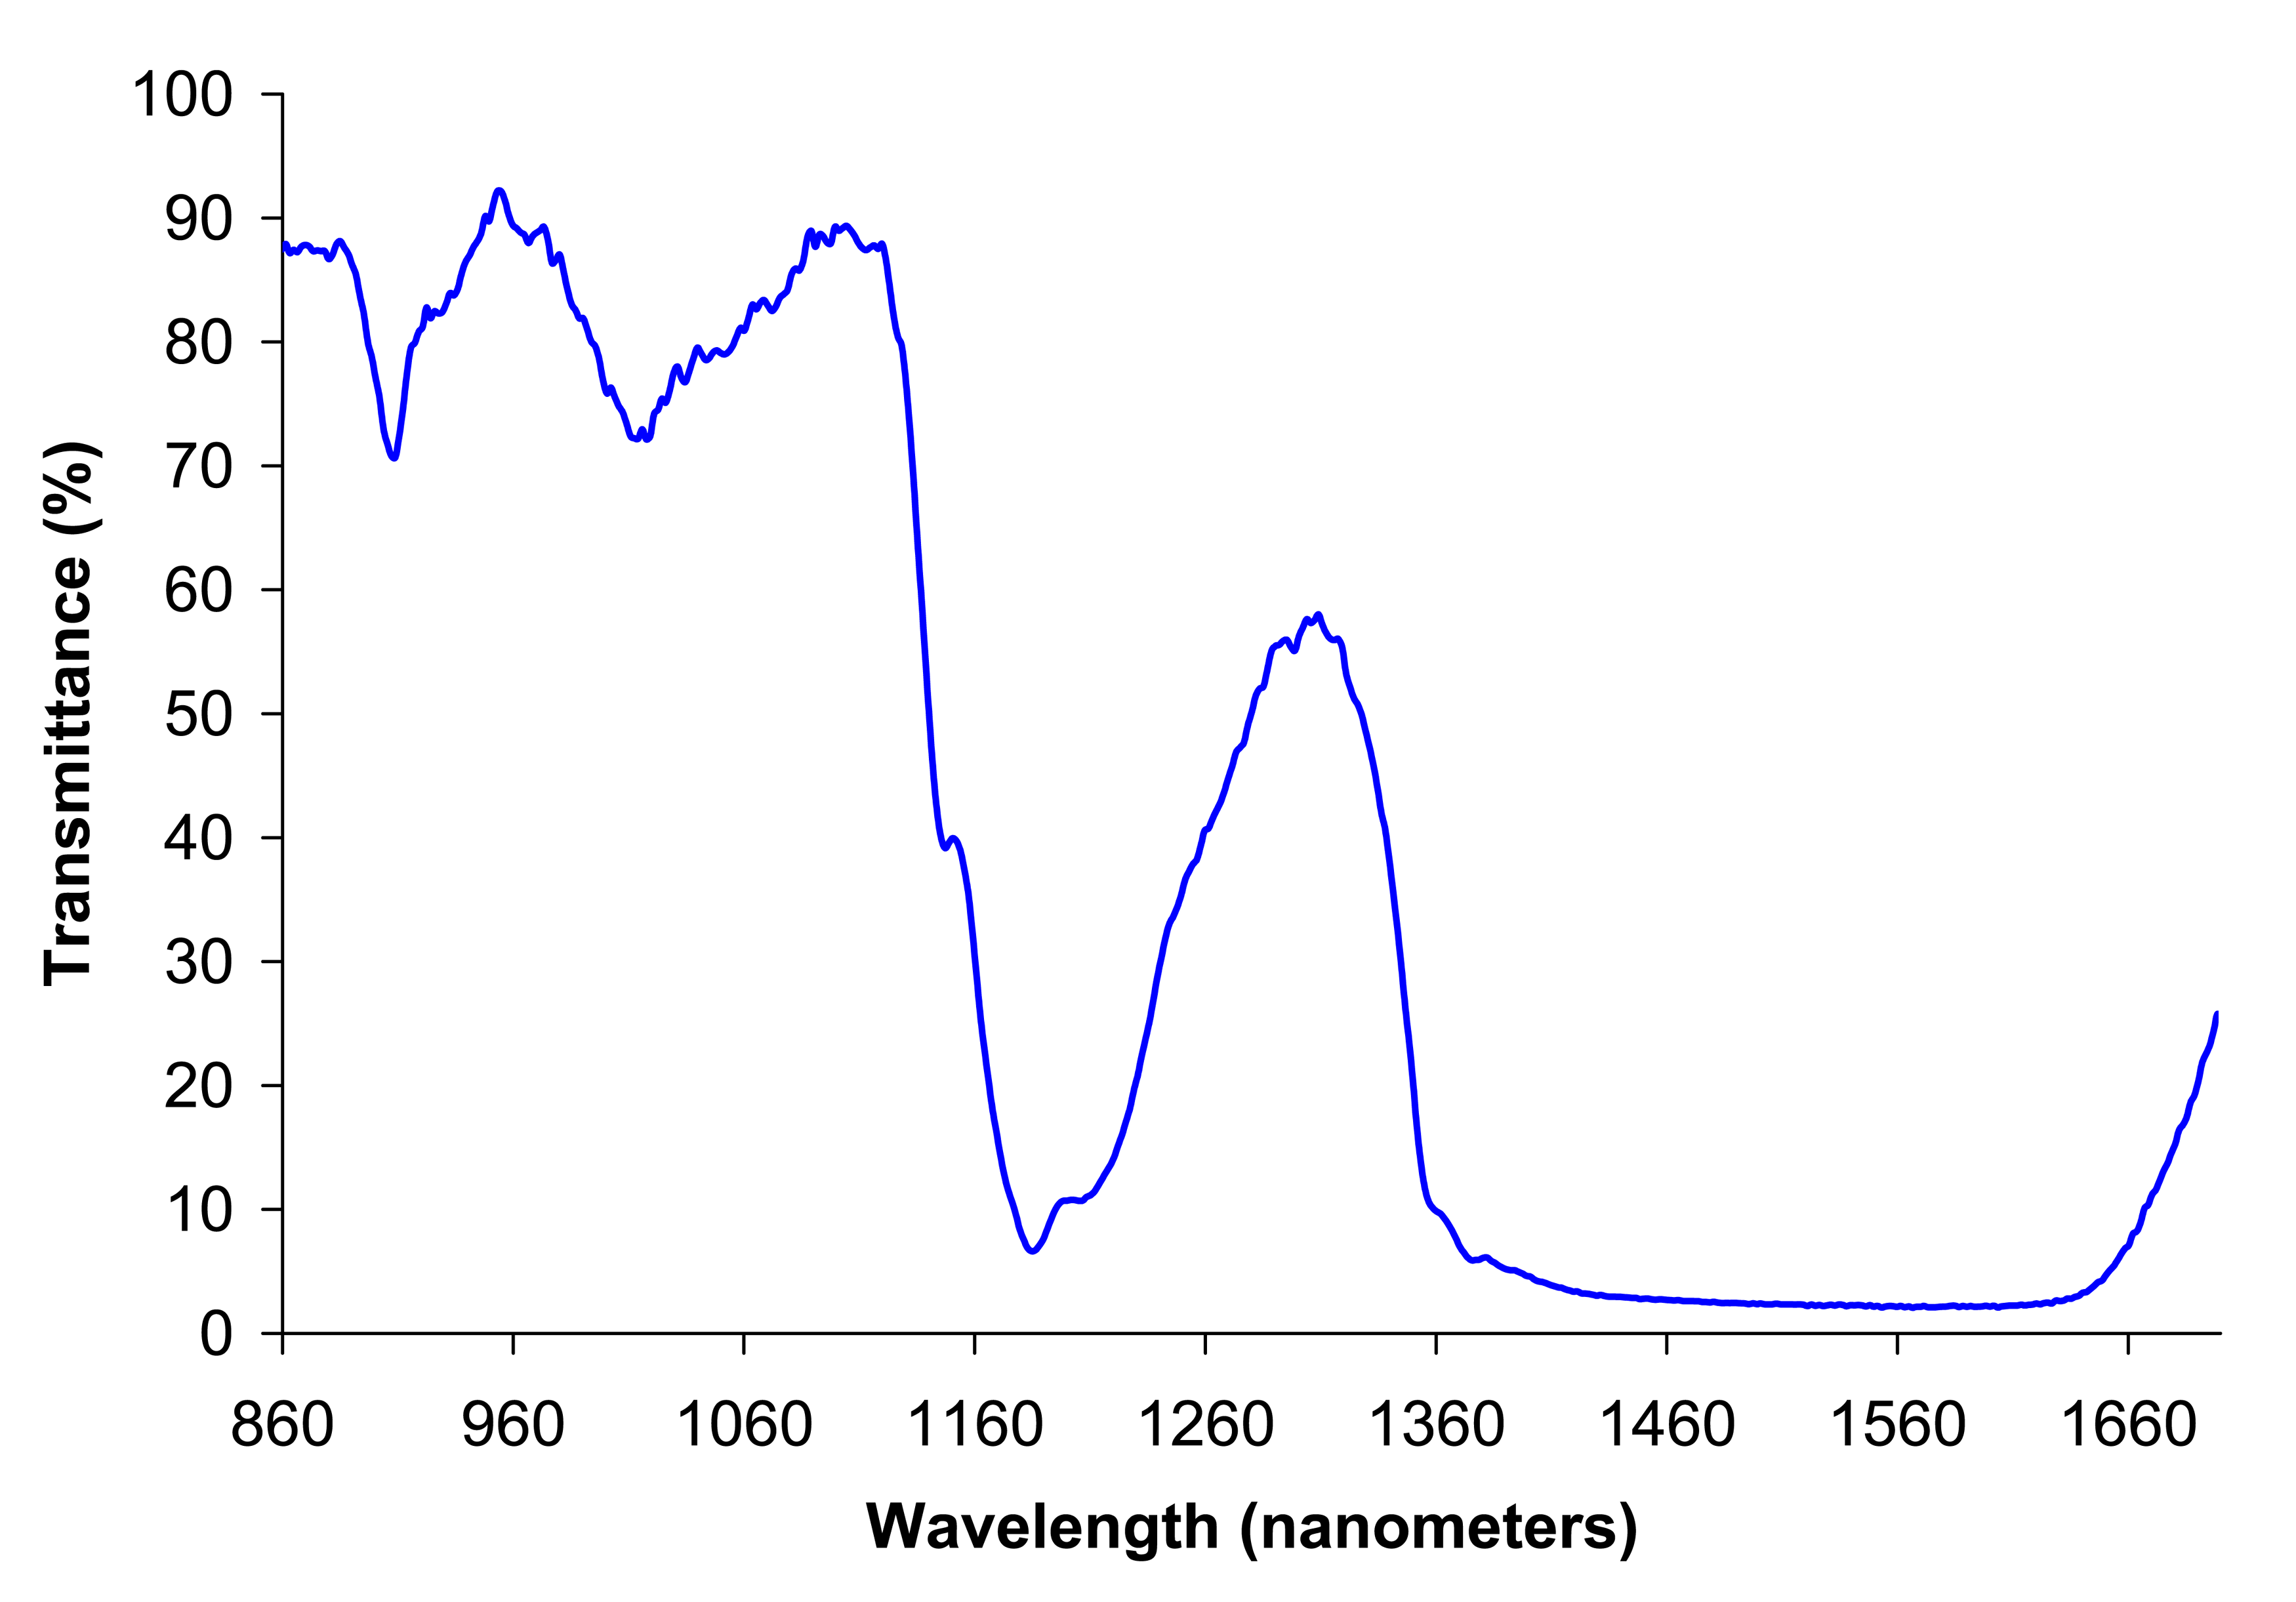
English: Ethanol near IR spectrum. I took this spectrum using an Ocean Optics near IR (NIR-512) temperature-regulated InGaAs detector spectrometer [1] with IR fiber optic light guide. This is a very rough spectrum and should not be used for any kind of quantitative data whatsoever. I took it by shining the light from a halogen lightbulb through a tiny (~20ml) beaker of liquid ethanol (~2cm liquid optical path) and into the fiber optic of the spectrometer (I subtracted the spectrum of the empty beaker before taking this one). The spectrometer was not really intended to be used this way and it is a very sloppy way to take a spectrum! Nonetheless, based on comparing it to simillarly taken spectra of water and methanol (and other professionally traken nir ethanol spectra), with the exception of the region between about 1400 and 1600nm (this region is saturated by very strong absorbance), I think it likely fairly accurately shows real features of the NIR spectrum of this compound. |
||||||||
| Date | 10 September 2006 (original upload date) | ||||||||
| Source | Transferred from en.wikipedia to Commons by Sevela.p using CommonsHelper. | ||||||||
| Author | The original uploader was Deglr6328 at English Wikipedia. | ||||||||
| Permission (Reusing this file) |
Deglr6328 at the English-language Wikipedia, the copyright holder of this work, hereby publishes it under the following license:
|

Original upload log
The original description page was here. All following user names refer to en.wikipedia.
- 2006-09-10 02:08 Deglr6328 3500×2442×8 (328803 bytes) [[Ethanol]] near IR spectrum. I took this spectrum using an Ocean Optics HR4000 spectrometer [http://www.oceanoptics.com/] with IR fiber optic light guide. This is a very rough spectrum and should not be used for any kind of quantitative data whatsoever.
File history
Click on a date/time to view the file as it appeared at that time.
| Date/Time | Thumbnail | Dimensions | User | Comment | |
|---|---|---|---|---|---|
| current | 20:37, 15 March 2009 | | 3,500 × 2,442 (243 KB) | Mahahahaneapneap | Compressed |
| 23:43, 18 June 2008 |  | 3,500 × 2,442 (321 KB) | File Upload Bot (Magnus Manske) | {{BotMoveToCommons|en.wikipedia}} {{Information |Description={{en|en:Ethanol near IR spectrum. I took this spectrum using an Ocean Optics near IR (NIR-512) temperature-regulated InGaAs detector spectrometer [http://www.oceanoptics.com/] with IR fibe |
File usage
The following page uses this file:
Global file usage
The following other wikis use this file:
- Usage on bn.wikipedia.org
- Usage on de.wikipedia.org
- Usage on en.wikipedia.org
- Usage on es.wikipedia.org
- Usage on ko.wikipedia.org
- Usage on mk.wikipedia.org
- Usage on vi.wikipedia.org