File:Diagram showing the Earth's energy budget, which includes the greenhouse effect (NASA).png
Diagram_showing_the_Earth's_energy_budget,_which_includes_the_greenhouse_effect_(NASA).png (720 × 480 pixels, file size: 61 KB, MIME type: image/png)
|
|
This is a file from the Wikimedia Commons |
.png)

|
This diagram image could be re-created using vector graphics as an SVG file. This has several advantages; see Commons:Media for cleanup for more information. If an SVG form of this image is available, please upload it and afterwards replace this template with
{{vector version available|new image name}}.
It is recommended to name the SVG file “Diagram showing the Earth's energy budget, which includes the greenhouse effect (NASA).svg”—then the template Vector version available (or Vva) does not need the new image name parameter. |
Summary
| Description |
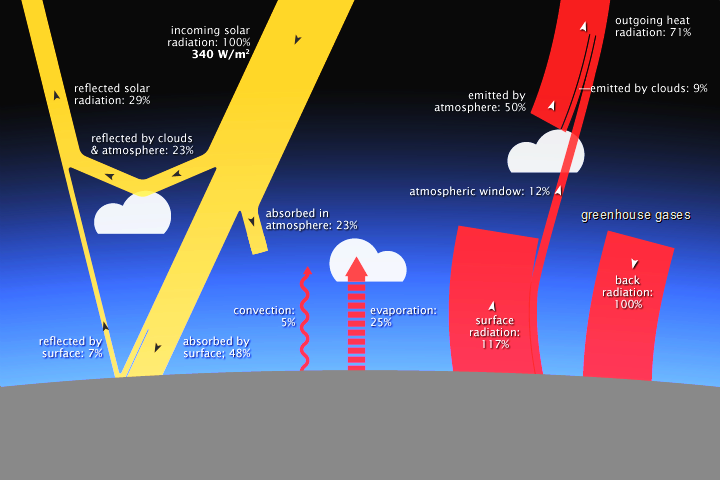
English: This diagram shows the Earth's energy budget, which includes the greenhouse effect. The following description is an edited quote from a public-domain source (Lindsey, 2009): On average, 340 watts per square meter (W.m-2) of solar energy arrives at the top of the atmosphere. Earth returns an equal amount of energy back to space by reflecting some incoming light and by radiating heat (thermal infrared energy). Most solar energy is absorbed at the surface, while most heat is radiated back to space by the atmosphere. Earth's average surface temperature is maintained by two large, opposing energy fluxes between the atmosphere and the ground (right)—the greenhouse effect. Incoming solar radiation to the Earth is equal to 340 watts per square meter (100%). Of this (units are a percentage of incoming solar radiation to the Earth):
The Earth's surface releases 5% of the energy into the atmosphere by convection and 25% by evaporation.
Trenberth et al. (2009) estimate an energy imbalance at the top-of-the-atmosphere of 0.9 watts per square meter, due to the enhanced greenhouse effect.
|
| Date | |
| Source | global_energy_budget_components.png, on: The Atmosphere’s Energy Budget (page 6), in Climate and Earth’s Energy Budget (author: Lindsey, R.), Feature Articles. Publisher: Earth Observatory, part of the EOS Project Science Office, located at NASA Goddard Space Flight Center |
| Author | Robert Simmon |
| Permission (Reusing this file) |
Image Use Policy: "Most materials published on the Earth Observatory, including images, are freely available for re-publication or re-use, including commercial purposes, with the following exceptions: *where copyright is indicated, you must obtain the copyright holder’s permission; we usually provide links to the organization that holds the copyright, *images from the SeaWiFS sensor older than five years are in the public domain and can be re-used or re-published for any purpose. Images less than five years old can be re-used only for educational or scientific purposes; any commercial use of such images must be coordinated with GeoEye. We ask that NASA’s Earth Observatory be given credit for its original materials; the only mandatory credit is NASA." Non-copyright status of image confirmed by e-mail. |
| This is a retouched picture, which means that it has been digitally altered from its original version. Modifications: (1) Adjusted colors to increase contrast and saturation, (2) modified text "greenhouse gases" to increase contrast.
|
Licensing
This work is based on a work in the public domain. It has been digitally enhanced and/or modified. This derivative work has been (or is hereby) released into the public domain by its author, Enescot. This applies worldwide.
In some countries this may not be legally possible; if so: |
File history
Click on a date/time to view the file as it appeared at that time.
| Date/Time | Thumbnail | Dimensions | User | Comment | |
|---|---|---|---|---|---|
| current | 22:49, 29 February 2016 | | 720 × 480 (61 KB) | Cmdrjameson | Compressed with pngout. Reduced by 30kB (33% decrease). |
| 06:21, 31 October 2012 |  | 720 × 480 (91 KB) | Enescot | {{Information |Description ={{en|1=This diagram shows the Earth's energy budget, which includes the greenhouse effect. The following description is an edited quote from a public-domain source (... |
File usage
The following 2 pages use this file:
Global file usage
The following other wikis use this file:
- Usage on da.wikipedia.org
- Usage on en.wikipedia.org
- Usage on ga.wikipedia.org
- Usage on it.wikipedia.org
- Usage on nn.wikipedia.org
- Usage on no.wikipedia.org
- Usage on sv.wikipedia.org
- Usage on zh.wikipedia.org
.png)