File:Datest Nonlinear Regression Tuberculosis vs Aids.JPG
Datest_Nonlinear_Regression_Tuberculosis_vs_Aids.JPG (800 × 600 pixels, file size: 60 KB, MIME type: image/jpeg)
|
|
This is a file from the Wikimedia Commons |

|
This file was moved to Wikimedia Commons from en.wikibooks using a bot script. All source information is still present. It requires review. Additionally, there may be errors in any or all of the information fields; information on this file should not be considered reliable and the file should not be used until it has been reviewed and any needed corrections have been made. Once the review has been completed, this template should be removed. For details about this file, see below. Check now! |
Summary
| Description |
English: This picture has been created with MD*Tech XploRe.
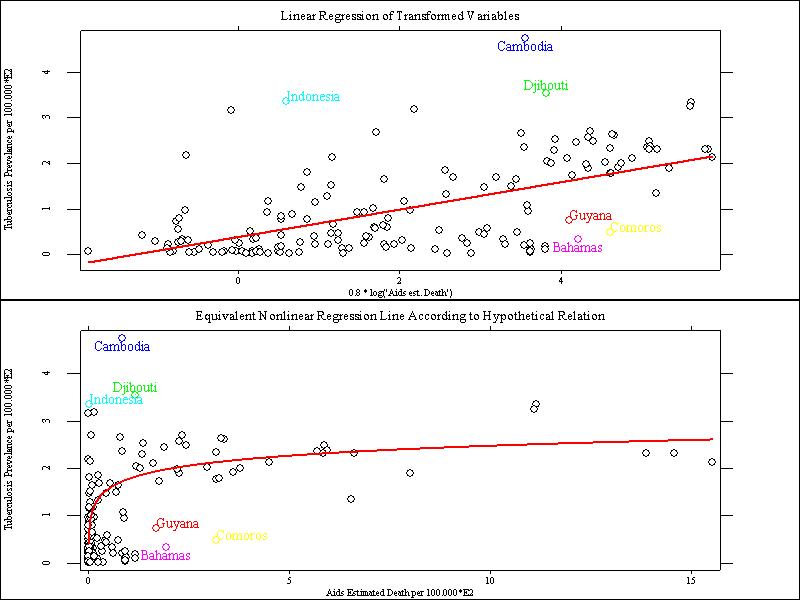
Upper GraphicThis chart is generated by transforming the axes of the coordinate system according to a hypothetical relation between the variables. The functional form used here, is based on the assumption of exponentially increasing numbers of aids related deaths if tuberculosis prevalence is high. Although, both variables are mutually related, medical scientists would probably argue, that aids related deaths are influenced by tuberculosis prevalence rather than the other way around. So, just rotate the chart if that makes you feel more comfortable. Lower GraphicThis plot shows a nonlinear regression line, which has been calculated by using the upper setting. Program CodeAttention! For repeating the computation a transformed dataset is needed! If you have not yet computated and saved the transformation, run the program for transformation on the wikipage en:Analysis of Tuberculosis first!
library("xplore")
library("stats")

; ----- Reading Data ---------------------------------------------------------------------------

choose = "Read data from:"

defaults = "C:\Dokumente und Einstellungen\All Users\Desktop\UN_data_ordered.csv"

v1 = readvalue(choose, defaults)

x = readcsvm(v1)

data = x.double
country = x.text

; ----- Linear Regression of 0.8*log(Aids) on Tuberculosis ------------------------------------

ta = (0.8*log(data[,4]))~((data[,6]))

ta = paf(ta, isInf(ta[,1])==0)

nlreg = grlinreg(ta)

nlreg = setmask(nlreg, "line", "red")

; ----- Nonlinear Regression of Aids on Tuberculosis ------------------------------------------

{beta,bse,bstan,bpval} = linreg(ta[,1], ta[,2])

rx = #(0:max(data[,4]))

yq = beta[1] + beta[2]*log(rx)

rdata = sort (rx~yq)

rdata = setmask (rdata, "line", "red")

; ----- Results of Aids vs. Tuberculosis ------------------------------------------------------

setsize(800, 600)
d1 = createdisplay (2, 1)

; ----- Mark potentiell outliers --------------------------------------------------------------

text = country[data[24|43|70|65|9|33,1]]
tp = data[24|43|70|65|9|33,4|6]
tp2 = 0.8*log(data[24|43|70|65|9|33,4])~data[24|43|70|65|9|33,6]

setmaskt(tp, text, (1|2|3|4|5|6), (6|12|3|3|6|3))
setmaskt(tp2, text, (1|2|3|4|5|6), (6|12|3|3|6|3))
setmaskp(tp, (1|2|3|4|5|6))
setmaskp(tp2, (1|2|3|4|5|6))

; ----- Graphical Options ---------------------------------------------------------------------

show(d1, 1, 1, nlreg, ta, tp2)
show(d1, 2, 1, rdata, data[,4|6], tp)

title1 = "Linear Regression of Transformed Variables"
xaxis1 = "0.8 * log('Aids est. Death')"
yaxis1 = "Tuberculosis Prevelance per 100.000"
setgopt(d1, 1, 1, "title", title1, "ylabel", yaxis1, "xlabel", xaxis1)

title2 = "Equivalent Nonlinear Regression Line According to Hypothetical Relation"
xaxis2 = "Aids Estimated Death per 100.000"
yaxis2 = "Tuberculosis Prevelance per 100.000"
setgopt(d1, 2, 1, "title", title2, "ylabel", yaxis2, "xlabel", xaxis2)
|
| Date | 30 March 2007 (original upload date) |
| Source | Transferred from en.wikibooks to Commons. |
| Author | Schtiwi at English Wikibooks |
Licensing

|
Permission is granted to copy, distribute and/or modify this document under the terms of the GNU Free Documentation License, Version 1.2 or any later version published by the Free Software Foundation; with no Invariant Sections, no Front-Cover Texts, and no Back-Cover Texts. A copy of the license is included in the section entitled GNU Free Documentation License. |
| This file is licensed under the Creative Commons Attribution-Share Alike 3.0 Unported license. | ||
| Attribution: Schtiwi at the English Wikipedia | ||
| ||
| This licensing tag was added to this file as part of the GFDL licensing update. |
Original upload log
| Date/Time | Dimensions | User | Comment |
|---|---|---|---|
| 2007-03-30 11:52 | 800×600× (61705 bytes) | Schtiwi | This picture has been created with MD*Tech XploRe. |

|
This media file is uncategorized.
Please help improve this media file by adding it to one or more categories, so it may be associated with related media files (how?), and so that it can be more easily found.
Please notify the uploader with {{subst:Please link images|File:Datest Nonlinear Regression Tuberculosis vs Aids.JPG}} ~~~~ |
File history
Click on a date/time to view the file as it appeared at that time.
| Date/Time | Thumbnail | Dimensions | User | Comment | |
|---|---|---|---|---|---|
| current | 14:19, 19 August 2017 | | 800 × 600 (60 KB) | JackPotte | {{BotMoveToCommons|en.wikibooks|year={{subst:CURRENTYEAR}}|month={{subst:CURRENTMONTHNAME}}|day={{subst:CURRENTDAY}}}} == {{int:filedesc}} == {{Information |Description={{en|This picture has been created with MD*Tech XploRe. == Upper Graphic == This... |
File usage
The following page uses this file: