
Engineering Acoustics/The Human Ear and Sound Perception
Summary: This page will briefly overview the human auditory system, transducer analogies, and some non linear effects pertaining to specific characteristics of the auditory system. Results from the discipline of Psycho-Acoustics will be presented.
Introduction
[edit | edit source]The human ear is a small physical device with disproportionately large properties. On one hand it can withstand sounds with acoustic pressure levels close to 1kPa which are pretty much the loudest encountered in nature and on the other hand it can detect pressure levels that correspond to displacements of the eardrum of about one tenth the diameter of the hydrogen atom.[1] When including the information processing done in the brain and the physiological response that it elicits, one can see why the Human Auditory System has been giving researchers a hard time since the turn of the twentieth century.
Some researchers approached the auditory system as a very complicated, active transducer;one that transmits the wave information first acoustically, then mechanically, then hydro dynamically, and finally electro-dynamically to the brain.[2]
Others like the legendary Georg Von Bekesy, maintained that the continuously regenerative nature of the living organism should be taken into account when considering the behavior of the auditory system.[3]
Humans however are no strangers to complicated problems. After all, we have been to the moon, so what is going on?
The Problem with humans
[edit | edit source]In order to explore the behavior of any physical system one needs a set of variables describing the system.These variables should be well defined and arise naturally from the physical principles governing the behavior of the system.The same physical principles also provide any researcher with well established means of assessing what constitutes a valid measurement.
Furthermore,in any well behaved physical system the experimenter has control over the variables, to such an extent that he or she can hold most of the variables constant and individually vary a few of them to evaluate the relationship between them and quantify their dependence.
Additionally, in any linear system the principle of superposition holds, so that the overall effect of varying several variables at the same time equates to a linear combination of the individual contributions observed from varying every individual variable independently while keeping everything else constant
The above mentioned usually constitute what can be described as a very happy researcher.However, problems arise when one sets out to evaluate the human auditory system, because hearing is a sensation and just like every other sensation it is an esoteric process. To resolve this problem one has to venture into the realm of psycho-physics and the principles of psychological measurements. It is known that one cannot directly measure sensation, but one can measure the response that the sensation elicits.[4]
With the above approach one can measure quantities such as just noticeable differences; perceptible excitation; increased nervous activity etc. However, the validity or relevance of those measurements cannot readily be confirmed by first principles.[1] The nature of the human auditory system is such that one is not able to decouple and independently vary any of the variables of interest(however those might be defined) and even if one could, the principle of superposition,in general, does not apply.
Non Linearity | Part1
[edit | edit source]After acknowledging the difficulties involved in quantifying the behavior of the auditory system and developing models of hearing one should take a look into specific sources of non-linearity and the mechanisms through such a behavior is imposed upon the auditory system. There is probably no better example of such behavior than what is called the acoustic, auditory or intra-aural reflex.
The Acoustic Reflex
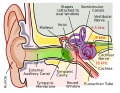
[edit | edit source]The acoustic reflex in man refers to the tendency of the middle ear muscles controlling the behavior of the ossicles (the little bones in the middle ear) to tense under an intense acoustic stimulus, thereby making the inner ear stiffer and in that way limiting the motion of the stapes (the last bone in the chain). This reduction in the motion of the stapes equates to a real rather than a perceived reduction in the amplitude of the vibrations transmitted through the middle ear to the inner ear. The reflex serves to protect the sensitive inner ear from damage during exposure to loud sounds.
Unfortunately, although fast, the auditory reflex it is not an instantaneous reaction. For low frequencies, the response takes from 20 to 40ms to be elicited and therefore offers no protection against loud impulsive sounds like gunshots and explosions.[5] With the onset of the auditory reflex the entire ear exhibits a marked change in acoustic impedance which was observed by 1934 Geffcken and measured by Bekesy and other researchers in subsequent years. It is argued, however, that the onset of the auditory reflex happens for sound of very high intensity and therefore its effect on perception is limited.[6] On the other hand, the same reflex can be voluntarily elicited by, for example, vocalizing. According to Lawrence A. Kinsler, it seems that the mechanical characteristics of the ear are mainly responsible for the response elicited by the auditory system and hence sound perception.[5] Whatever the exact nature of the auditory reflex may be, or what the precise range that it has the most effect however is beyond the scope of this article.
- There is large difference between how a pressure transducer would measure the sound field intensity at a particular location, and how a human would perceive the same field at the same location.
- We need to use a variable that allows us to assign a value to what we consider loud or intense and guidelines on how to measure those quantities.
- Although the effect of the auditory reflex might be more apparent at higher sound intensities, it is not a step function. There is a gradual onset of its effects and the way that it modifies the perception.
- The measured effects of the auditory reflex vary from human to human and are influenced by a great number of factors.
Perceived loudness of pure tones
[edit | edit source]The intensity and loudness of sound are two highly interdependent quantities. Loudness belongs to the psychological attributes of sound and intensity is a precisely defined and measurable physical quantity. Because of their strong similarity, the two quantities were once thought to be one and the same, since if one increases the intensity of a particular sound, the sound becomes louder.[4] In the simplest and clearest terms: intensity is measured sound level and loudness is perceived sound level.
The measured sound level is expressed in terms of intensity and intensity level, while the perceived sound level in expressed in terms of loudness and loudness level.
Sound Intensity is defined as the acoustic power per unit area and it is measured in Watts per square meter
![{\displaystyle I={\frac {Power}{UnitArea}}\quad \left[{\frac {W}{m^{2}}}\right]}](https://wikimedia.org/api/rest_v1/media/math/render/svg/201e00e770fd0a7680151d75005007ec250b9edc)
However, the human ear is capable of detecting sound intensity ranging from 1x10⁻¹²Wm−2 to 1x10²Wm−2(above which intensity permanent damage to the ear will occur). This gives a scale in which the maximum value is 10 000 000 000 000 times larger than the smaller one.[7]
In order to provide more insight and get around the cumbersome numbers we use the Intensity level IL which is defined as the intensity relative to 10x10−12 Wm−2, on a logarithmic scale and it has unit of decibels.
.
![{\displaystyle I_{L}=10\log \left({\frac {I}{I_{ref}}}\right)\quad [dB]}](https://wikimedia.org/api/rest_v1/media/math/render/svg/95851f7f136fd8432303a4cb5fe0d9084929327c)
In planar waves in air and standard temperature and mean pressure, acoustic pressure and Intensity are linked by the following relation:

Where ρ is the air density and c the speed of sound in air. By doing the following:

The expression on the right is deemed the Sound Pressure Level and it is identical to the Intensity Level, but in terms of acoustic pressure.The reference pressure used is 20μPa. It is very close to the average minimum audible acoustic pressure in air in the absence of any noise.[1] It is important to note that the minimum audible pressure is averaged over multiple subjects, therefore for a given percentage of the population, negative Sound pressure levels are perceptible i.e. they can perceive sound pressures smaller than the reference pressure. The chosen reference pressure level corresponds to the reference Intensity through the aforementioned relationship, in a way that SPL and IL are identical.
The qualitative expressions of loud, not very loud, extremely loud, are used to describe loudness. Although these expressions are adequate in describing the sensation in any specific individual, they do a very poor job in quantifying the result. The above qualitative expressions have been made qualitative for pure tones, i.e. sinusoidal waves, with the use of Loudness Level and Loudness.
The loudness level of a particular test tone is an indirect measure of loudness and it is defined as the Sound Pressure Level(SPL) of a 1000 Hz pure tone that sounds as loud as the test tone.[1] The 1000 Hz tone was chosen arbitrarily and retained as the standard. The Loudness level is measured in phons. The Loudness Level of the just audible 1000 Hz tone is defined as 3 phons because the minimum perceptible SPL of a 1 kHz tone is 3 dB. Increments in phons are logarithmic because the SPL is measured in decibels.
The loudness level is very useful in quantifying the sensation, however it fails to provide information on the relation between sounds of different loudness levels. In other words it fails to provide insight on how much louder a sound of e.g. 20 phons is than a sound of 50 phons. To get around this problem, we use Loudness which has units of sones. Loudness is based on the 40 dB, 1000 Hz pure tone which is defined as to have a loudness of 1 sones. The Loudness scale is derived by increasing or decreasing the SPL of the 1 kHz tone until it "sounds twice as loud as before" or "half as loud " etc. Successive halving of the loudness creates the rest of the scale. The Loudness for the remaining tones is determined by the same equal loudness judgment that provides the Loudness Levels.[4]
Loudness and Loudness level are best illustrated and are most useful when plotted against the SPL of pure tones, in what are called equal loudness contours or Fletcher & Munson curves, so named after the earlier researchers, however the way loudness is measured has been significantly altered and standardized since the time when such measurements were first made.
-
 Equal Loudness contours

Some Observations On the above Curves:
- Equal loudness contours are curves that connect points of equal loudness. They hold for durations of sound more than 500 ms, and the values are averages over population with normal hearing.[8]
- Because the standard used is the 1000Hz tone, the loudness level of that tone at any level is equal to its SPL.
- The SPL of the tones is measured with the subject not in the sound field because the listener's presence alters the sound field.
- The Loudness is measured in an anechoic room, with the listener being seated at a distance greater than 1 meter from the source, and it is defined for frontally incident waves. Non frontal incident waves have different characteristics.
- Note the "dip" in the contours around 3kHz. This frequency corresponds to the resonance frequency of the outer ear and it is also close to the median frequency of human speech. The "dip" on the graph, translates to a much higher sensitivity to sound around 3kHz. Unfortunately this also translates to a higher risk of damage from frequencies in than region.
A little bit of bio
[edit | edit source]The cochlea
[edit | edit source]The cochlea, or inner ear, constitutes the hydrodynamic part of the ear. It is a small, hollow, snail shaped member formed from bone and filled with colorless liquid. It has an uncoiled length of about 35mm and a cross-sectional area of about 4mm2 on the end closest to the inner ear, that tapers off to about 1mm2 at the far end.[1]
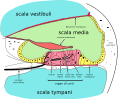
It is filled with two different fluids separated in three different channels that run together from the base of the stapes to the apex of the cochlea, however two of the channels are separated by Raleigh's membrane, which is thin and flexible enough to be neglected from a hydromechanical point of view.[8] The vibrations are transmitted directly from the base-plate of the stapes, the last of the three ossicles, to the contained fluid. The cochlea is divided down the middle by the basilar membrane which is a partly bony and partly gelatinous membrane. It is on this membrane that the organ of corti and the infamous hair cells reside.
-
 The Auditory system and Cochlea
 -
 The three Fluid filled cavities


The basilar membrane
[edit | edit source]As previously mentioned, the basilar membrane is a flexible gelatinous membrane that divides the cochlea longitudinally. It is the flexible part of the cochlear partition (the other being rather bony)and it contains about 25 000 nerve endings attached to numerous haircells arranaged on the surface of the membrane.
It extends from the base to just before the apex of the cochlea at which point it terminates at the helicotrema. This creates two hydromechanically distinct channels, with the baseplate of the stapes attached to the entrance of the upper channel at the oval window, and a highly flexible membrane called the round window sealing the lower channel. The two channels connect at the apex through the helicotrema which is basically a gap through the cochlear partition.
-
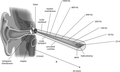
 Diagrammatic longitudinal section of the cochlea showing the location of the Basilar Membrane
 -
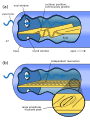 Two Views of Cochlear Mechanics


The vibrations transmitted to the stapes set up acoustic waves in the fluid that travel down the upper channel, through the helicotrema and back up through the lower channel. Since the walls of the cochlea are relatively rigid and the contained fluids relatively incompressible, this causes the basilar membrane to flex. In order to equalize the pressure in the cochlea, the round window "bulges out" and in this way provides pressure release.
The basilar membrane starts out narrowly, with a width of about 0.04mm near the oval window and then widens to about 0.5mm near the helicotrema. This non uniformity in width, along with the pressure release provided at the round window cause the basilar membrane to exhibit maxima of vibration at different locations (distances from the oval window) along the membrane, depending on the frequency of vibration. This makes the basilar membrane behave as an acoustic filter that separates the constituent frequencies of an incoming sound signal depending on the location of the maxima.
-
 Uncoiled cochlea with basilar membrane

Whats up with all the hair?
[edit | edit source]The hair-cells that populate the top surface of the basilar membrane are the last part in the chain of transformation of the mechanical energy of the acoustics wave into electrical impulses. These cells are arranged in an inner row and an outer row in the organ of corti (which runs along the basilar membrane) and they are surrounded by electrically charged cells at different potentials(synapses).[1][8]
-
 Section exposing the hair and hair-cells
 -
 Cochlea-crosssection with the hair-cells visible


As was already mentioned, the basilar membrane exhibits various vibration maxima at different locations when excited by a sound input. As a result of these excitations a relative motion of the fluid parallel to the membrane is effected. This motion produces a shear force on myriads of minuscule hairs protruding from these cells. The disruption produces an electrochemical cascade on the surrounding electrically active cells, which results in a signal to be sent to the brain.
What is really important is to note that these hair-cells are not evenly distributed over the surface of the basilar membrane, but rather they are concentrated in discreet patches. Since different frequencies make different different parts of the membrane vibrate more than others, this means that there are ranges of frequencies that we can perceive better than others, depending on the number density of the hair-cells surrounding the corresponding region on the basilar membrane. This introduces discreetness and gives a sort of minimum resolution to our sense of hearing, thus causing some interesting non linear effects to be discussed soon.
-
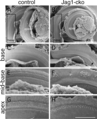 Arrangement of the hair cells on the cochlea. Left=healthy;Right=pattern defects

Due to the similarity between the behavior of the inner ear and the behavior of a band-pass filter, the above groups of frequencies have been named critical bandwidths.[2]
Non Linearity | Part 2
[edit | edit source]Now that a little bit more has been presented about the workings of the inner ear, more peculiarities of the idiosyncratic auditory system can be illustrated, starting with a non linear effect that is fairly common and very noticeable when it occurs. It is the phenomenon of beating.
Beating Phenomena
[edit | edit source]Beating phenomena are a characteristic of multiple degree of freedom systems, where the various degrees of freedom are coupled to some extent and that receive two harmonic excitations at slightly different frequencies. The excitations can be summed as follows:[5]

The resulting vibration is no longer simple harmonic.
The inner ear is a continuous system, with the basilar membrane serving as a complicated bandpass filter to separate frequencies.
When one or both ears are exposed to sound that consists of two tones with a slight difference in their frequencies, the non uniform distribution and strong localization of the hair cells on the surface of the basilar membrane result in the same group (or critical bandwidth) of hair cells being excited by both tonal components of the incident sound.
-
 Beating

As a result, the listener perceives the combination sound as that of a single frequency tone but with periodically varying intensity. This is known as beating.
The tones remain indistinguishable until the frequency separation between them , is greater than the a bandwidth. It is really interesting to note that if the two tones are presented to each ear separately, then no beating occurs and the ear is able to resolve the difference.[4]
References
[edit | edit source]- ↑ a b c d e f Acoustics, Leo L. Beranek 1993, Copyright: Acoustical Society of America, Ch13 Hearing, Speech Inteligibility and Psychoacoustic Criteria
- ↑ a b Overall Loudness of Steady Sounds According to Theory and Experiment, Walton L. Howes, Nasa reference Edition 1001
- ↑ THE JOURNAL OF THE ACOUSTICAL SOCIETY OF AMERICA VOLUME 23.NUMBER 5, SEPTEMBER.1951,DC Potentials and Energy Balance of the Cochlear Partition,GEORG V. Bekesy,Psycho-Acousic Laboratory, Harvard University, Cambridge, Massachusetts,(Received May 5, 1951)
- ↑ a b c d The Measurement of Hearing,Ira J. Hirsh, McGraw Hill Book Company, Inc, First Edition,1952
- ↑ a b c Fundamentals of Acoustics,Lawrence E. Kinsler, Alan B. Coppens,4rth Edition
- ↑ Acoustic Reflex in Man,Aage R. Moller, J. Acoust. Soc. Am. 34, 1524 (1962), DOI:10.1121/1.1918384
- ↑ http://www.engineeringtoolbox.com/sound-intensity-d_712.html
- ↑ a b c Fastl Hugo, and Eberhard Zwicker. Psychoacoustics: Facts and Models. 3rd ed. Berlin: Springer, 2007. Print.