Transportation Geography and Network Science/Resilience
Resilience in Graph Theory[edit | edit source]
Definition[edit | edit source]
Sudakov and Vu (2008)[1] have proposed the most concrete definition of resilience in graph theory: if graph G has property P, what is the minimum number of edges that need to be removed so that G no longer has P?[2] For example, consider the graph in figure 1 and its resilience with respect to connectivity. Removing any one edge leaves a graph that is still connected. It is necessary to remove two edges to produce a graph that is not connected (figure 2). Thus, we could say that this graph has a resilience of 2 with respect to connectivity. Note that this does not mean that removing any two edges will destroy connectivity in this graph. Figure 3 demonstrates the possibility of removing two edges while leaving the graph connected.
-
 Figure 1
 -
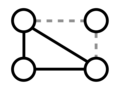 Figure 2
 -
 Figure 3


Under this definition, a given graph will have different values of resilience with respect to different properties. As a result the definition is concrete but flexible, and can be usefully applied to real-world networks where properties are of variable importance from different perspectives.
Some discussions of resilience focus on vertex removal rather than edge removal. The effect of removing a vertex on the rest of the network is equivalent to the effect of removing all edges attached to that vertex.
Edge Removal Methods: Random and Targeted[edit | edit source]
The example above highlights the difference between random edge removal and targeted edge removal. If edges are removed randomly, a property might survive the removal of many edges. Targeted edge removal implies that the graph is analyzed and edges are chosen which will achieve the minimum. [3]
Resilience of Scale-Free Graphs[edit | edit source]
The effect on the network of either type of edge removal depends in part on degree distribution. Graphs following a power-law distribution (scale-free) tend to be highly resilient to random edge removal, because there is a very good chance that the edges removed will connect only low-degree vertices and therefore the overall graph structure will be affected only slightly. They are much more vulnerable, however, to targeted removal of edges attached to high-degree nodes, and especially to the removal of those nodes themselves. In scale-free graphs, these high-degree vertices are critical in connecting subgraphs.[3]
Resilience and Vulnerability[edit | edit source]
A graph with a low resilience with respect to a property can lose that property as a result of only a few edge removals. We can say that the graph is vulnerable with respect to that property.
But this is only part of a complete consideration of vulnerability. The other half has to do with the effect on the network’s performance if the property in question has been lost, and is discussed under Transportation Geography and Network Science/Reliability.
Resilience of Transportation Networks[edit | edit source]

In graph theory, resilience is a binary concept: an edge either exists or it does not; a graph either has a property or it does not. In real-world transportation networks, links have additional properties such as capacity and cost. We can apply the concepts of resilience to transportation networks by considering the effects of changes in link properties on properties of the overall network.

For example, consider the network in figure 4, where the nodes represent cities and the links represent freight rail lines. Each link has a cost representing the time required to traverse it, in hours. It is a property of the network that there exists a path from A to D whose total cost is 10 hours or less. Now imagine some event occurs which increases the cost of the A-D link by 50%, to 15. The exact nature of the event is irrelevant; it could be a snowstorm, fatigued rails, or a government-imposed speed limit. This event was sufficient to destroy the network’s property of having an A-D path of cost 10 or less.
However, it did not destroy the network’s property of connectivity; A and D are still connected (though at a higher path cost). When evaluating the resiliency of a transportation network, it is important to keep in mind that the network will have different levels of resiliency with respect to different properties.
Improving Resilience[edit | edit source]
Once a network’s resilience with respect to a certain property has been evaluated, it is often desirable to improve the resilience. This can be achieved in two fundamental ways: by adding redundancy or by over-provisioning existing links. (Bell 2000, Intro)
Redundancy[edit | edit source]
Imagine that we could reduce the cost of links A-B and C-D from 8 to 6, as shown in figure 5. This improved network has three node-independent paths from A to D of cost 10 or less. If the same event happens to this network, the property will not be destroyed. Destroying the same property in the improved network requires more changes that it did in the original network. Therefore we can say that the improved network is more resilient with respect to this property.
Over-provisioning[edit | edit source]
A link is over-provisioned if it has more capacity than needed to handle normal levels of traffic. This "reserve capacity" can help the link, and therefore the overall network, maintain adequate levels of performance when link capacity is degraded. Capacity will still be reduced, but may remain able to provide a desired level of service. In our example, we can represent over-provisioning by upgrading the A-D link so that its initial cost is 6. The same event increasing its cost by 50% will now result in a cost of 9 hours — still less than the desired service level of 10 hours.
Resilience of road network[edit | edit source]
Murry-Tuite proposed that “resilience is a characteristic that indicates system performance under unusual conditions, recovery speed, and the amount of outside assistance required for restoration to its original functional state” [4] [5] . According to Heaslip et al.’s definition, “resilience is the ability for the system to maintain its demonstrated level of service or to restore itself to that level of service in a specified time frame” [6] [7].
The concept of the resiliency cycle was also introduced by Heaslip, which contains four stages: normality, breakdown, self annealing and recovery [8] [9] . The resiliency cycle is showed in the Figure.

The normality stands for the network conditions without the effect of any disruptions and the network performs as a normal operational system. In this stage, the network has the maximum efficiency [10] [11] . The breakdown stage starts because of the happening of disruptions. It describes the whole process of efficiency reduction suddenly or gradually depends on the characteristics of the disruptions. The efficiency drops to the minimum at the end of the breakdown stage [12] [13] . Self-Annealing begins after the breakdown stage, and both network and network users themselves try to deal with the conditions of the breakdown. Emergency management practices to ease the conditions of the breakdown, and network users may change into alternative routes or traffic modes. The efficiency of the network starts to rise, but in a modest way [14] [15] .
Recovery is the stage that the disruptions caused in the breakdown stage are getting repaired, such as remove the obstructions or restore the damaged facilities. The speed for recovery, which is defined as rapidity, depends on the technologies or resources that are used on recovery. And after that, the system could reach a new stage of normality. And its efficiency may or may not equal to the original efficiency [16] [17] .
A graphical diagram of the resiliency cycle is showed in Figure 9 [18] .
The graph shows the changes of network performance from the old normality to the new normality due to the disruptions happened in the breakdown stage. And the disruptions could be divided into gradual event and sudden event based on the time period that the breakdown stage experienced. The slope of the recovery line is the rapidity we mentioned before. And after recovery, the system could have three conditions: normal better than old, normal same as old and normal worse than old. The area between the solid and dash lines stands for the total performance loss because of the disruptions [19] .
Considering different indices could be used to evaluate the network performance, the total performance loss could have different expressions respect to those indices, such as connectivity, capacity, accessibility and so on. An example network respecting to connectivity, which includes four nodes and five links, are showed in Figures 1, 2 and 3 above.
Another example network respecting to capacity is described here. The picture for that is showed in the figure 4 in [[1]]. We assume that, in the old normality, the capacity for each link is the value showed besides the link in this figure. In this stage, the network could maintain its performance with a relative higher capacity to satisfy the traffic demand. Imaging a disruption happened in Link AD, such as car accident or road maintenance, which decreases its capacity to 5. The network could be treated as in the self-annealing stage when some drivers choose Link AC and Link CD to go from Node A to Node D instead of choosing Link AD directly, or the network management starts to deal with this disruption. And the network could recover itself after the event would have been solved. Moreover, if the event happened to maintain the road condition, the new normality could reach a higher performance than the old one.
References[edit | edit source]
- ↑ Sudakov and Vu 2008,"Local Resilience of Graphs". http://www.math.ucla.edu/~bsudakov/resilience.pdf
- ↑ Sudakov 2008
- ↑ a b Newman 2003
- ↑ Murray-Tuite, Pamela M. “A comparison of transportation network resilience under simulated system optimum and user equilibrium conditions.” Simulation Conference, 2006. WSC 06. Proceedings of the Winter. IEEE, 2006.
- ↑ Pant, Sunil Babu, “Transportation Network Resiliency: A Study of Self-Annealing” (2012). All Graduate Theses and Dissertations. Paper1434.
- ↑ Heaslip, Kevin, et al. “A sketch level method for assessing transportation network resiliency to natural disasters and man-made events.” Transportation Research Board 89th Annual Meeting. No. 10-3185. 2010.
- ↑ Pant, Sunil Babu, “Transportation Network Resiliency: A Study of Self-Annealing” (2012). All Graduate Theses and Dissertations. Paper1434.
- ↑ Heaslip, K., Louisell, W.C., Collura, J., 2009. Quantitative evaluation of transportation resiliency for regional networks, 88th Annual Meeting of the Transportation Research Board, Washington, DC.
- ↑ Pant, Sunil Babu, “Transportation Network Resiliency: A Study of Self-Annealing” (2012). All Graduate Theses and Dissertations. Paper1434.
- ↑ Pant, Sunil Babu, “Transportation Network Resiliency: A Study of Self-Annealing” (2012). All Graduate Theses and Dissertations. Paper1434.
- ↑ Pant, Sunil Babu, “Transportation Network Resiliency: A Study of Self-Annealing” (2012). All Graduate Theses and Dissertations. Paper1434.