Simulation with AnyLogic/Discrete Event Simulation/Bank Model/Step 7. Collecting customer time statistics
Step 7. Collecting Customer Time Statistics
We want to know how much time customer spends waiting in ATM queue and the whole time he spends in the bank. We will collect time statistics using AnyLogic analysis data objects and observe the resulting time distributions using histograms.
First, we will create new entity class Customer to represent customers in our model. This class will have parameters to carry the required time information.
![]() Define Customer Java class
Define Customer Java class
- Right-click model item and choose New|Java Class from the popup menu.

- This opens New Java Class dialog. Type the name of the new Java class: Customer. Specify that Customer is derived from Entity. Therefore, select com.xj.anylogic.enterprise.Entity from the Superclass drop-down list.

- Click Next to open the next page of the wizard. On the second page of the wizard, define the parameters of the class. Create startWaiting parameter of type double to store the time when the customer starts waiting in the ATM queue.

- Click Finish. You will see the code editor for the created class opened.
Type double enteredSystem; in the class body to define one more class parameter. This parameter will store the time when the customer enters the bank department.
- When finished, close the code editor by clicking on the “cross” button in the upper right corner of the editor.


Add histogram data objects to store statistics on customer's waiting time and time in system. Histogram data objects support standard statistical analysis on the data values being added (calculate mean, minimum, maximum, deviation, variance and mean confidence interval).
![]() Add histogram data objects to collect time statistics
Add histogram data objects to collect time statistics
- To add histogram data object on the diagram, drag the Histogram Data from the Analysis stencil of the Palette onto the class diagram.
- Set up the properties of the element.
- Change the Name to waitTimeDistr.
- Change the Title to Waiting time distribution.
- Set the Number of intervals equal to 50.
- Set the Initial interval size: 0.01.

- Create one more histogram data object. Ctrl+drag histogram data object to create its copy. Change the Name to timeInSystemDistr. Change the Title to Time in system distribution.


Now we will modify properties of our flowchart objects.
![]() Modify the properties of the flowchart objects
Modify the properties of the flowchart objects
- Modify source properties:
- Specify new Customer() as New entity. Now this object wiil generate entities of our Customer class. Type Customer in Generic parameters field. This enables direct access to the fields of the Customer entity in the dynamic parameters of this object.
- Type entity.enteredSystem = time(); in On exit. This code stores the time when a customer was generated in the Customers variable enteredSystem.
The time() function returns the current model time.
- Modify queue properties:
- Type Customer in Generic parameters field.
- Type entity.startWaiting = time(); in On enter'. This code stores the time when a customer started waiting in the queue in the Customers variable startWaiting.
- Type waitTimeDistr.add(time() - entity.startWaiting); in On exit. This code adds waiting time of the customer to the waitTimeDistr histogram data object.

- Modify sink properties:
- Type Customer in Generic parameters field
- Type timeInSystemDistr.add(time()-entity.enteredSystem); in On enter. This code adds the whole time the customer spent in the bank to the timeInSystemDistr histogram data object.


Run the model and view the statistics using inspect window of the data set. Open inspect window for data set by clicking on it. Here you can see standard statistical analysis on the data values being added to this data object.

Now we want to display the collected statistics using standard histograms.
![]() Add two histograms to display distributions of customer's waiting time and time in system
Add two histograms to display distributions of customer's waiting time and time in system
- To add histogram on the diagram, drag the Histogram element from the Analysis stencil of the Palette onto the class diagram where you want to place the histogram.
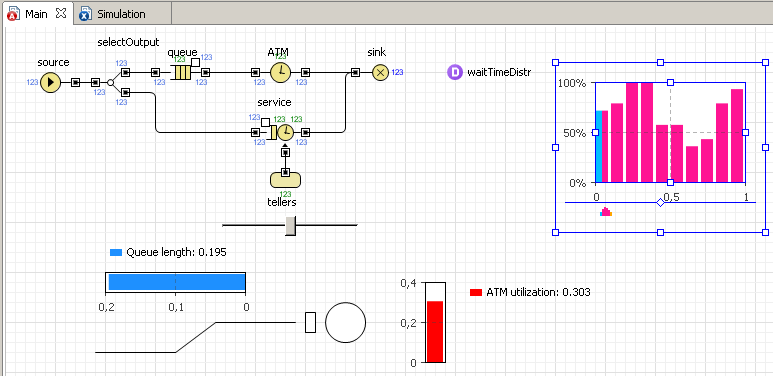
- Define the data object to be displayed by this histogram. Click the Add Histogram Data button and specify the Histogram to be displayed: waitTimeDistr.

- Add one more histogram below the existing one.
- Choose the data object to be displayed: timeInSystemDistr.
- Change the Title of the displayed data to Time in system distribution.


Run the model. Set virtual time mode and observe distribution of customer's time in system and waiting time.
