File:Butterworth phases 3.svg
Jump to navigation
Jump to search

Size of this PNG preview of this SVG file: 512 × 384 pixels. Other resolutions: 320 × 240 pixels | 640 × 480 pixels | 1,024 × 768 pixels | 1,280 × 960 pixels | 2,560 × 1,920 pixels.
Original file (SVG file, nominally 512 × 384 pixels, file size: 16 KB)
|
|
This is a file from the Wikimedia Commons |
Summary
| Description |
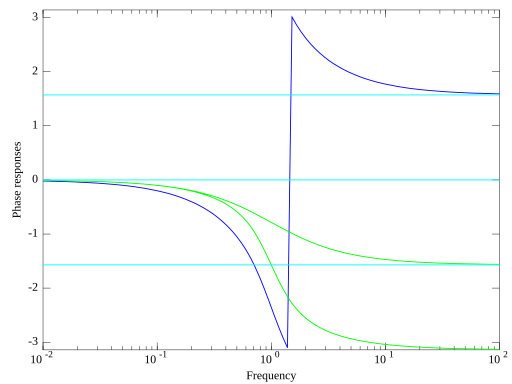
English: phase response of a 3rd order lowpass Butterworth filter |
| Date | |
| Source | Own work |
| Author | Fcorthay |
| SVG development | This vector image was created with Inkscape, or with something else. |
Source code
This graphics has been realized with the help of the following Octave script:
#-------------------------------------------------------------------------------
# Specifications
#
order = 3;
fc = 1;
pointNb = 100;
axesLength = 1.25;
textOffset = 0.05;
wLog = logspace(-2, 2, pointNb);
AdbMax = 10;
AdbMin = -60;

makeGraphics = 1;

figureIndex = 0;

#===============================================================================
# Butterworth filter
#
[zeroes, poles, gain] = butter(order, fc, 's');

[num, den] = butter(order, fc, 's');
while ( length(num) < length(den) )
  num = [0, num];
endwhile;

#-------------------------------------------------------------------------------
# Poles plot
#
figureIndex = figureIndex+1;
figure(figureIndex);
angle = linspace(pi/2, 3*pi/2, pointNb);
plot(cos(angle), sin(angle));

hold on;
plot([-axesLength, axesLength-1], [0, 0], 'k');
plot([0, 0], [-axesLength, axesLength], 'k');
plot(axesLength-1+textOffset*[0, 2, 0, 0], textOffset*3/4*[-1, 0, 1, -1], 'k');
plot(textOffset*3/4*[-1, 0, 1, -1], axesLength+textOffset*[0, 2, 0, 0], 'k');
plot(poles, 'xr');
hold off;

axis("equal", "off");
text(axesLength-1+textOffset, 1.5*textOffset, "re(s)");
text(textOffset, axesLength+1.5*textOffset, "im(s)");

for index = 1:order
  if imag(poles(index)) > 0
    text(real(poles(index))-textOffset, imag(poles(index))+textOffset, ...
    sprintf("p%i", index), "horizontalalignment", "right");
  elseif imag(poles(index)) == 0
    text(real(poles(index))-textOffset, imag(poles(index))+textOffset, ...
    "pr", "horizontalalignment", "right");
  endif
endfor

if (makeGraphics != 0)
  print -dsvg butterworth_poles_3.svg
endif

#-------------------------------------------------------------------------------
# Amplitude plot
#
Adb = 20*log10(abs(freqs(num, den, wLog)));

figureIndex = figureIndex+1;
figure(figureIndex);
semilogx(wLog, Adb);
hold on;
for index = 1:order
  if imag(poles(index)) > 0
    numP = [0, 0, 1];
    denP = [1, -2*real(poles(index)), abs(poles(index))^2];
    Adb = 20*log10(abs(freqs(numP, denP, wLog)));
    semilogx(wLog, Adb, 'g');
  elseif imag(poles(index)) == 0
    numP = [0, 1];
    denP = [1, -real(poles(index))];
    Adb = 20*log10(abs(freqs(numP, denP, wLog)));
    semilogx(wLog, Adb, 'g');
  endif
endfor
hold off;

axis([wLog(1), wLog(length(wLog)), AdbMin, AdbMax]);
xlabel('Frequency');
ylabel('Amplitude responses');
grid;

if (makeGraphics != 0)
  print -dsvg butterworth_amplitudes_3.svg
endif

#-------------------------------------------------------------------------------
# Phase plot
#
phase = arg(freqs(num, den, wLog));

figureIndex = figureIndex+1;
figure(figureIndex);
semilogx(wLog, phase);
hold on;
for index = 1:order
  if imag(poles(index)) > 0
    numP = [0, 0, 1];
    denP = [1, -2*real(poles(index)), abs(poles(index))^2];
    phase = arg(freqs(numP, denP, wLog));
    semilogx(wLog, phase, 'g');
  elseif imag(poles(index)) == 0
    numP = [0, 1];
    denP = [1, -real(poles(index))];
    phase = arg(freqs(numP, denP, wLog));
    semilogx(wLog, phase, 'g');
  endif
endfor
semilogx([wLog(1), wLog(length(wLog))], -pi/2*[1, 1], 'c');
semilogx([wLog(1), wLog(length(wLog))],   0  *[1, 1], 'c');
semilogx([wLog(1), wLog(length(wLog))],  pi/2*[1, 1], 'c');
hold off;

axis([wLog(1), wLog(length(wLog)), -pi, pi]);
xlabel('Frequency');
ylabel('Phase responses');

if (makeGraphics != 0)
  print -dsvg butterworth_phases_3.svg
endif
Licensing
I, the copyright holder of this work, hereby publish it under the following licenses:
This file is licensed under the Creative Commons Attribution-Share Alike 3.0 Unported license.
- You are free:
- to share – to copy, distribute and transmit the work
- to remix – to adapt the work
- Under the following conditions:
- attribution – You must give appropriate credit, provide a link to the license, and indicate if changes were made. You may do so in any reasonable manner, but not in any way that suggests the licensor endorses you or your use.
- share alike – If you remix, transform, or build upon the material, you must distribute your contributions under the same or compatible license as the original.

|
Permission is granted to copy, distribute and/or modify this document under the terms of the GNU Free Documentation License, Version 1.2 or any later version published by the Free Software Foundation; with no Invariant Sections, no Front-Cover Texts, and no Back-Cover Texts. A copy of the license is included in the section entitled GNU Free Documentation License. |
You may select the license of your choice.
File history
Click on a date/time to view the file as it appeared at that time.
| Date/Time | Thumbnail | Dimensions | User | Comment | |
|---|---|---|---|---|---|
| current | 15:08, 7 June 2012 | | 512 × 384 (16 KB) | Fcorthay | {{Information |Description ={{en|1=phase response of a 3rd order lowpass Butterworth filter}} |Source ={{own}} |Author =Fcorthay |Date =2012-06-07 |Permission = |other_versions = }} [[Category:Signal ... |
File usage
The following page uses this file: