File:Butterworth amplitudes 6.svg
Jump to navigation
Jump to search

Size of this PNG preview of this SVG file: 512 × 384 pixels. Other resolutions: 320 × 240 pixels | 640 × 480 pixels | 1,024 × 768 pixels | 1,280 × 960 pixels | 2,560 × 1,920 pixels.
Original file (SVG file, nominally 512 × 384 pixels, file size: 14 KB)
|
|
This is a file from the Wikimedia Commons |
Summary
| Description |
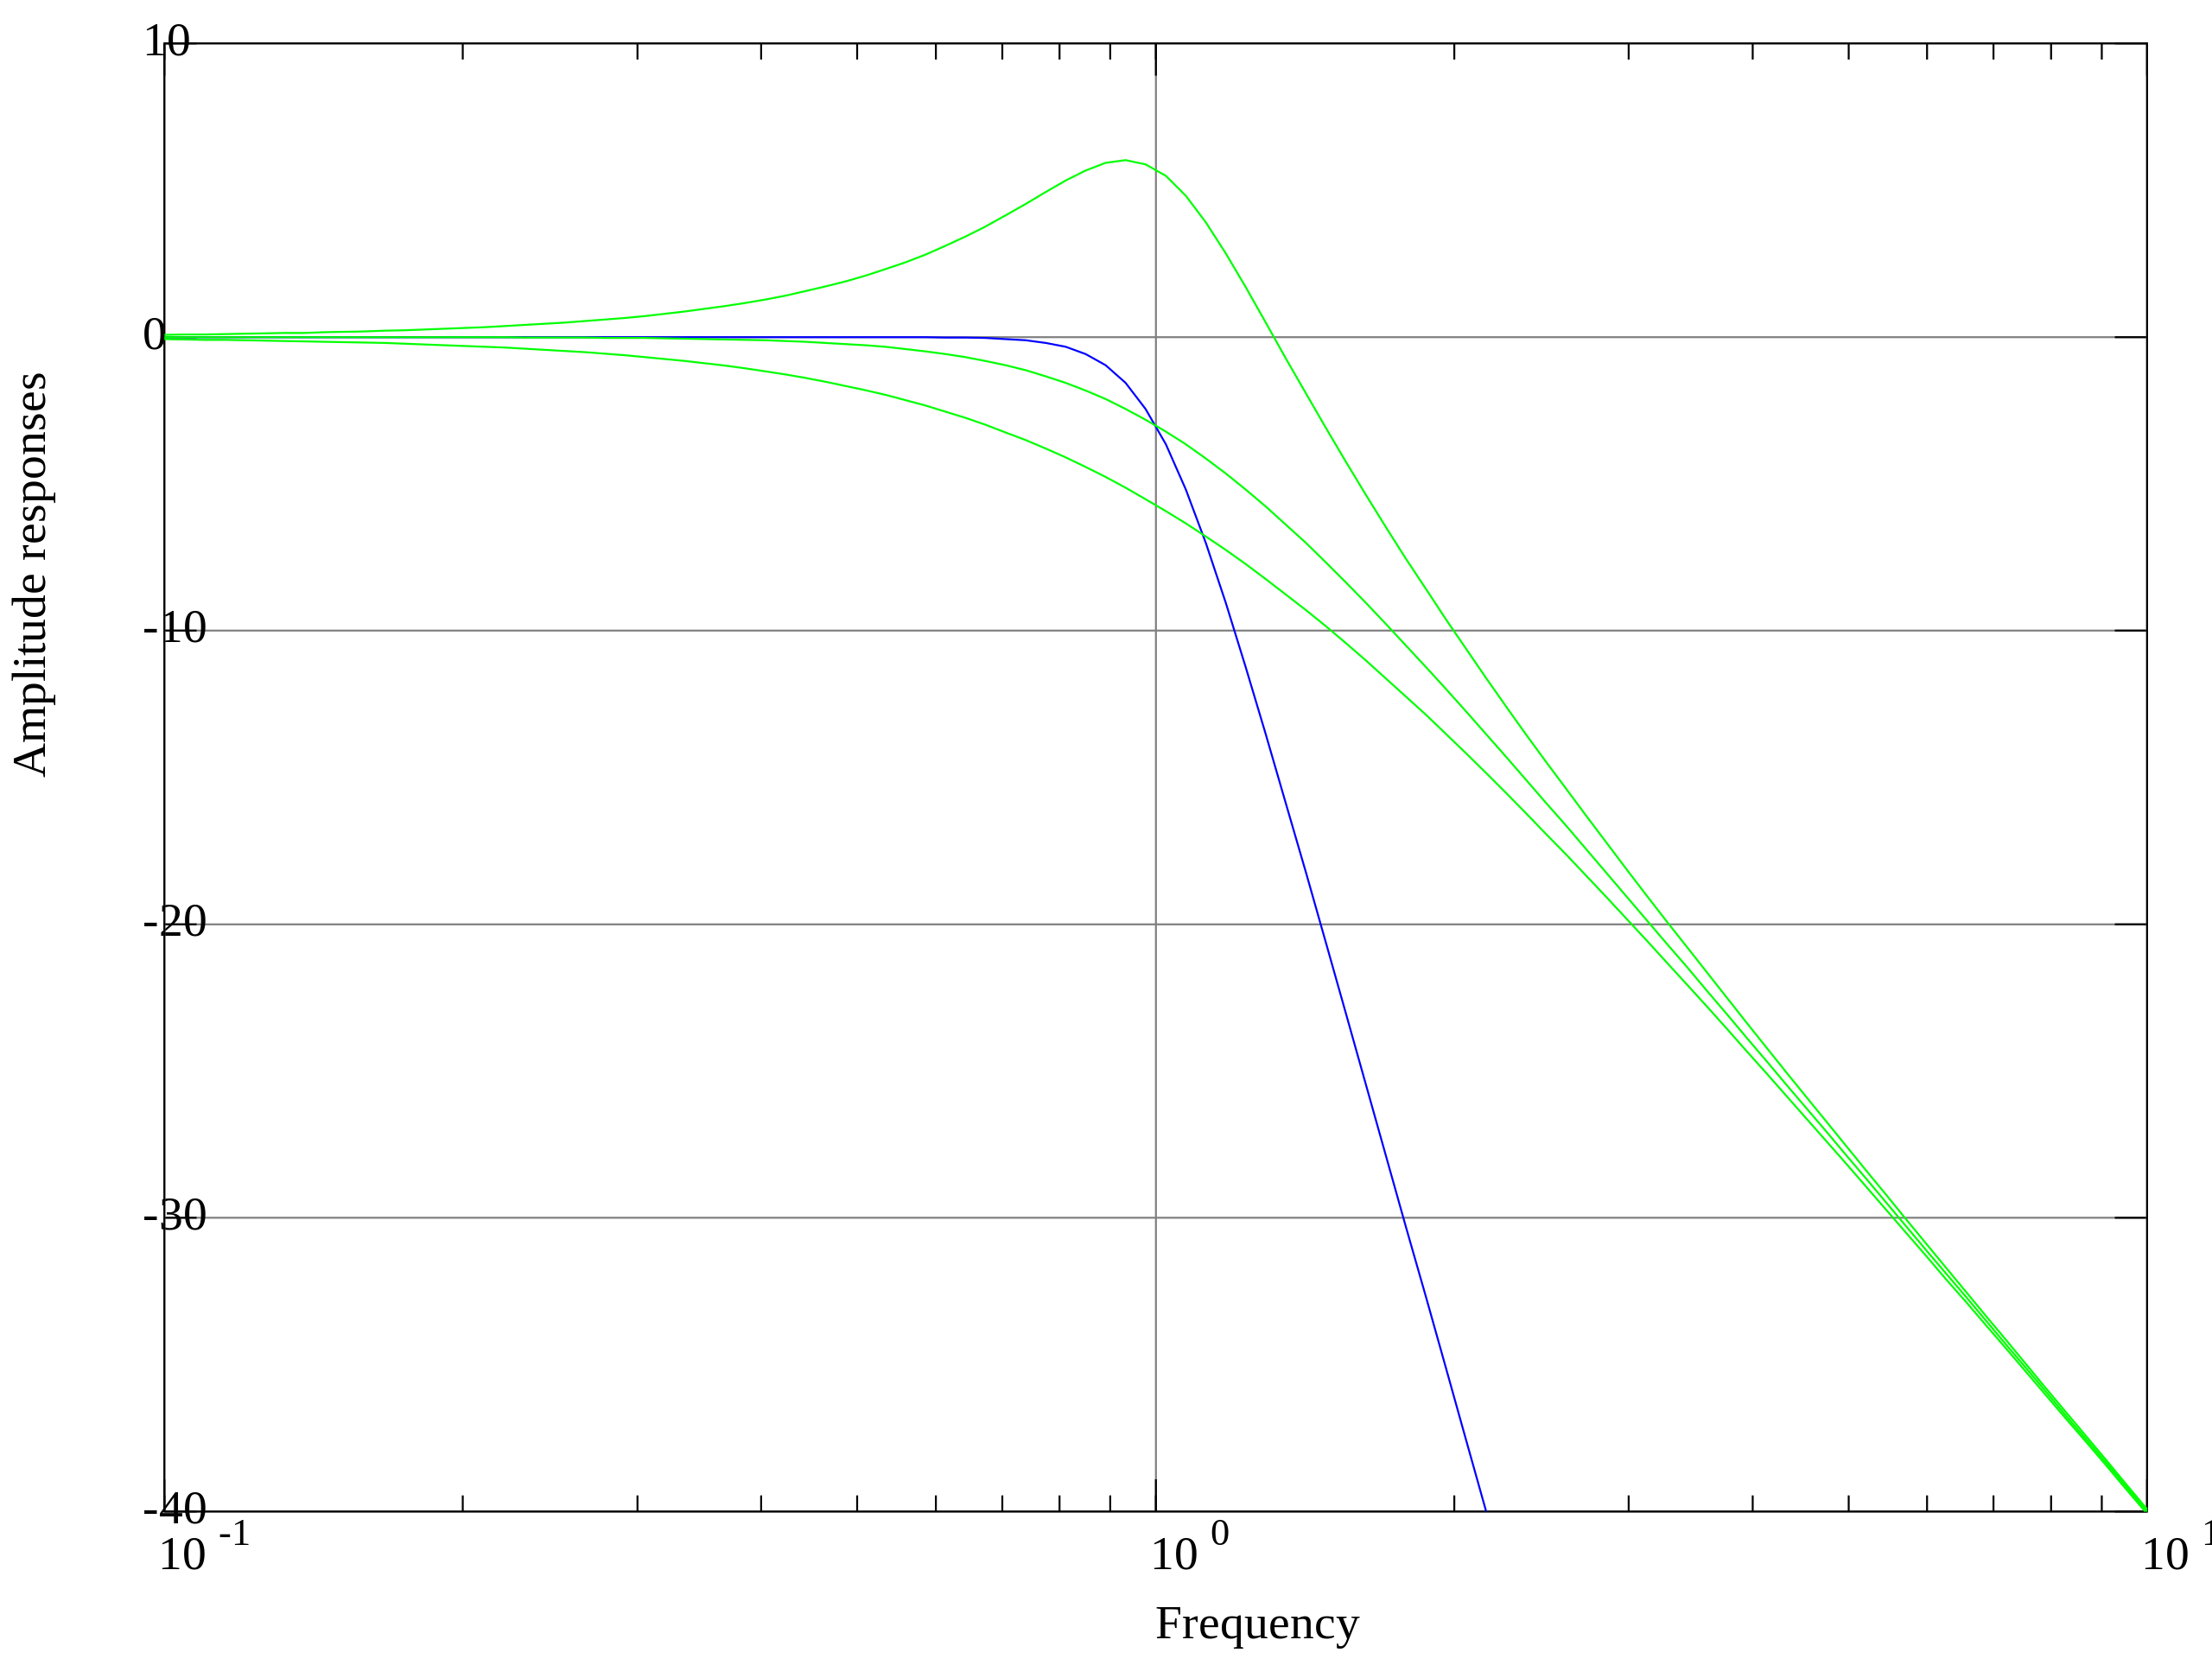
English: Amplitude response of a 6th order reference Butterwort filter, with the amplitudes of the internal second order sections |
| Date | |
| Source | Own work |
| Author | Fcorthay |
Source code
This graphics has been realized with the help of the following Octave script:
#-------------------------------------------------------------------------------
# Specifications
#
order = 6;
pointNb = 100;
axesLength = 1.25;
textOffset = 0.05;
wLog = logspace(-1, 1, pointNb);
AdbMax = 10;
AdbMin = -40;

#===============================================================================
# Butterworth filter
#
[zeroes, poles, gain] = butter(order, 1, 's');

[num, den] = butter(order, 1, 's');
while ( length(num) < length(den) )
  num = [0, num];
endwhile;

#-------------------------------------------------------------------------------
# Poles plot
#
figure(1);
angle = linspace(pi/2, 3*pi/2, pointNb);
plot(cos(angle), sin(angle));

hold on;
plot([-axesLength, axesLength-1], [0, 0], 'k');
plot([0, 0], [-axesLength, axesLength], 'k');
plot(axesLength-1+textOffset*[0, 2, 0, 0], textOffset*3/4*[-1, 0, 1, -1], 'k');
plot(textOffset*3/4*[-1, 0, 1, -1], axesLength+textOffset*[0, 2, 0, 0], 'k');
plot(poles, 'xr');
hold off;

axis("equal", "off");
text(axesLength-1+textOffset, 1.5*textOffset, "re(s)");
text(textOffset, axesLength+1.5*textOffset, "im(s)");

for index = 1:order
  if imag(poles(index)) > 0
    text(real(poles(index))-textOffset, imag(poles(index))+textOffset, ...
    sprintf("p%i", index), "horizontalalignment", "right");
  endif
endfor

#-------------------------------------------------------------------------------
# Normalized filter, transfer functions plot
#
Adb = 20*log10(abs(freqs(num, den, wLog)));

figure(2);
semilogx(wLog, Adb);
hold on;
for index = 1:order
  if imag(poles(index)) > 0
    num = [0, 0, 1];
    den = [1, -2*real(poles(index)), abs(poles(index))^2];
    Adb = 20*log10(abs(freqs(num, den, wLog)));
    semilogx(wLog, Adb, 'g');
  endif
endfor
hold off;

axis([wLog(1), wLog(length(wLog)), AdbMin, AdbMax]);
xlabel('Frequency');
ylabel('Amplitude responses');
grid;

print -dsvg butterworth_amplitudes_6.svg
Licensing
I, the copyright holder of this work, hereby publish it under the following license:
This file is licensed under the Creative Commons Attribution-Share Alike 3.0 Unported license.
- You are free:
- to share – to copy, distribute and transmit the work
- to remix – to adapt the work
- Under the following conditions:
- attribution – You must give appropriate credit, provide a link to the license, and indicate if changes were made. You may do so in any reasonable manner, but not in any way that suggests the licensor endorses you or your use.
- share alike – If you remix, transform, or build upon the material, you must distribute your contributions under the same or compatible license as the original.
File history
Click on a date/time to view the file as it appeared at that time.
| Date/Time | Thumbnail | Dimensions | User | Comment | |
|---|---|---|---|---|---|
| current | 14:39, 11 August 2011 | | 512 × 384 (14 KB) | Fcorthay |
File usage
The following page uses this file: