File:Atmospheric CO2 with glaciers cycles.png

Original file (939 × 680 pixels, file size: 41 KB, MIME type: image/png)
|
|
This is a file from the Wikimedia Commons |

|
This graph image could be re-created using vector graphics as an SVG file. This has several advantages; see Commons:Media for cleanup for more information. If an SVG form of this image is available, please upload it and afterwards replace this template with
{{vector version available|new image name}}.
It is recommended to name the SVG file “Atmospheric CO2 with glaciers cycles.svg”—then the template Vector version available (or Vva) does not need the new image name parameter. |
Summary
| Description |
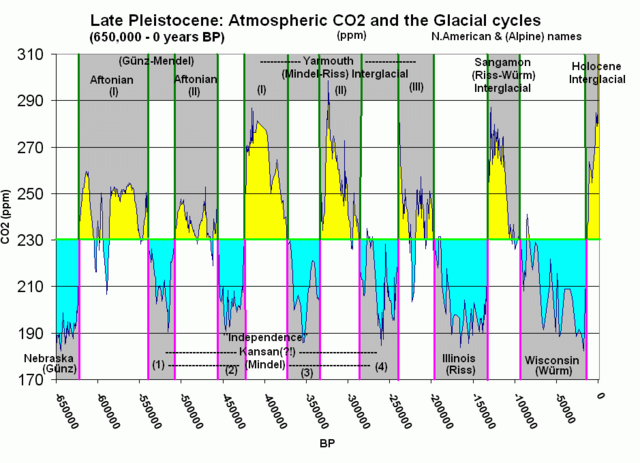
Ice Core data for Atmospheric CO2 related to the glacial cycles |
| Date | |
| Source |
Source data: (Combined)
|
| Author | Tom Ruen en:User:Tomruen |
| Permission (Reusing this file) |
PD-self |
Licensing
| I, the copyright holder of this work, release this work into the public domain. This applies worldwide. In some countries this may not be legally possible; if so: I grant anyone the right to use this work for any purpose, without any conditions, unless such conditions are required by law. |
Upload foo
This image was copied from en:Image:Atmospheric_CO2_with_glaciers_cycles.gif. Below is the original description.
Original edit-history of the image
- 15:25, 3 December 2005 en:User:Tomruen m
- 15:13, 3 December 2005 en:User:Tomruen (link source of data)
- 14:38, 3 December 2005 en:User:Tomruen
Original upload log
| Date/Time | Dimensions | User | Comment |
|---|---|---|---|
| 6 May 2006, 14:20:43 | 939 × 680 (49916 bytes) | Neumeier (talk · contribs) | {{Information| |Description=Ice Core data for Atmospheric CO2 related to the glacial cycles |Source=copied from [[:en:Image:Atmospheric_CO2_with_glaciers_cycles.gif]] |Date=3 December 2005 |Author=en:User:Tomruen |Permission=PD-self |other_versions= }} ' |
File history
Click on a date/time to view the file as it appeared at that time.
| Date/Time | Thumbnail | Dimensions | User | Comment | |
|---|---|---|---|---|---|
| current | 15:58, 18 August 2014 | | 939 × 680 (41 KB) | GifTagger | Bot: Converting file to superior PNG file. (Source: Atmospheric_CO2_with_glaciers_cycles.gif). This GIF was problematic due to non-greyscale color table. |
File usage
The following page uses this file:
Global file usage
The following other wikis use this file:
- Usage on als.wikipedia.org
- Usage on de.wikipedia.org
- Usage on de.wiktionary.org
- Usage on en.wikipedia.org
- Usage on es.wikipedia.org
- Usage on fr.wikipedia.org
- Usage on hu.wikipedia.org
- Usage on it.wikipedia.org
- Usage on ka.wikipedia.org
- Usage on nl.wikipedia.org
- Usage on no.wikipedia.org
- Usage on vi.wikipedia.org
- Usage on zh.wikipedia.org