File:Ap biology scienceofbiology01.jpg
Ap_biology_scienceofbiology01.jpg (400 × 400 pixels, file size: 67 KB, MIME type: image/jpeg)
|
|
This is a file from the Wikimedia Commons |
Summary
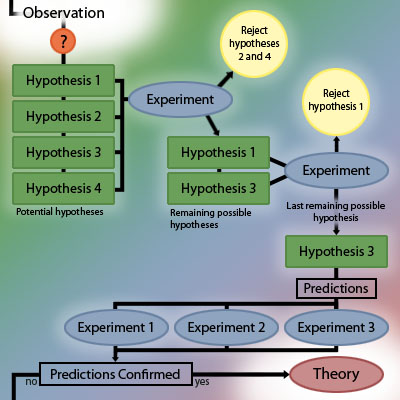
How Science is Done - A diagram that illustrates scientific investigation Scientists first make observations that raise a particular question. In order to explain the observed phenomenon, they develop a number of possible explanations, or hypotheses. This is the inductive part of science, observing and constructing plausible arguments for why an event occurred. Experiments are then used to eliminate one of more of the possible hypotheses until there one hypothesis remains. Using deduction, scientists use the principles of their hypothesis to make predictions, and then test to make sure that their predictions are confirmed. After many trials (repeatability) and all predictions have been confirmed, the hypothesis then may become a theory. Public domain This image has been released into the public domain by the copyright holder, its copyright has expired, or it is ineligible for copyright. This applies worldwide. File history
Legend: (cur) = this is the current file, (del) = delete this old version, (rev) = revert to this old version. Click on date to see the file uploaded on that date.
* (del) (cur) 21:56, 14 May 2005 . . Cnelson (Talk | contribs) . . 400×400 (69,034 bytes) (How Science is Done - A diagram that illustrates scientific investigation/small>)
* Edit this file using an external application
See the setup instructions for more information.
Links
The following pages link to this file:
   * General Biology/Getting Started/Introduction
   * AP Biology/The Science of Biology
   * AP Biology/Diagrams
Metadata
This file contains additional information, probably added from the digital camera or scanner used to create or digitize it. If the file has been modified from its original state, some details may not fully reflect the modified image. Orientation Normal Horizontal resolution 63 dpi Vertical resolution 63 dpi Software used Adobe Photoshop CS Windows File change date and time 16:52, 14 May 2005 Color space sRGB Hide extended details
Licensing
| This file is licensed under the Creative Commons Attribution-Share Alike 3.0 Unported license. Subject to disclaimers. | ||
| ||
| This licensing tag was added to this file as part of the GFDL licensing update. |

|
Permission is granted to copy, distribute and/or modify this document under the terms of the GNU Free Documentation License, Version 1.2 or any later version published by the Free Software Foundation; with no Invariant Sections, no Front-Cover Texts, and no Back-Cover Texts. A copy of the license is included in the section entitled GNU Free Documentation License. Subject to disclaimers. |
File history
Click on a date/time to view the file as it appeared at that time.
| Date/Time | Thumbnail | Dimensions | User | Comment | |
|---|---|---|---|---|---|
| current | 08:53, 27 February 2007 | | 400 × 400 (67 KB) | Susi | How Science is Done - A diagram that illustrates scientific investigation Scientists first make observations that raise a particular question. In order to explain the observed phenomenon, they develop a number of possible explanations, or hypotheses. This |
File usage
The following 4 pages use this file: