Color Theory/Color gradient
| A Wikibookian believes this page should be split into smaller pages with a narrower subtopic. You can help by splitting this big page into smaller ones. Please make sure to follow the naming policy. Dividing books into smaller sections can provide more focus and allow each one to do one thing well, which benefits everyone. |
Theory[edit | edit source]

Introduction[edit | edit source]
- Your Friendly Guide to Colors in Data Visualisation by Lisa Charlotte Rost
- Playing with Gradient by rockraikar
- gimp concepts : gradients
- Ultra Fractal Gradient Hints by Janet Parke
- Image gradient at wikipedia
- Color gradient at wikipedia
- w3schools : css3 gradients
- gradients by Alan Gibson
- domain coloring
- DomainColoring by Emilia Petrisor
- dynamicmath : domain-coloring
- dctools by Juan Carlos Ponce Campuzano
- domain_coloring ( gnuplot)
Types of color gradient[edit | edit source]
Color gradients can be named by :
- dimension
- color bit depth
- color model: hsv[1]
- number of segments of gradient
- function used to create gradient
- special input values ( NAN, no data, high or low out-of-range values)[2][3]
- Number of colors
- number type, range and precision
- perceptual uniformity[4]
- monotonic
- Monotonic in hue
- Monotonic in saturation
- Monotonic in luminance
Dimension[edit | edit source]
1D[edit | edit source]
Here color of pixel is proportional to 1D variable. For example in 2D space ( complex plane where point z = x+y*i) :
- position with respect to x-axis of Cartesian coordinate system : x
- distance to origin : r=abs(z)
- potential[5]
- complex angle angle=arg(z)
- percepually uniform[6]
An example of a function to return a color that is linearly between two given colors:
colorA = [0, 0, 255] # blue
colorB = [255, 0, 0] # red
function get_gradient_color(val):
# 'val' must be between 0 and 1
for i in [1,2,3]:
color[i] = colorA[i] + val * (colorB[i] - colorA[i])
return color
-
 1D gradient with color proportional to x
 -
 1D gradient with color proportional to radius
 -
 1D gradient with color proportional to angle
 -
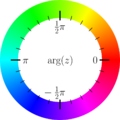 Hue circle for complex function plots


Code
- continous gradient
2D[edit | edit source]


ƒ(x) =(x2 − 1)(x − 2 − i)2/(x2 + 2 + 2i). The hue represents the function argument, while the saturation represents the magnitude.
Because color can be treated as more than 1D value it is used to represent more than one ( real or 1D) variable. For example :
- Robert Munafo uses 2 values from HSV model of color [7][8][9]
- John J. G. Savard uses own function [10][11]
- Domain coloring is a technique for visualizing functions of a complex variable
- matrixlab : rgb-images in MAtlab
- animated-contours from d3js.org
- Multiwave coloring for Mandelbrot by Paul Derbyshire
- 2D colormap by Gerrit[12]:
- The angle of the final iterate is most naturally mapped to hue, which has the matching topology of a circle
- the number of iterations is mapped to saturation and value (colorspace is 3D, at least for most humans).
' panomand/src/dll/fbmandel.bas
' https://www.unilim.fr/pages_perso/jean.debord/panoramic/mandel/panoramic_mandel.htm
' PANOMAND is an open source software for plotting Mandelbrot and Julia sets. It is written in two BASIC dialects: PANORAMIC and FreeBASIC
' by Jean Debord
' a simplified version of R Munafo's algorithm
' Color is defined in HSV space, according to Robert Munafo
' (http://mrob.com/pub/muency/color.html): the value V is
' computed from the distance estimator, while the hue H and
' saturation S are computed from the iteration number.

function MdbCol(byval Iter as integer, _
                byval mz   as double, _
                byref dz   as Complex) as integer
' Computes the color of a point
' Iter = iteration count
' mz   = modulus of z at iteration Iter
' dz   = derivative at iteration Iter

  if Iter = Max_Iter then return &HFFFFFF

  dim as double  lmz, mdz, Dist, Dwell, DScale, Angle, Radius, Q, H, S, V
  dim as integer R, G, B

  lmz = log(mz)
  mdz = CAbs(dz)

  ' Determine Value (luminosity) from Distance Estimator

  V = 1

  if mdz > 0 then
    Dist = pp * mz * lmz / mdz
    DScale = log(Dist / ScaleFact) / Lnp + Dist_Fact
    if DScale < -8 then
      V = 0
    elseif DScale < 0 then
      V = 1 + DScale / 8
    end if
  end if

  ' Determine Hue and Saturation from Continuous Dwell

  Dwell = Iter - log(lmz) / Lnp + LLE
  Q = log(abs(Dwell)) * AbsColor

  if Q < 0.5 then
    Q = 1 - 1.5 * Q
    Angle = 1 - Q
  else
    Q = 1.5 * Q - 0.5
    Angle = Q
  end if

  Radius = sqr(Q)

  if (Iter mod 2 = 1) and (Color_Fact > 0) then
    V = 0.85 * V
    Radius = 0.667 * Radius
  end if

  H = frac(Angle * 10)
  S = frac(Radius)

  HSVtoRGB H * 360, S, V, R, G, B
  return rgb(R, G, B)

end function
3D[edit | edit source]
- Hans Lundmark page[13]
Color model[edit | edit source]
The quality of 16-bit linear RGB is about equal to 12-bit sRGB (= nonlinear RGB), beacause linear color results in disproportionately more samples near white and fewer near black.
-
 RGB and RGBA image

Types :
- RGB is for the display
- CMYK is for printing
- other ( HSV, HSL, ...) are for choosing color, processing
RGB[edit | edit source]
- RGB = "linear" color space
- sRGB
- sRGB = standard RGB. SRGBColorSpace (“srgb”) refers to the color space defined by the Rec. 709 primaries, D65 white point, and nonlinear sRGB transfer functions.
- The sRGB Linear space is the same as sRGB except that the transfer function is linear-light (there is no gamma-encoding
HSV[edit | edit source]
#include <stdio.h>
#include <stdlib.h>
#include <math.h>
#include <complex.h> // http://pubs.opengroup.org/onlinepubs/009604499/basedefs/complex.h.html

/*
based on
c++ program from :
http://commons.wikimedia.org/wiki/File:Color_complex_plot.jpg
by  	Claudio Rocchini

gcc d.c -lm -Wall

http://en.wikipedia.org/wiki/Domain_coloring

*/

const double PI = 3.1415926535897932384626433832795;
const double E  = 2.7182818284590452353602874713527;

/*

complex domain coloring
Given a complex number z=re^{ i \theta},

hue represents the argument ( phase, theta ),

sat and value represents the modulus

*/
int GiveHSV( double complex z, double HSVcolor[3] )
{
 //The HSV, or HSB, model describes colors in terms of hue, saturation, and value (brightness).

 // hue = f(argument(z))
 //hue values range from .. to ..
 double a = carg(z); //
 while(a<0) a += 2*PI; a /= 2*PI;

 // radius of z
 double m = cabs(z); //
 double ranges = 0;
 double rangee = 1;
 while(m>rangee){
   ranges = rangee;
   rangee *= E;
      }
 double k = (m-ranges)/(rangee-ranges);

 // saturation = g(abs(z))
 double sat = k<0.5 ? k*2: 1 - (k-0.5)*2;
 sat = 1 - pow( (1-sat), 3);
 sat = 0.4 + sat*0.6;

 // value = h(abs(z))
 double val = k<0.5 ? k*2: 1 - (k-0.5)*2;
   val = 1 - val;
   val = 1 - pow( (1-val), 3);
   val = 0.6 + val*0.4;

 HSVcolor[0]= a;
 HSVcolor[1]= sat;
 HSVcolor[2]= val;
return 0;
}


int GiveRGBfromHSV( double HSVcolor[3], unsigned char RGBcolor[3] ) {
        double r,g,b;
        double h; double s; double v;
        h=HSVcolor[0]; // hue
        s=HSVcolor[1]; //  saturation;
        v = HSVcolor[2]; // = value;

        if(s==0)
                r = g = b = v;
        else {
                if(h==1) h = 0;
                double z = floor(h*6);
                int i = (int)z;
                double f = (h*6 - z);
                double p = v*(1-s);
                double q = v*(1-s*f);
                double t = v*(1-s*(1-f));
                switch(i){
                        case 0: r=v; g=t; b=p; break;
                        case 1: r=q; g=v; b=p; break;
                        case 2: r=p; g=v; b=t; break;
                        case 3: r=p; g=q; b=v; break;
                        case 4: r=t; g=p; b=v; break;
                        case 5: r=v; g=p; b=q; break;
                }
        }
        int c;
        c = (int)(256*r); if(c>255) c = 255; RGBcolor[0] = c;
        c = (int)(256*g); if(c>255) c = 255; RGBcolor[1] = c;
        c = (int)(256*b); if(c>255) c = 255; RGBcolor[2] = c;
  return 0;
}

int GiveRGBColor( double complex z, unsigned char RGBcolor[3])
{
  static double HSVcolor[3];
  GiveHSV( z, HSVcolor );
  GiveRGBfromHSV(HSVcolor,RGBcolor);
  return 0;
}

//
double complex fun(double complex c ){
  return (cpow(c,2)-1)*cpow(c-2.0- I,2)/(cpow(c,2)+2+2*I);} //

int main(){
        // screen (integer ) coordinate
        const int dimx = 800; const int dimy = 800;
        // world ( double) coordinate
        const double reMin = -2; const double reMax =  2;
        const double imMin = -2; const double imMax =  2;
        //
        double stepX=(imMax-imMin)/(dimy-1);
        double stepY=(reMax-reMin)/(dimx-1);

        static unsigned char RGBcolor[3];
        FILE * fp;
        char *filename ="complex.ppm";
        fp = fopen(filename,"wb");
        fprintf(fp,"P6\n%d %d\n255\n",dimx,dimy);

        int i,j;
        for(j=0;j<dimy;++j){
                double im = imMax - j*stepX;
                for(i=0;i<dimx;++i){
                        double re = reMax - i*stepY;
                        double complex z= re + im*I; //
                        double complex v = fun(z); //
                        GiveRGBColor( v, RGBcolor);

                        fwrite(RGBcolor,1,3,fp);
                }
        }
        fclose(fp);
        printf("OK - file %s saved\n", filename);

        return 0;
}
In Basic :
' /panomand/src/dll/hsvtorgb.bas
' https://www.unilim.fr/pages_perso/jean.debord/panoramic/mandel/panoramic_mandel.htm
' PANOMAND is an open source software for plotting Mandelbrot and Julia sets. It is written in two BASIC dialects: PANORAMIC and FreeBASIC
' by Jean Debord
sub HSVtoRGB(byref H as double,  _
             byref S as double,  _
             byref V as double,  _
             byref R as integer, _
             byref G as integer, _
             byref B as integer)

' Convert RGB to HSV
' Adapted from http://www.cs.rit.edu/~ncs/color/t_convert.html
' R, G, B values are from 0 to 255
' H = [0..360], S = [0..1], V = [0..1]
' if S = 0, then H = -1 (undefined)

  if S = 0 then  ' achromatic (grey)
    R = V * 255
    G = R
    B = R
    exit sub
  end if

  dim as integer I
  dim as double  Z, F, P, Q, T
  dim as double  RR, GG, BB

  Z = H / 60     ' sector 0 to 5
  I = int(Z)
  F = frac(Z)
  P = V * (1 - S)
  Q = V * (1 - S * F)
  T = V * (1 - S * (1 - F))

  select case I
    case 0
      RR = V
      GG = T
      BB = P
    case 1
      RR = Q
      GG = V
      BB = P
    case 2
      RR = P
      GG = V
      BB = T
    case 3
      RR = P
      GG = Q
      BB = V
    case 4
      RR = T
      GG = P
      BB = V
    case 5
      RR = V
      GG = P
      BB = Q
  end select

  R = RR * 255
  G = GG * 255
  B = BB * 255
end sub
Interpolating function[edit | edit source]
- One can use any function in each segment of gradient
- Output of function is scaled to range of color component
- interpolation between colors can be:
- lerp = Linear intERPolation, in sRGB color space
- nonlinear (quadratic, ...) classic in Photoshop[15]
- linear color space interpolation: convert keys from sRGB to float Linear, lerp between them, convert back into fixed point sRGB
- perceptual color space interpolation ( OKlab): convert keys from sRGB to float Linear, then into Oklab, lerp between them, convert back into float Linear, then back into fixed point sRGB.[16]
the tail of gradient Oklab evaluation function code by Aras Pranckevičius:
// to-Linear -> to-Oklab -> lerp -> to-Linear -> to-sRGB
float3 ca = pix_to_float(m_Keys[idx]);
float3 cb = pix_to_float(m_Keys[idx+1]);
ca = sRGB_to_Linear(ca);
cb = sRGB_to_Linear(cb);
ca = Linear_sRGB_to_OkLab_Ref(ca);
cb = Linear_sRGB_to_OkLab_Ref(cb);
float3 c = lerp(ca, cb, a);
c = OkLab_to_Linear_sRGB_Ref(c);
c = Linear_to_sRGB(c);
return float_to_pix(c);
In CSS interpolation between two color values takes place by executing the following steps:[17]
- (if required) converting them to a given color space which will be referred to as the interpolation color space below
- (if required) re-inserting carried-forward values in the converted colors
- (if required) fixing up the hues, depending on the selected <hue-interpolation-method>
- premultiplication of the color components
- linearly interpolating each component of the computed value of the color separately
- undoing premultiplication
Example 36. To interpolate:[18]
- in the Lab color space
- the two colors: rgb(76% 62% 03%/0.4) and color(display-p3 0.84 0.19 0.72/0.6)
- they are first converted to lab: lab(66.927% 4.873 68.622/0.4) lab(53.503% 82.672 -33.901/0.6)
- premultiplication: then the L, a and b coordinates are premultiplied before interpolation: [26.771% 1.949 27.449] and [32.102% 49.603 -20.341].
- Interpolation: The midpoint of linearly interpolating these would be [29.4365% 25.776 3.554] which,
- premultiplication is undone: with an alpha value of 0.5, which gives lab(58.873% 51.552 7.108) / 0.5)
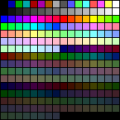
Number of colors[edit | edit source]
Number of color is determined by color depth : from 2 colors to 16 mln of colors.
-
 6-bit RGB uniform palette with black borders
 -
 Image:6-bit RGB uniform palette
 -
 256 VGA color gradient


See also
- 16-bit (rgb-565) color name definitions in c by Nic Newdigate
- About RGB565 and how to convert into it November 14, 2018 by Thomas Barth
Repetition and offset[edit | edit source]
Direct repetition :
Color is proportional to position <0;1> of color in color gradient. if position > 1 then we have repetition of colors. it maybe useful
Mirror repetition :
"colorCycleMirror - This will reflect the colour gradient so that it cycles smoothly " [19]
Offset :
How to use color gradients in computer programs[edit | edit source]

First find what format of color you need in your program.[20][21]
Ways of making gradient :
- gradient functions
- gradient files
"Lookup tables (LUTs) are an excellent technique for optimizing the evaluation of functions that are expensive to compute and inexpensive to cache. ... For data requests that fall between the table's samples, an interpolation algorithm can generate reasonable approximations by averaging nearby samples."[26]
CLUT image[edit | edit source]
One can use CLUT image a a source of the gradient[27][28]
convert input.pgm -level 0,65532 clut.ppm -interpolate integer -clut -depth 8 output.png
CLUT Array[edit | edit source]
python[edit | edit source]
# http://jtauber.com/blog/2008/05/18/creating_gradients_programmatically_in_python/
# Creating Gradients Programmatically in Python by James Tauber

import sys

def write_png(filename, width, height, rgb_func):

    import zlib
    import struct
    import array

    def output_chunk(out, chunk_type, data):
        out.write(struct.pack("!I", len(data)))
        out.write(chunk_type)
        out.write(data)
        checksum = zlib.crc32(data, zlib.crc32(chunk_type))
        out.write(struct.pack("!I", checksum))

    def get_data(width, height, rgb_func):
        fw = float(width)
        fh = float(height)
        compressor = zlib.compressobj()
        data = array.array("B")
        for y in range(height):
            data.append(0)
            fy = float(y)
            for x in range(width):
                fx = float(x)
                data.extend([int(v * 255) for v in rgb_func(fx / fw, fy / fh)])
        compressed = compressor.compress(data.tostring())
        flushed = compressor.flush()
        return compressed + flushed

    out = open(filename, "w")
    out.write(struct.pack("8B", 137, 80, 78, 71, 13, 10, 26, 10))
    output_chunk(out, "IHDR", struct.pack("!2I5B", width, height, 8, 2, 0, 0, 0))
    output_chunk(out, "IDAT", get_data(width, height, rgb_func))
    output_chunk(out, "IEND", "")
    out.close()

def linear_gradient(start_value, stop_value, start_offset=0.0, stop_offset=1.0):
    return lambda offset: (start_value + ((offset - start_offset) / (stop_offset - start_offset) * (stop_value - start_value))) / 255.0

def gradient(DATA):
    def gradient_function(x, y):
        initial_offset = 0.0
        for offset, start, end in DATA:
            if y < offset:
                r = linear_gradient(start[0], end[0], initial_offset, offset)(y)
                g = linear_gradient(start[1], end[1], initial_offset, offset)(y)
                b = linear_gradient(start[2], end[2], initial_offset, offset)(y)
                return r, g, b
            initial_offset = offset
    return gradient_function

## EXAMPLES

# normally you would make these with width=1 but below I've made them 50
# so you can more easily see the result

# body background from jtauber.com and quisition.com
write_png("test1.png", 50, 143, gradient([
    (1.0, (0xA1, 0xA1, 0xA1), (0xDF, 0xDF, 0xDF)),
]))

# header background similar to that on jtauber.com
write_png("test2.png", 50, 90, gradient([
    (0.43, (0xBF, 0x94, 0xC0), (0x4C, 0x26, 0x4C)), # top
    (0.85, (0x4C, 0x26, 0x4C), (0x27, 0x13, 0x27)), # bottom
    (1.0,  (0x66, 0x66, 0x66), (0xFF, 0xFF, 0xFF)), # shadow
]))

# header background from pinax
write_png("test3.png", 50, 80, gradient([
    (0.72, (0x00, 0x26, 0x4D), (0x00, 0x40, 0x80)),
    (1.0,  (0x00, 0x40, 0x80), (0x00, 0x6C, 0xCF)), # glow
]))

# form input background from pinax
write_png("test4.png", 50, 25, gradient([
    (0.33, (0xDD, 0xDD, 0xDD), (0xF3, 0xF3, 0xF3)), # top-shadow
    (1.0,  (0xF3, 0xF3, 0xF3), (0xF3, 0xF3, 0xF3)),
]))
perl[edit | edit source]
# Perl code
# http://www.angelfire.com/d20/roll_d3_for_this/mandel-highorder/mandel-high.pl
# from perl High-order Mandelbrot program.
# Written by Christopher Thomas.
# Picture palette info.

my ($palsize);
my (@palette);

if(0)
{
# Light/dark colour banded palette.
# NOTE: This looks ugly, probably because the dark colours look muddy.
$palsize = 16;
@palette =
  ( "  255   0   0", "    0 112 112", "  255 128   0", "    0   0 128",
    "  224 224   0", "   64   0  96", "    0 255   0", "   96   0  64",
    "    0 224 224", "  128   0   0", "    0   0 255", "  128  64   0",
    "  128   0 192", "  112 112   0", "  192   0 128", "    0 128   0" );
}
else
{
# 8-colour rainbow palette.
$palsize = 8;
@palette =
  ( "  255   0   0", "  255 128   0",
    "  224 224   0", "    0 255   0",
    "    0 224 224", "    0   0 255",
    "  128   0 192", "  192   0 128" );
}
Conversions :
- between FractInt and Fractal eXtreme palettes [29]
lists:
Gradient functions[edit | edit source]
Name:
- coloring function
types

Examples :
- in JS using mandel.js[35] by Christopher Williams[36]
- Javascript using jQuery [37]
- C++ function by Richel Bilderbeek [38]
- Multiwave coloring for Mandelbrot[39]
- histogram colouring [40]
- Dave Green's `cubehelix' colour scheme
- css gradients
- stackoverflow question: how-to-create-colour-gradient-in-python
- complex_plot from Arb library and description
glsl[edit | edit source]
// https://www.shadertoy.com/view/lsd3zN
// sRGB demo by Tom Forsyth
// https://medium.com/@tomforsyth/the-srgb-learning-curve-773b7f68cf7a
//////////////////////////////////////////////////////////
//
// Illustration of the precision distribution of linear
// and sRGB formats.
//
// A ramp of 64 shades of each colour is shown to
// emphasise the distribution of banding in each format.
// Real formats of course have 256 shades.
//
// The leftmost bar of each colour is a linear format
// As you can see, although this format is linear in
// "photons per second", the difference in shades between
// the darker bands is far more obvious to the eye than
// the difference between the brighter bands. Thus,
// although linear space is a good place to do maths,
// when stored in a buffer the distribution of precision
// is poorly matched to the eye's preception of brightness.
//
// The middle bar of each colour is an sRGB format.
// While this is a strange non-linear format, and doing
// maths in it is not a good idea, it is an excellent
// format for storing "picturelike" data. You can see
// that the change in perceived brightness between adjacent
// bands is very uniform across the entire range of
// brightnesses, meaning that it has a distribution of
// precision that matches the eye's perception very well.
//
// The rightmost bar of each colour is a gamma 2.2 bar.
// This is not directly supported by hardware, and is there
// to illustrate that although it is quite similar to sRGB,
// there are significant differences between them, and
// care must be taken if trying to approximate one with
// the other. In general, it's not worth the very small
// performance difference.
//
//////////////////////////////////////////////////////////


// Taken from D3DX_DXGIFormatConvert.inl
float D3DX_FLOAT_to_SRGB ( float val )
{
	if( val < 0.0031308 )
		val *= 12.92;
	else
		val = 1.055 * pow(val,1.0/2.4) - 0.055;
	return val;
}

// Taken from D3DX_DXGIFormatConvert.inl
// Technically this is not bit-exact - that requires a look-up table,
// but it's accurate enough for our purposes here.
float D3DX_SRGB_to_FLOAT(float val)
{
    if( val < 0.04045 )
        val /= 12.92;
    else
        val = pow((val + 0.055)/1.055,2.4);
    return val;
}

void mainImage( out vec4 fragColor, in vec2 fragCoord )
{
	vec2 uv = fragCoord.xy / iResolution.xy;

    float yShade = uv.y;

    int colCol = int(floor(uv.x*4.0));
	float fraction = uv.x*4.0 - float(colCol);
    int colRamp = int(floor(fraction * 3.1));

    // Make the basic colour.
    vec3 baseCol;
    if ( colCol == 0 )
    {
        baseCol = vec3(yShade,yShade,yShade); // white
    }
    else if ( colCol == 1 )
    {
        baseCol = vec3(yShade*0.6,yShade,0.0); // light green
    }
    else if ( colCol == 2 )
    {
        baseCol = vec3(yShade,yShade*0.5,yShade*0.2); // bronzeish
    }
    else
    {
        baseCol = vec3(yShade*0.5,0.0,yShade); // purple
    }


    // Artificially quantise to emphasise precision distribution
    float shadeSteps = 64.0;
    baseCol = (1.0/shadeSteps) * floor ( baseCol * shadeSteps );

    // Now interpret that value as if it was a value stored in a texture of various formats.

    vec3 linearCol;
    if ( colRamp == 0 )
    {
        // Linear texture
        linearCol = baseCol;
    }
    else if ( colRamp == 1 )
    {
        // sRGB texture
        linearCol.x = D3DX_SRGB_to_FLOAT ( baseCol.x );
        linearCol.y = D3DX_SRGB_to_FLOAT ( baseCol.y );
        linearCol.z = D3DX_SRGB_to_FLOAT ( baseCol.z );
    }
    else if ( colRamp == 2 )
    {
        // 2.2 gamma for illustration
        linearCol.x = pow ( baseCol.x, 2.2 );
        linearCol.y = pow ( baseCol.y, 2.2 );
        linearCol.z = pow ( baseCol.z, 2.2 );
    }
    else
    {
        // Separator.
        linearCol = vec3(0.0,0.0,0.0);
    }


    // But then assume the display we're outputting to is gamma 2.2
    float displayGamma = 2.2;
    fragColor.x = pow ( linearCol.x, 1.0/displayGamma );
    fragColor.y = pow ( linearCol.y, 1.0/displayGamma );
    fragColor.z = pow ( linearCol.z, 1.0/displayGamma );
    fragColor.w = 1.0;
}
HSV gradient[edit | edit source]
- explanation by Robert P. Munafo[41]
- Basic code and images by Jean Debord[42]
- c programs by Curtis T McMullen [43]
Linear RGB gradient with 6 segments[edit | edit source]
- rainbow gradient
-
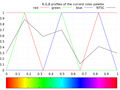 2D RGB profile
 -
 2D HSV profile
 -
 3D RGB profile


Rainbow gradient
- in scientific computing
Here gradient consists from 6 segments. In each segment only one RGB component of color is changed using linear function.
Delphi version[edit | edit source]
// Delphi version by Witold J.Janik with help Andrzeja Wąsika from [pl.comp.lang.delphi]
//  [i] changes from [iMin] to [iMax]

function GiveRainbowColor(iMin, iMax, i: Integer): TColor;
var
  m: Double;
  r, g, b, mt: Byte;
begin
  m := (i - iMin)/(iMax - iMin + 1) * 6;
  mt := (round(frac(m)*$FF));
  case Trunc(m) of
  0: begin
      R := $FF;
      G := mt;
      B := 0;
    end;
  1: begin
      R := $FF - mt;
      G := $FF;
      B := 0;
    end;
  2: begin
      R := 0;
      G := $FF;
      B := mt;
    end;
  3: begin
      R := 0;
      G := $FF - mt;
      B := $FF;
    end;
  4: begin
      R := mt;
      G := 0;
      B := $FF;
    end;
  5: begin
      R := $FF;
      G := 0;
      B := $FF - mt;
    end;
end; // case

  Result := rgb(R,G,B);
end;
/////
C version[edit | edit source]
Input of function are 2 variables :
- position of color in gradient, (a normalized float between 0.0 and 1.0 )
- color as an array of RGB components ( integer without sign from 0 to 255 )
This function does not use direct outoput ( void) but changes input variables color. One can use it this way:
GiveRainbowColor(0.25,color);
/* based on Delphi function by Witold J.Janik */
void GiveRainbowColor(double position,unsigned char c[])
{
  /* if position > 1 then we have repetition of colors it maybe useful    */

  if (position>1.0){if (position-(int)position==0.0)position=1.0; else position=position-(int)position;}


  unsigned char nmax=6; /* number of color segments */
  double m=nmax* position;

  int n=(int)m; // integer of m

  double f=m-n;  // fraction of m
  unsigned char t=(int)(f*255);


switch( n){
   case 0: {
      c[0] = 255;
      c[1] = t;
      c[2] = 0;
       break;
    };
   case 1: {
      c[0] = 255 - t;
      c[1] = 255;
      c[2] = 0;
       break;
    };
   case 2: {
      c[0] = 0;
      c[1] = 255;
      c[2] = t;
       break;
    };
   case 3: {
      c[0] = 0;
      c[1] = 255 - t;
      c[2] = 255;
       break;
    };
   case 4: {
      c[0] = t;
      c[1] = 0;
      c[2] = 255;
       break;
    };
   case 5: {
      c[0] = 255;
      c[1] = 0;
      c[2] = 255 - t;
       break;
    };
    default: {
      c[0] = 255;
      c[1] = 0;
      c[2] = 0;
       break;
    };

}; // case
}
Cpp version[edit | edit source]
// C++ version
// here are some my modification but the main code is the same
// as in Witold J.Janik code
//

Uint32 GiveRainbowColor(double position)

// this function gives 1D linear RGB color gradient
// color is proportional to position
// position  <0;1>
// position means position of color in color gradient

{
  if (position>1)position=position-int(position);
  // if position > 1 then we have repetition of colors
  // it maybe useful
  Uint8 R, G, B;// byte
  int nmax=6;// number of color bars
  double m=nmax* position;
  int n=int(m); // integer of m
  double f=m-n;  // fraction of m
  Uint8 t=int(f*255);


switch( n){
   case 0: {
      R = 255;
      G = t;
      B = 0;
       break;
    };
   case 1: {
      R = 255 - t;
      G = 255;
      B = 0;
       break;
    };
   case 2: {
      R = 0;
      G = 255;
      B = t;
       break;
    };
   case 3: {
      R = 0;
      G = 255 - t;
      B = 255;
       break;
    };
   case 4: {
      R = t;
      G = 0;
      B = 255;
       break;
    };
   case 5: {
      R = 255;
      G = 0;
      B = 255 - t;
       break;
    };

}; // case

  return (R << 16) | (G << 8) | B;
}
Sine based gradient[edit | edit source]
"The idea is to change the color based on a sine wave. This gives a nice smooth gradient effect (although it’s not linear, which is not a requirement anyway). By changing the frequency of the RGB components (we could theoretically work with other color spaces such as HSV) we can get various gradients. Also, we can also play with the phase of each color component, creating a “shifting” effect. The basic implementation of such a gradient can be implemented like so:"
/*
http://blogs.microsoft.co.il/pavely/2013/11/12/color-gradient-generator/


*/
public Color[] GenerateColors(int number) {
    var colors = new List<Color>(number);
    double step = MaxAngle / number;
    for(int i = 0; i < number; ++i) {
        var r = (Math.Sin(FreqRed * i * step + PhaseRed) + 1) * .5;
        var g = (Math.Sin(FreqGreen * i * step + PhaseGreen) + 1) * .5;
        var b = (Math.Sin(FreqBlue * i * step + PhaseBlue) + 1) * .5;
        colors.Add(Color.FromRgb((byte)(r * 255), (byte)(g * 255), (byte)(b * 255)));
    }
    return colors.ToArray();
}
"Where:
- the Freq* are the frequencies of the respective RGB colors
- Phase* are the phase shift values.
Note that all calculations are done with floating point numbers (ranging from 0.0 to 1.0), converting to a WPF Color structure (in this case) at the very end. This is simply convenient, as we’re working with trigonometric functions, which like floating point numbers rather than integers. The result is normalized to the range 0 to 1, as the sine function produces results from –1 to 1, so we add one to get a range of 0 to 2 and finally divide by 2 to get to the desired range."[44]
cubehelix[edit | edit source]
- Cubehelix gradient
-
 2D RGB profile
 -
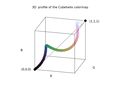 3D RGB profile


cubehelix gradient
/*
 GNUPLOT - stdfn.h
 Copyright 1986 - 1993, 1998, 2004   Thomas Williams, Colin Kelley
*/
#ifndef clip_to_01
#define clip_to_01(val)	\
    ((val) < 0 ? 0 : (val) > 1 ? 1 : (val))
#endif

/*
 input : position
 output : c array ( rgb color)

the colour scheme spirals (as a squashed helix) around the diagonal of the RGB colour cube

https://arxiv.org/abs/1108.5083
A colour scheme for the display of astronomical intensity images by D. A. Green
*/
void GiveCubehelixColor(double position, unsigned char c[]){


	/* GNUPLOT - color.h
	 * Petr Mikulik, December 1998 -- June 1999
	 * Copyright: open source as much as possible
	*/

	// t_sm_palette
  	/* gamma for gray scale and cubehelix palettes only */
  	double gamma = 1.5;

  	/* control parameters for the cubehelix palette scheme */
  	//set palette cubehelix start 0.5 cycles -1.5 saturation 1
	//set palette gamma 1.5
  	double cubehelix_start = 0.5;	/* offset (radians) from colorwheel 0 */
  	double cubehelix_cycles = -1.5;	/* number of times round the colorwheel */
  	double cubehelix_saturation = 1.0;	/* color saturation */
	double r,g,b;
	double gray = position;


	/*
 	 Petr Mikulik, December 1998 -- June 1999
 	* Copyright: open source as much as possible
 	*/
	// /* Map gray in [0,1] to color components according to colorMode */
	// function color_components_from_gray
	// from gnuplot/src/getcolor.c
	double phi, a;

	phi = 2. * M_PI * (cubehelix_start/3. +  gray * cubehelix_cycles);

	// gamma correction
	if (gamma != 1.0)    gray = pow(gray, 1./gamma);


	a = cubehelix_saturation * gray * (1.-gray) / 2.;

	// compute
	r = gray + a * (-0.14861 * cos(phi) + 1.78277 * sin(phi));
	g = gray + a * (-0.29227 * cos(phi) - 0.90649 * sin(phi));
	b = gray + a * ( 1.97294 * cos(phi));

	// normalize to [9,1] range
	r = clip_to_01(r);
	g = clip_to_01(g);
	b = clip_to_01(b);

	// change range to [0,255]
  	c[0] = (unsigned char) 255*r; //R
  	c[1] = (unsigned char) 255*g; // G
  	c[2] = (unsigned char) 255*b; // B

}
Gradient files[edit | edit source]
- Color Look-Up Table (CLUT)
File types for color gradient[edit | edit source]
There are special file types for color gradients:[45][46]
- The GIMP uses the files with .ggr extension [47]
- Fractint uses .map files [48]
- UltraFractal uses .ugr - These files can contain multiple gradients
- ual - old Ultra Fractal gradient file
- rgb, pal, gpf - gnuplot files
- The Matplotlib[49] colormap[50] is a lookup table[51]
- csv files
- maps in WHIP format ( Autodesk) by Paul Bourke
- Gnofract4D saves gradients only inside the graphic file, not as separate file.[52]
- MatLab
- Python
- R
- GMT
- QGIS
- Ncview
- Ferret
- Plotly
- Paraview
- VisIt
- Mathematica
- Surfer
- d3
- SKUA-GOCAD
- Petrel
- Fledermaus
- Qimera
- ImageJ
- Fiji
- Inkscape
- XML
- text
- SASS style sheet
- LESS - http://lesscss.org style sheet
- CSS - Cascading Style Sheet
csv files[edit | edit source]
a small table containing 33 values ( stored in a csv file) by Kenneth Moreland[53]
Scalar	R	G	B
0	59	76	192
0.03125	68	90	204
0.0625	77	104	215
0.09375	87	117	225
0.125	98	130	234
0.15625	108	142	241
0.1875	119	154	247
0.21875	130	165	251
0.25	141	176	254
0.28125	152	185	255
0.3125	163	194	255
0.34375	174	201	253
0.375	184	208	249
0.40625	194	213	244
0.4375	204	217	238
0.46875	213	219	230
0.5	221	221	221
0.53125	229	216	209
0.5625	236	211	197
0.59375	241	204	185
0.625	245	196	173
0.65625	247	187	160
0.6875	247	177	148
0.71875	247	166	135
0.75	244	154	123
0.78125	241	141	111
0.8125	236	127	99
0.84375	229	112	88
0.875	222	96	77
0.90625	213	80	66
0.9375	203	62	56
0.96875	192	40	47
1	180	4	38
CSS syntax[edit | edit source]
The default color space for mixing (and gradients) in CSS is oklab
Linear gradients[edit | edit source]
Non-repeating[edit | edit source]
Color gradients[56]
| Css code | description | Preview image |
|---|---|---|
linear-gradient(in lab to right, white, #01E)
|
CIE Lab gradient, which avoids the too-dark midpoint but has a significant purple cast; | |
linear-gradient(in srgb to right, white, #01E)
|
gamma-encoded sRGB gradient, is too dark at the midpoint, is a little desaturated, and has a slight purplish cast | |
linear-gradient(in Oklab to right, white, #01E)
|
Oklab gradient, giving a more perceptually uniform result with no purple cast at all | |
linear-gradient(to right, #a8c0ff, #3f2b96);
|
Ocean View | |
linear-gradient(in Oklab to right, #44C, #795)
|
Oklab gradient, perceptually uniform result with no purple cast at all | |
linear-gradient(in Oklab to right, black, #01E)
|
Oklab gradient, perceptually uniform result | |
linear-gradient(cyan, yellow);
|
||
linear-gradient(to left, violet, indigo, blue, green, yellow, orange, red);
|
VIBGYOR rainbow | |
linear-gradient(90deg, rgba(2,0,36,1) 0%, rgba(9,9,121,1) 35%, rgba(0,212,255,1) 100%);
|
black-to-white-gradient-in-each-space[57]
| description | Preview image |
|---|---|
| Oklab, perceptually uniform result | |
| oklch | |
| lab | |
| lch | |
| srgb | |
| srgb-linear | |
| hsl | |
| hwb | |
| xyz | |
| xyz-d50 | |
| xyz-d65 |
Repeating[edit | edit source]
| Code | Preview |
|---|---|
.gradient5 {
  background-image: repeating-linear-gradient(cyan 0%, yellow 50%);
}
|
|
.gradient6 {
  background-image: repeating-linear-gradient(to right, blue 0%, magenta 10%);
}
|
|
.gradient7 {
  background-image: repeating-linear-gradient(60deg, cyan 0%, teal 23%, lime 31%);
}
|
conic[edit | edit source]
/* Hue wheel */ background: conic-gradient(red, yellow, lime, aqua, blue, magenta, red); border-radius: 50%
| Css code | description | Preview image |
|---|---|---|
conic-gradient(red, yellow, lime, aqua, blue, magenta, red); border-radius: 50%
|
color wheel |
Fractint map files[edit | edit source]
The default filetype extension for color-map files is ".MAP". These are ASCII text files. Consist of a series of RGB triplet values (one triplet per line, encoded as the red, green, and blue [RGB] components of the color). Color map ( or palette) is used as a colour look-up table[58] Default color map is in the Default.map file :
0 0 0            The default VGA color map
0 0 168
0 168 0
0 168 168
168 0 0
168 0 168
168 84 0
168 168 168
84 84 84
84 84 252
84 252 84
84 252 252
252 84 84
252 84 252
252 252 84
252 252 252
0 0 0
20 20 20
32 32 32
44 44 44
56 56 56
68 68 68
80 80 80
96 96 96
112 112 112
128 128 128
144 144 144
160 160 160
180 180 180
200 200 200
224 224 224
252 252 252
0 0 252
64 0 252
124 0 252
188 0 252
252 0 252
252 0 188
252 0 124
252 0 64
252 0 0
252 64 0
252 124 0
252 188 0
252 252 0
188 252 0
124 252 0
64 252 0
0 252 0
0 252 64
0 252 124
0 252 188
0 252 252
0 188 252
0 124 252
0 64 252
124 124 252
156 124 252
188 124 252
220 124 252
252 124 252
252 124 220
252 124 188
252 124 156
252 124 124
252 156 124
252 188 124
252 220 124
252 252 124
220 252 124
188 252 124
156 252 124
124 252 124
124 252 156
124 252 188
124 252 220
124 252 252
124 220 252
124 188 252
124 156 252
180 180 252
196 180 252
216 180 252
232 180 252
252 180 252
252 180 232
252 180 216
252 180 196
252 180 180
252 196 180
252 216 180
252 232 180
252 252 180
232 252 180
216 252 180
196 252 180
180 252 180
180 252 196
180 252 216
180 252 232
180 252 252
180 232 252
180 216 252
180 196 252
0 0 112
28 0 112
56 0 112
84 0 112
112 0 112
112 0 84
112 0 56
112 0 28
112 0 0
112 28 0
112 56 0
112 84 0
112 112 0
84 112 0
56 112 0
28 112 0
0 112 0
0 112 28
0 112 56
0 112 84
0 112 112
0 84 112
0 56 112
0 28 112
56 56 112
68 56 112
84 56 112
96 56 112
112 56 112
112 56 96
112 56 84
112 56 68
112 56 56
112 68 56
112 84 56
112 96 56
112 112 56
96 112 56
84 112 56
68 112 56
56 112 56
56 112 68
56 112 84
56 112 96
56 112 112
56 96 112
56 84 112
56 68 112
80 80 112
88 80 112
96 80 112
104 80 112
112 80 112
112 80 104
112 80 96
112 80 88
112 80 80
112 88 80
112 96 80
112 104 80
112 112 80
104 112 80
96 112 80
88 112 80
80 112 80
80 112 88
80 112 96
80 112 104
80 112 112
80 104 112
80 96 112
80 88 112
0 0 64
16 0 64
32 0 64
48 0 64
64 0 64
64 0 48
64 0 32
64 0 16
64 0 0
64 16 0
64 32 0
64 48 0
64 64 0
48 64 0
32 64 0
16 64 0
0 64 0
0 64 16
0 64 32
0 64 48
0 64 64
0 48 64
0 32 64
0 16 64
32 32 64
40 32 64
48 32 64
56 32 64
64 32 64
64 32 56
64 32 48
64 32 40
64 32 32
64 40 32
64 48 32
64 56 32
64 64 32
56 64 32
48 64 32
40 64 32
32 64 32
32 64 40
32 64 48
32 64 56
32 64 64
32 56 64
32 48 64
32 40 64
44 44 64
48 44 64
52 44 64
60 44 64
64 44 64
64 44 60
64 44 52
64 44 48
64 44 44
64 48 44
64 52 44
64 60 44
64 64 44
60 64 44
52 64 44
48 64 44
44 64 44
44 64 48
44 64 52
44 64 60
44 64 64
44 60 64
44 52 64
44 48 64
0 0 0
0 0 0
0 0 0
0 0 0
0 0 0
0 0 0
0 0 0
0 0 0
Gimp/Inscape gpl files[edit | edit source]
Used by : Gimp, Inscape, Aseprite, Drawpile, Krita, MyPaint[59]
Syntax:
- ASCII files ( text files)[60]
- Comments must start with a #. In non-empty lines that don't, the first three tokens are parsed as numbers
- There is no alpha support
- GIMP Palette - it must be the first line of the file[61]
- Name: <name> - sets the name of the color palette.
- Columns: <number> - is just an indication for displaying the palette inside GIMP.
- # <comment> - comments must start with a #. All comments are ignored by GIMP.
- 0 0 0 Black - RGB values for the color followed by the color name
Source code of loader function [62]
GIMP palettes are stored using a special file format, in files with the extension .gpl.
Directory:
- ~/.config/GIMP/x.y/palettes/ directory (where x.y is the GIMP version number)
- ~/.config/inkscape/palettes/
GIMP Palette
Name: Material Design
Columns: 14
#
255 248 225		amber 50
255 236 179		amber 100
255 224 130		amber 200
255 213  79		amber 300
255 202  40		amber 400
255 193   7		amber 500
255 179   0		amber 600
255 160   0		amber 700
255 143   0		amber 800
255 111   0		amber 900
255 229 127		amber a100
255 215  64		amber a200
255 196   0		amber a400
255 171   0		amber a700
227 242 253		blue 50
187 222 251		blue 100
144 202 249		blue 200
100 181 246		blue 300
 66 165 245		blue 400
 33 150 243		blue 500
 30 136 229		blue 600
 25 118 210		blue 700
 21 101 192		blue 800
 13  71 161		blue 900
130 177 255		blue a100
 68 138 255		blue a200
 41 121 255		blue a400
 41  98 255		blue a700
224 247 250		cyan 50
178 235 242		cyan 100
128 222 234		cyan 200
 77 208 225		cyan 300
 38 198 218		cyan 400
  0 188 212		cyan 500
  0 172 193		cyan 600
  0 151 167		cyan 700
  0 131 143		cyan 800
  0  96 100		cyan 900
132 255 255		cyan a100
 24 255 255		cyan a200
  0 229 255		cyan a400
  0 184 212		cyan a700
251 233 231		deep-orange 50
255 204 188		deep-orange 100
255 171 145		deep-orange 200
255 138 101		deep-orange 300
255 112  67		deep-orange 400
255  87  34		deep-orange 500
244  81  30		deep-orange 600
230  74  25		deep-orange 700
216  67  21		deep-orange 800
191  54  12		deep-orange 900
255 158 128		deep-orange a100
255 110  64		deep-orange a200
255  61   0		deep-orange a400
221  44   0		deep-orange a700
237 231 246		deep-purple 50
209 196 233		deep-purple 100
179 157 219		deep-purple 200
149 117 205		deep-purple 300
126  87 194		deep-purple 400
103  58 183		deep-purple 500
 94  53 177		deep-purple 600
 81  45 168		deep-purple 700
 69  39 160		deep-purple 800
 49  27 146		deep-purple 900
179 136 255		deep-purple a100
124  77 255		deep-purple a200
101  31 255		deep-purple a400
 98   0 234		deep-purple a700
232 245 233		green 50
200 230 201		green 100
165 214 167		green 200
129 199 132		green 300
102 187 106		green 400
 76 175  80		green 500
 67 160  71		green 600
 56 142  60		green 700
 46 125  50		green 800
 27  94  32		green 900
185 246 202		green a100
105 240 174		green a200
  0 230 118		green a400
  0 200  83		green a700
232 234 246		indigo 50
197 202 233		indigo 100
159 168 218		indigo 200
121 134 203		indigo 300
 92 107 192		indigo 400
 63  81 181		indigo 500
 57  73 171		indigo 600
 48  63 159		indigo 700
 40  53 147		indigo 800
 26  35 126		indigo 900
140 158 255		indigo a100
 83 109 254		indigo a200
 61  90 254		indigo a400
 48  79 254		indigo a700
225 245 254		light-blue 50
179 229 252		light-blue 100
129 212 250		light-blue 200
 79 195 247		light-blue 300
 41 182 246		light-blue 400
  3 169 244		light-blue 500
  3 155 229		light-blue 600
  2 136 209		light-blue 700
  2 119 189		light-blue 800
  1  87 155		light-blue 900
128 216 255		light-blue a100
 64 196 255		light-blue a200
  0 176 255		light-blue a400
  0 145 234		light-blue a700
241 248 233		light-green 50
220 237 200		light-green 100
197 225 165		light-green 200
174 213 129		light-green 300
156 204 101		light-green 400
139 195  74		light-green 500
124 179  66		light-green 600
104 159  56		light-green 700
 85 139  47		light-green 800
 51 105  30		light-green 900
204 255 144		light-green a100
178 255  89		light-green a200
118 255   3		light-green a400
100 221  23		light-green a700
249 251 231		lime 50
240 244 195		lime 100
230 238 156		lime 200
220 231 117		lime 300
212 225  87		lime 400
205 220  57		lime 500
192 202  51		lime 600
175 180  43		lime 700
158 157  36		lime 800
130 119  23		lime 900
244 255 129		lime a100
238 255  65		lime a200
198 255   0		lime a400
174 234   0		lime a700
255 243 224		orange 50
255 224 178		orange 100
255 204 128		orange 200
255 183  77		orange 300
255 167  38		orange 400
255 152   0		orange 500
251 140   0		orange 600
245 124   0		orange 700
239 108   0		orange 800
230  81   0		orange 900
255 209 128		orange a100
255 171  64		orange a200
255 145   0		orange a400
255 109   0		orange a700
252 228 236		pink 50
248 187 208		pink 100
244 143 177		pink 200
240  98 146		pink 300
236  64 122		pink 400
233  30  99		pink 500
216  27  96		pink 600
194  24  91		pink 700
173  20  87		pink 800
136  14  79		pink 900
255 128 171		pink a100
255  64 129		pink a200
245   0  87		pink a400
197  17  98		pink a700
243 229 245		purple 50
225 190 231		purple 100
206 147 216		purple 200
186 104 200		purple 300
171  71 188		purple 400
156  39 176		purple 500
142  36 170		purple 600
123  31 162		purple 700
106  27 154		purple 800
 74  20 140		purple 900
234 128 252		purple a100
224  64 251		purple a200
213   0 249		purple a400
170   0 255		purple a700
255 235 238		red 50
255 205 210		red 100
239 154 154		red 200
229 115 115		red 300
239  83  80		red 400
244  67  54		red 500
229  57  53		red 600
211  47  47		red 700
198  40  40		red 800
183  28  28		red 900
255 138 128		red a100
255  82  82		red a200
255  23  68		red a400
213   0   0		red a700
224 242 241		teal 50
178 223 219		teal 100
128 203 196		teal 200
 77 182 172		teal 300
 38 166 154		teal 400
  0 150 136		teal 500
  0 137 123		teal 600
  0 121 107		teal 700
  0 105  92		teal 800
  0  77  64		teal 900
167 255 235		teal a100
100 255 218		teal a200
 29 233 182		teal a400
  0 191 165		teal a700
255 253 231		yellow 50
255 249 196		yellow 100
255 245 157		yellow 200
255 241 118		yellow 300
255 238  88		yellow 400
255 235  59		yellow 500
253 216  53		yellow 600
251 192  45		yellow 700
249 168  37		yellow 800
245 127  23		yellow 900
255 255 141		yellow a100
255 255   0		yellow a200
255 234   0		yellow a400
255 214   0		yellow a700
236 239 241		blue-grey 50
207 216 220		blue-grey 100
176 190 197		blue-grey 200
144 164 174		blue-grey 300
120 144 156		blue-grey 400
 96 125 139		blue-grey 500
 84 110 122		blue-grey 600
 69  90 100		blue-grey 700
 55  71  79		blue-grey 800
 38  50  56		blue-grey 900
239 235 233		brown 50
215 204 200		brown 100
188 170 164		brown 200
161 136 127		brown 300
141 110  99		brown 400
121  85  72		brown 500
109  76  65		brown 600
 93  64  55		brown 700
 78  52  46		brown 800
 62  39  35		brown 900
250 250 250		grey 50
245 245 245		grey 100
238 238 238		grey 200
224 224 224		grey 300
189 189 189		grey 400
158 158 158		grey 500
117 117 117		grey 600
 97  97  97		grey 700
 66  66  66		grey 800
 33  33  33		grey 900
  0   0   0	   	black
255 255 255	white
Gimp ggr files[edit | edit source]
"The gradients that are supplied with GIMP are stored in a system gradients folder. By default, gradients that you create are stored in a folder called gradients in your personal GIMP directory. Any gradient files (ending with the extension .ggr) found in one of these folders, will automatically be loaded when you start GIMP" ( from gimp doc ) Default gradients are in /usr/share/gimp/2.0/gradients directory ( check it in a window : Edit/preferences/directories)
Git repo
Gimp gradients can be created thru :
- GUI [63]
- manually in text editor ( use predefined gradients as a base)
- in own programs
Gimp gradient file format is described in:
- GIMP Application Reference Manual [64]
- source files :
- app/gradient.c and app/gradient_header.h for GIMP 1.3 version.[65]
- gimp-2.6.0/app/core/gimpgradient.c
Gimp Gradient Segment format :
typedef struct {
  gdouble                  left, middle, right;

  GimpGradientColor        left_color_type;
  GimpRGB                  left_color;
  GimpGradientColor        right_color_type;
  GimpRGB                  right_color;

  GimpGradientSegmentType  type;          /*  Segment's blending function  */
  GimpGradientSegmentColor color;         /*  Segment's coloring type      */

  GimpGradientSegment     *prev;
  GimpGradientSegment     *next;
} GimpGradientSegment;
In GimpConfig style format:[66]
<proposal>
# GIMP Gradient file

(GimpGradient "Abstract 1"
        (segment 0.000000 0.286311 0.572621
                (left-color (gimp-rgba 0.269543 0.259267 1.000000 1.000000))
                (right-color (gimp-rgba 0.215635 0.407414 0.984953 1.000000))
                (blending-function linear)
                (coloring-type rgb))
        (segment ...)
        ...
        (segment ...))
</proposal>
GIMP Gradient
Name: GMT_hot
3
0.000000 0.187500 0.375000 0.000000 0.000000 0.000000 1.000000 1.000000 0.000000 0.000000 1.000000 0 0
0.375000 0.562500 0.750000 1.000000 0.000000 0.000000 1.000000 1.000000 1.000000 0.000000 1.000000 0 0
0.750000 0.875000 1.000000 1.000000 1.000000 0.000000 1.000000 1.000000 1.000000 1.000000 1.000000 0 0
First line says it is a gimp gradient file.
Second line is a gradient's name.
Third line tells the number of segments in the gradient.
Each line following defines the property of each segment in following order :"[68]
- position of left stoppoint
- position of middle point
- position of right stoppoint
- R for left stoppoint
- G for left stoppoint
- B for left stoppoint
- A for left stoppoint
- R for right stoppoint
- G for right stoppoint
- B for right stoppoint
- A for right stoppoint
- Blending function constant
- coloring type constant
There are only two constants at the end of each line:
- the blending function constant of the segment (apparently 0=Linear, 1=Curved, 2=Sinusoidal, 3=Spherical (increasing), 4=Spherical (decreasing))
- the coloring type constant of the segment (probably 0=RGB, 1=HSV (counter-clockwise hue), 2=HSV (clockwise hue)[69]
json[edit | edit source]
links[edit | edit source]
- cpp code by Patrick Ross
- Reading gimp ggr files in python by Ned Batchelder
- Python Pil library functions for reading GIMP gradient files ( in file GimpGradientFile.py)
- perl scripts to convert gimp-1.2.x palettes and gradients into a 1.3 form by Jeff Trefftzs
- Gimp Python plugin: make-gradient.py by Giuseppe Conte
- gimp gradient files - lisp code from Polypen by Yannick Gingras
- Perl functions from GIMP pdb - gradient.pdb
- stackoverflow : javascript-color-gradient
- c pseudocode and js code by Christopher Williams
- Lode's Computer Graphics Tutorial : Light and Color
- bruce lindbloom : color equations
Collections of gradients / colormaps[edit | edit source]
- gradcentral
- Cpt-city
- gimp gradients (ggr files) are in directory : /usr/share/gimp/2.0/gradients/
- The COLOURlovers site hosts a million 5-colour palettes in several formats
- thi.ng
- SciVisColor
- Fabio Crameri: scientific colourmaps in provided in all major formats
programs[edit | edit source]
- [1] Color tools for design systems
- gnuplot
- mdigi tools color: Color tools for the web listed alphabetically
- The CCC-Tool[70] is a general tool for the creation, analyzing and testing of colormaps with the effort to minimize the needed interaction components.
- image magic[71]
- OpenCV library
- python
- colorAide A library to aid in using colors
- coloria Tools for color research
- colour-science: Colour is an open-source Python package providing a comprehensive number of algorithms and datasets for colour science.
- colour = color representations manipulation library (RGB, HSL, web, ...) by Valentin Lab
- njsmith: colorspacious: A powerful, accurate, and easy-to-use Python library for doing colorspace conversions
- Colour is an open-source Python package providing a comprehensive number of algorithms and datasets for colour science. It is freely available under the New BSD License terms. Colour is an affiliated project of NumFOCUS, a 501(c)(3) nonprofit in the United States.
- matplotlib
- matplotlib: viscm A tool for visualizing and designing colormaps using colorspacious and matplotlib
- math3d : sphere colormap
- VIVID GRADIENT GENERATOR TOOL by learn ui design
- paletton- color scheme designer and generator
- Image Magic
color convert[edit | edit source]
- qConv.com - The quick converter and color manager. The powerful color database for designers and agencies.
- hextoral color converter
- colormine color-converter
- ColorSpace: C++ library for converting between color spaces and comparing colors by Nicolae Berendea
- farver: High Performance Colourspace Manipulation in R. Src code in c++. It provides an interface to a modified version of the ColorSpace C++ library.
split your hexadecimal color code into 3 values, that could be treated as RGB vectors (RGB decimals) ( from hextoral)
color gradient convert[edit | edit source]
- ggr2glsl is a simple utility to convert GIMP gradient files to GLSL functions.
- gradient-converter-apophysis-to-kalles-fraktaler
tests[edit | edit source]
Test your :
- monitor ( gamut)
- graphic card
- printer
- own
Test your color abilities[edit | edit source]
- The X-Rite Color Challenge and Hue Test
- The FM100 Hue Test is an easy-to-administer test and a highly effective method for evaluating an individual's ability to discern color.
How to choose color gradient ?[edit | edit source]
- How to Choose Colours Procedurally (Algorithms) 29 Jul, 2012 by Herman Tulleken
- perceptually-smooth-multi-color-linear-gradients by Matt DesLauriers Jan 25, 2021
- Nonlinear Color Scales for Interactive Exploration by Young Hyun
- gencolormap
- Color Maps for Scientific Visualization by Kenneth Moreland
- In Search of a Perfect Colormap by Peter Karpov
- Good Colour Maps: How to Design Them by Peter Kovesi
- Rainbow Color Map Critiques: An Overview and Annotated Bibliography By Steve Eddins, MathWorks
- scivis tutorials
- Matteo Niccoli
- bids: Colormap recommendation
How to visualize/test/evaluate/compare colormaps?[edit | edit source]
In python to visualize matplotlib built-in colormaps:
python -m viscm view jet
To visualize one of viscm colormaps:
python -m viscm view path/to/colormap_script.py
In gnuplot use test command:
set palette rgbformulae 21,22,23
set terminal gif
set output 'p.gif'
test palette
Results: 2D profiles of each color channel


One can also make curve through RGB colorspace:

![diverging[73]](/wiki/File:3D_RGB_profile_of_the_Smooth_Cool_Warm_diverging_color_gradient_by_Kenneth_Moreland.png)
R code
# Install the released version from CRAN:
install.packages("pals")
# Loading required package: pals
require(pals)
# The palette is converted to RGB or LUV coordinates and plotted in a three-dimensional scatterplot. The LUV space is probably better, but it is easier to tweak colors by hand in RGB space.
pal.cube(cubehelix)
pal.cube(coolwarm)
Tips:
- A good discrete palette has distinct colors
- A good continuous colormap does not show boundaries between colors
See also
- How to evaluate and compare color maps by SEG
- pals: R programming language package to evaluate colormaps
- colorcet test image
- matplotlib color map manipultions
- Kenneth Moreland: color-advice
- David Johnstone: lch-lab-colour-gradient-picker
- ccc tool
- scivis color : color moves app
- color brewer colomaps
How to make perceptually uniform gradient?[edit | edit source]
- How to generate a perceptually uniform gradient with CAM16UCS colour model?
- stackoverflow qestion: more-perceptually-uniform-colormaps
- CMasher: Scientific, perceptually uniform colormaps
- colorcet : Perceptually Uniform Colour Maps by Peter Kovesi
- matplotlib cmocean : Beautiful colormaps for oceanography. Most of the colormaps started from matplotlib colormaps, but have now been adjusted using the viscm tool to be perceptually uniform.
How to make colormap with maximum distinguishable colours?[edit | edit source]
- stackoverflow question: colormap-with-maximum-distinguishable-colours
- Colorgorical To generate a palette with n colors,
How to use special values in colormap?[edit | edit source]
How to Calculate the average color of an image ?[edit | edit source]
Averaging RGB should be correct assuming you do it in linear RGB. If your images are in sRGB, you can remove the gamma correction by doing something like the following for each of the R, G, and B components:
   float sRGBToLinear(UInt8 component)
   {
       float tempComponent = (float)component / 255.0;
       if (tempComponent <= 0.04045)
       {
           tempComponent = tempComponent / 12.92;
       }
       else
       {
           tempComponent = pow((tempComponent + 0.055) / (1.055), 2.4);
       }
       return tempComponent;
   }
You can then average together all of the red values in the image, all of the green values in the image, and all of the blue values in the image after they've been run through the above conversion. You can then do the opposite conversion to get back to sRGB:
   UInt8 linearRGBTosRGB(float component)
   {
       float tempComponent =  0.0;
       if (component <= 0.00318308)
       {
           tempComponent = 12.92 * component;
       }
       else
       {
           tempComponent = 1.055 * pow(component, 1.0 / 2.4) - 0.055;
       }
       return (UInt8)(tempComponent * 255.0);
   }
Note that alpha makes things slightly more complicated. If you're using premultiplied alpha, you can simply apply the above calculations for the average. If you're using straight alpha, you'll want to multiply each of the R, G, and B components by the alpha before doing the averaging.[74]
How to render light spectrum?[edit | edit source]
How to read(pick) color from the image ?[edit | edit source]
- Pick Color From Image by ginifab
- pick-a-color-from-an-image-using-canvas-and-javascript by nakome
- developer mozilla: getting_the_pixel_data_for_a_context
- How to get the pixel color from a canvas on click or mouse event with Javascript from ourcodeworld
How to read color gradient from image ?[edit | edit source]
- online
- color.adobe tool
- color-loom/ Colorloom is a tool developed by the Sculpting Vis Collaborative and inspired to mimic palette creation in the arts. The tool extracts a selection of hues from images and enables users to create continuous colormaps by dragging these extracted hues into a desired order, all within the same interface. These colormaps can be exported in a variety of formats for use in major visualization software.
How to extract color palette from image ?[edit | edit source]
- Colores.py—extract color palettes from your favorite images [75]
- Color Scheme Extraction[76]
- using Image Magic [77]
- using Gimp [78]
- "There is this small tool in fractalshades that interactively grabs a colormap from a line you draw on an image, the editor looks like the attached picture. Not perfect, but I found it useful (in the 'tools' section). The cmap can then be used in the program or exported for later use (for the time being, exports only to a txt format specific to this program.)" Geoffroy Billotey (GBillotey)[79]
How to extract ICC profile from the image file ?[edit | edit source]
Using Image Magic:[80]
convert photo.jpg profile.icc
How to view ICC profile ?
exiftool a.icc
Example output:
ExifTool Version Number         : 12.40
File Name                       : vw1.icc
Directory                       : .
File Size                       : 548 bytes
File Modification Date/Time     : 2023:11:12 20:48:16+01:00
File Access Date/Time           : 2023:11:12 20:48:47+01:00
File Inode Change Date/Time     : 2023:11:12 20:48:16+01:00
File Permissions                : -rw-rw-r--
File Type                       : ICC
File Type Extension             : icc
MIME Type                       : application/vnd.iccprofile
Profile CMM Type                : Apple Computer Inc.
Profile Version                 : 4.0.0
Profile Class                   : Display Device Profile
Color Space Data                : RGB
Profile Connection Space        : XYZ
Profile Date Time               : 2018:06:24 13:22:32
Profile File Signature          : acsp
Primary Platform                : Apple Computer Inc.
CMM Flags                       : Not Embedded, Independent
Device Manufacturer             : Unknown (OPPO)
Device Model                    :
Device Attributes               : Reflective, Glossy, Positive, Color
Rendering Intent                : Perceptual
Connection Space Illuminant     : 0.9642 1 0.82491
Profile Creator                 : Apple Computer Inc.
Profile ID                      : 0
Profile Description             : Display P3
Profile Copyright               : Copyright Apple Inc., 2017
Media White Point               : 0.95045 1 1.08905
Red Matrix Column               : 0.51512 0.2412 -0.00105
Green Matrix Column             : 0.29198 0.69225 0.04189
Blue Matrix Column              : 0.1571 0.06657 0.78407
Red Tone Reproduction Curve     : (Binary data 32 bytes, use -b option to extract)
Chromatic Adaptation            : 1.04788 0.02292 -0.0502 0.02959 0.99048 -0.01706 -0.00923 0.01508 0.75168
Blue Tone Reproduction Curve    : (Binary data 32 bytes, use -b option to extract)
Green Tone Reproduction Curve   : (Binary data 32 bytes, use -b option to extract)
How to find lighter and darker colors based on any initial color ?[edit | edit source]
- 0to255 a color tool by Shaun Chapman uses the lightness (L) scale from HSL
- stackoverflow : formula-to-determine-brightness-of-rgb-color
- stackoverflow : programmatically-lighten-or-darken-a-hex-color-or-rgb-and-blend-colors
- learnwebgl: model_color by C. Wayne Brown: To change a color (r,g,b) to make it lighter, move it closer to (1,1,1). To change a color (r,g,b) to make it darker, move it closer to (0,0,0).
  // darker by C. Wayne Brown
  newR = R + (0-R)*t;  // where t varies between 0 and 1
  newG = G + (0-G)*t;  // where t varies between 0 and 1
  newB = B + (0-B)*t;  // where t varies between 0 and 1


  // lighter C. Wayne Brown
  newR = R + (1-R)*t;  // where t varies between 0 and 1
  newG = G + (1-G)*t;  // where t varies between 0 and 1
  newB = B + (1-B)*t;  // where t varies between 0 and 1
How to remove gradient banding ?[edit | edit source]
How to generate and refine palettes of optimally distinct colors[edit | edit source]
How to simulating colors of the sky ?[edit | edit source]
How to make quality images?[edit | edit source]
Gradient contours[edit | edit source]
- description by Alan Gibson.[81]
Examples of beautiful gradients[edit | edit source]
- Mandelbrot 109 - Mandelflake by olbaid-st
- a slight motion in the colour gradient
See also[edit | edit source]
- Color_calibration
- Color correction
- Color terms
- Swatch Book = color palette in digital terminology, collection of material fragments in different colors, Paper color swatch book, Wool swatch book
- Image noise
- Commons Category:Color in computer graphics
- stackoverflow questions tagged gradient
- github topics
- scratchapixel: simulating-sky
- Color by Bruce MacEvoy
- The X-Rite Color Challenge and Hue Test
- colour lovers: Color/s, Pattern/s, Palette/s, Lover/s or stats
- gamma correction
- coloring algorithms
- perceptually uniform color space
- bruce lindbloom
- gradient maps by bjango: Gradient maps in Photoshop use brightness to assign corresponding colours taken from a gradient of your choice
References[edit | edit source]
- ↑ dsp.stackexchange question: why-do-we-use-the-hsv-colour-space-so-often-in-vision-and-image-processing
- ↑ stackoverflow question:how-can-i-plot-nan-values-as-a-special-color-with-imshow
- ↑ matplotlib: Colormap set_bad
- ↑ Completely Painless Programmer's Guide to XYZ, RGB, ICC, xyY, and TRCs by Elle Stone
- ↑ fractalforums.org: smooth-1d-coloring
- ↑ observablehq mjbo: perceptually-uniform-color-models
- ↑ R2.1/2.C(1/2) by Robert Munafo
- ↑ Color by Robert Munafo
- ↑ Mandelbrot and Julia sets with PANORAMIC and FreeBASIC By jdebord
- ↑ The Mandelbrot Function by John J. G. Savard
- ↑ The Mandelbrot Function 2 by John J. G. Savard
- ↑ fractalforums.org/: 2d-coloring
- ↑ Visualizing complex analytic functions using domain coloring by Hans Lundmark
- ↑ w3docs color-hwb
- ↑ New gradient interpolation options ( Last updated on May 24, 2023) from Adobe
- ↑ Optimizing Oklab gradients by Aras Pranckevičius.
- ↑ drafts csswg org: css-color-4
- ↑ drafts csswg.org: css-color-4
- ↑ The Fractal Explorer Pixel Bender filters by Tom Beddard
- ↑ What's Delphi TColor format? at ACASystems
- ↑ Delhi TColor at efg2.com
- ↑ wikipedia :Colour_look-up_table
- ↑ fractalforums : creating-a-good-palette-using-bezier-interpolation
- ↑ FracTest : palettes
- ↑ stefanbion : fraktal-generator and colormapping/
- ↑ nvidia gpu gems2 : using-lookup-tables-accelerate-color
- ↑ Paul Tol's notes
- ↑ gmic : color_presets
- ↑ Fractal Forums > Fractal Software > Fractal Programs > Windows Fractal Software > Fractal eXtreme > Converting between FractInt and Fractal eXtreme palettes
- ↑ stackoverflow question : smooth-spectrum-for-mandelbrot-set-rendering
- ↑ on-rainbows by Charlie Loyd
- ↑ Stefan Bion : color mapping
- ↑ stackoverflow question : which-color-gradient-is-used-to-color-mandelbrot-in-wikipedia
- ↑ Making annoying rainbows in javascript A tutorial by jim bumgardner
- ↑ mandel.js by Christopher Williams
- ↑ Custom Palettes by Christopher Williams
- ↑ Gradient jQuery plugin Posted by David Wees
- ↑ C++ function by Richel Bilderbeek
- ↑ Multiwave coloring for Mandelbrot
- ↑ histogram colouring is really streching (not true histogram)
- ↑ Color by Robert Munafo
- ↑ Mandelbrot and Julia sets with PANORAMIC and FreeBASIC By Jean Debord
- ↑ c programs by Curtis T McMullen
- ↑ color-gradient-generator by Pavel
- ↑ Color gradient file formats explained
- ↑ 29 Colour Map Formats... by Peter Kovesi
- ↑ GIMP add-ons: types, installation, management by Alexandre Prokoudine
- ↑ Fractint Palette Maps and map files
- ↑ matplotlib: colormap-manipulation
- ↑ matplotlib colormaps
- ↑ wikipedia: Lookup table
- ↑ gnofract4d manual
- ↑ kenneth moreland: color-maps
- ↑ w3.org docs : gradient
- ↑ stackoverflow question : how-is-a-css-gradient-path-calculated ?
- ↑ New functions, gradients, and hues in CSS colors (Level 4) by Smith 3 May 2023
- ↑ developer chrome articles: css-color-mix
- ↑ w:Colour look-up table
- ↑ About A collection of RGB color palettes for GIMP and Inkscape (but also Aseprite, Drawpile, Krita and MyPaint) by Dezmerean Robert
- ↑ stackoverflow question: gimp-palette-file-gpl-format-syntax
- ↑ Add custom color palettes to GIMP and Inkscape by Dezmerean Robert
- ↑ Source code of gimp load palette function
- ↑ gimp-gradient-editor-dialog doc
- ↑ GimpGradient doc at GIMP Application Reference Manual
- ↑ [Gimp-developer] Format of GIMP gradient files
- ↑ [Gimp-developer] Format of GIMP gradient files
- ↑ [Gimp-developer] Format of GIMP gradient files
- ↑ gpr format description by Vinay S Raikar
- ↑ Emulating ggr/GIMP gradient in JavaFx
- ↑ CCC-Tool
- ↑ imagemagick : gradient
- ↑ Dave Green's 'cubehelix' colour scheme
- ↑ Diverging Color Maps for Scientific Visualization - Kenneth Moreland
- ↑ computergraphics SE question: calculate-the-average-color-of-an-image
- ↑ extract color palletes from your favorite images by John Mangual
- ↑ algorithmia : create-a-custom-color-scheme-from-your-favorite-website/
- ↑ ImageMagick v6 Examples -- Color Quantization and Dithering
- ↑ Tool to extract palette / color table from image
- ↑ fractalforums.org : beautiful-and-effective-coloring-of-fractals
- ↑ rawpedia: how to extract and examine ICC profiles ?
- ↑ gradint contours by Alan Gibson